Inglés (pdf)
 Articulo en XML
 Referencias del artículo
 Enviar articulo por email
 Citado por SciELO
  Similares en
SciELO
Similares en
SciELO 
 Permalink
INTRODUCTION
Cloud Computing, also known simply as cloud, is a set of technology services that allows accessing, storing, and processing of data through the Internet. The cloud has changed the way Information Technology (IT) technicians (e.g., IT managers, cloud architects, software engineers, etc.) manage the IT resources (e.g., servers, routers, load balancers, networking, etc.) to support the developing and deploying of software applications. The traditional strategy of buying expensive hardware and hosting them in physical space is currently being replaced by a more versatile strategy known as cloud infrastructure provisioning.
Cloud infrastructure provisioning consists of managing the infrastructure resources using services from infrastructure providers (e.g., Amazon Web Services, Microsoft Azure, Google Computing Engine, etc.). Providers make available a wide range of virtualized infrastructure resources to support IT technicians in defining (i.e., plan, create, and configure) the infrastructure resources (RedHat, 2023).
In practice, IT technicians use a Command Line Interface (CLI) console to write code scripts to define hardware resources to provision. There is a CLI for each provider, which means the commands used for each provider are different. In some cases, the CLI console is also available as a Web user interface. Sandobalin et al. (2017) point out that the infrastructure provisioning process can be time-consuming and prone to human errors due to the manual process of defining scripts.
In this context, using the User Interface (UI) is a challenge since the commands (in the case of CLI) or interactions (in the case of the Web user interface) are particular for each cloud provider. Consequently, the IT technician must learn the particular commands or interactions for each cloud provider (e.g., to define a virtual machine, the commands provided by Amazon Web Services are different from commands provided by Microsoft Azure). UI can be responsible for a high learning curve or the cognitive load related to learning a lot of CLI commands, which are exclusive to each infrastructure provider. Therefore, improving how IT technicians interact with the UI to manage infrastructure provisioning becomes necessary in this domain.
the extent to which a product can be used by specific users to achieve specific objectives with effectiveness, efficiency, and satisfaction in a specific context of use.User-Centered DesignThe core of UCD philosophy focuses mainly on the users’ characteristics and goals to design a UI tailored to the user interaction needs. To do that, UCD is based on three foundational principles (Wallach and Scholz, 2012): i) focused on users (i.e., the users are involved from the earliest stages of the design process), ii) empirical measurement (i.e., measurement of usability using prototypes), and iii) iterative (i.e., prototypes are refined continuously to meet the user requirements).
To achieve those principles, UCD provides an iterative design process consisting of four distinct activities described in ISO 9241- 210.2010: understanding the context of use, specifying requirements, solution design, and evaluation. This paper describes the three first UCD activities for designing the web visual editor user interface. Activity 4, Evaluation of design solutions, is not presented in this paper and is considered for future work.
Activity 1: Understanding and specifying the Context of Use.- This activity starts by understanding the constructs involved in the cloud infrastructure modeling domain, the potential users of the web visual editor, and the environment in which the editor will be used. The information available in books and official websites of infrastructure providers will be useful to achieve this activity.
Activity 2: Requirements specification.- This activity consists of defining the goals pursued by users when modeling the infrastructure and the tasks users perform to achieve their goals.
Activity 3: Production of design solutions.- This activity is creative in deep and involves translating the goals and tasks identified in Activity 2 into a user interface design prototype. This UI prototype is known as a design solution since it is a design that solves the user interaction needs (i.e., the tasks the user wants to perform to achieve the goals). This activity is supported by design principles and good practices such as using UI design patterns which help designers not to reinvent the wheel.
Task Analysis and using UI Design Patterns are two UCD techniques we apply to design the web visual editor. Task Analysis is applied to Activity 2, whereas Design Patterns is applied in Activity 3.
Based on UCD, the proposed web visual editor design considers visual and interactive aspects that allow the user to model the infrastructure. The visual editor allows users to define the infrastructure elements and their relationships while reducing the cognitive load of remembering specific commands or codes.
The remainder of this paper is structured as follows: Section 2 highlights some related works involved in the complex domain of provisioning infrastructure modeling. Section 3 presents the design process of the web visual editor considering the two UCD techniques (i.e., task analysis and UI design patterns). Section 4 describes the conclusions and future work in the line of the work.
RELATED WORKS
This section describes the user interfaces of existing relevant tools for modeling infrastructure. We focus on user interfaces based on Web and standalone since they represent user-machine interactions relevant to our purpose.
CloudFormation Designer is a web user interface that simplifies the creation of infrastructure templates in the Amazon Web Services (AWS) ecosystem (AWS, 2022a). The user interface implements the “drag and drop” mechanism, making it easy for the user to model the infrastructure. The user selects the infrastructure elements to include in the model, drags them onto the diagram, and connects them to establish relationships. From the graphical model, it is possible to automatically generate a template script in declarative languages, such as JSON or YAML, that contains the AWS infrastructure resources the IT technician has graphically created or configured. Although this designer is considered a reference in the user interfaces of this domain, it is limited to being used in the AWS ecosystem. Moreover, though JSON is a lightweight format and readable for machines, it is hard to understand at the business level.
Ca 3Tera AppLogic is a platform aimed at MSP (Managed Service Provider). An MSP is a company that provides and manages IT services, including cloud services (IONOS, 2021). The AppLogic editor is a web user interface that implements the “drag and drop” mechanism that allows technicians to build a cloud infrastructure in a graphical and easy-to-view way. The user interface contains two main areas: i) a component catalog panel located on the left side of the editor where components are grouped by their type (e.g., Web Servers, Databases, Filters, etc.) and ii) a canvas that covers most of the user interface area and where the infrastructure diagram is created. From the component catalog panel, components are dragged onto the diagram, and each component on the diagram allows the user to draw a connector to another component. Configuring each component is possible through a contextual menu that presents, in another browser window, a form with editable properties of the component.
ARGON is an Eclipse Modeling Framework-based standalone tool for modeling infrastructure in the cloud (Sandobalin et al., 2019). Its main purpose is to abstract the complexity of learning specific commands of each provider. To do that, ARGON consists of i) an underlying DSL (Domain Specific Language) that provides the commands and syntax necessary to define the infrastructure through code, and ii) a visual editor, the ARGON user interface, which is built on Eugenia (Kolovos et al., 2015) (Graphical Modeling Framework), and which main purpose is to reduce the user’s cognitive load related to learning the DSL commands and syntax. Although the visual editor represents a mechanism to facilitate the use of DSL, the authors describe several drawbacks related to the editor:
Problems in the maintenance of the visual editor developed in Eugenia and Eclipse
Limited use of ARGON due to the user interface running locally rather than on the web
The interaction with the visual editor is limited to the interactions provided by Eclipse
EDITOR USER INTERFACE DESIGN
In this section, we describe how the three UCD activities (i.e., context of use, requirements specification, and design of solution) have been applied to design the visual editor user interface for infrastructure modeling.
Context of Use
Understanding the context of use involves two main actions: i) understanding the conditions under which the editor will be used, and ii) understanding the concepts (constructs) involved in the domain.
Regarding the first action, we have identified three relevant conditions related to the use of the editor:
Web access.- A concern described in the related works section is the ”limitation of use” of existing editors that work locally (i.e., the editor is installed on the user’s computer). In this sense, an imminent need is to access the editor through the web, extending the use of the editor to a large number of users. In addition, users do not want to deal with installation and configuration difficulties, which do not happen on the web platform.
Familiarity with the use of visual tools.- Users of this domain are familiar with graphical tools for software modeling. These tools allow users to create a variety of diagrams, from concept maps to complex diagrams in UML (Unified Modeling Language). The benefit of creating diagrams is to provide a graphical model to better understand the complexity of a domain. The model provides an organized visualization of the elements of the domain and their relationships.
Direct manipulation as interaction style.- The UIs of these tools are characterized by implementing direct manipulation as an interaction style to facilitate the modeling task. The user can quickly “drag and drop” elements to the model and establish the relationships between them, generating an easy-to- understand schema; something very complex to achieve with interaction styles such as CLI or forms.
Concerning the second action, we have analyzed the existing literature published on the official websites of infrastructure providers to define the concepts involved in the domain. We found that every provider uses different commands to explain how to configure infrastructure resources within their infrastructure environment. For instance, a server in the cloud is defined as an EC2 instance in AWS, whereas the same server is defined as virtual machine in Microsoft Azure (Wickham, 2018).
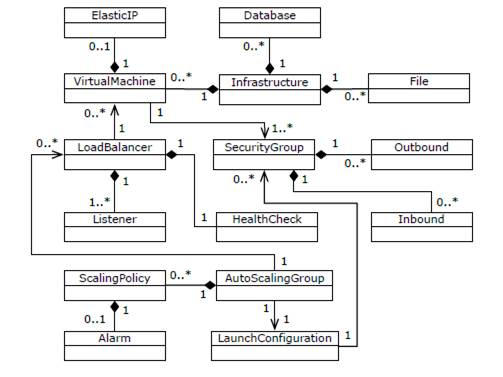
To avoid this terminology difference, we considered a previous work (Sandobalin, 2017) where an infrastructure metamodel is presented to generalize the terminology. This metamodel (Figure 1) defines the main concepts or constructs involved in the infrastructure provisioning domain.
It is important to note that the metamodel represents a static view of the domain. That is, the metamodel shows the concepts involved in the infrastructure and how they are related, but not how to use them. In the next section, we supplement the metamodel static view with “task models” that dynamically define “how” users use the concepts defined in the metamodel. In this sense, the visual editor conditions and domain concepts presented in this section become relevant information for the next UCD activity: requirements specification.
Requirements specification
User requirements describe what the users want to do with the visual editor. It is to say, the tasks the user needs to perform for modeling and provisioning the infrastructure by using cloud virtualized resources from infrastructure providers. This section focuses on defining the tasks users perform when provisioning infrastructure in the cloud. To do that, we use a UCD technique: “task models”.
A task model is a design artifact in the Human-Computer Interaction (HCI) field commonly used to understand how activities should be performed to obtain usable user interfaces. A task model helps understand the complexity of a domain by specifying and representing the logical tasks and their relationships a usable system supports or must support (Paternò, 2003). Indeed, task models are widely used in several stages of a system. For an existing system, task models help understand how the application works with the advantage of improving the current interaction with the system. For a proposed system, task models help to understand the domain before developing the application. Moreover, task models support effective design and usability evaluation. Task models become a dynamic view of the domain since they describe the tasks and how they are performed.
Our purpose is to use task models to specify the tasks that are currently performed when IT technicians model the cloud infrastructure provisioning by using the services from cloud providers. Task models in our domain include tasks and their temporal relationships, and they express how to use the infrastructure elements defined in the metamodel in Figure 1.
To define the task model, we will use ConcurTaskTree (CTT) notation introduced by Paternò (2003). There are several approaches to represent task models such as hierarchical task analysis (HTA), GOMS, user action notation (UAN), etc. However, we use CTT notation because it provides a systematic and structured method to describe with a graphical syntax not only the tasks in a hierarchical structure but also represent the relationships between tasks through temporal operators. For instance, the concurrency operator can be used to specify that two tasks (A and B) can be simultaneously performed, or the enabling operator can be used to specify that task B cannot begin until task A has been completed. By using CTT, several potential advantages can be highlighted: i) the models are at a level of abstraction familiar to user interface designers/developers, ii) testing will follow the anticipated use of the system, and iii) the cost incurred in developing is much reduced.
To define the tasks involved in infrastructure provisioning, we studied the existing literature available on the official websites of infrastructure providers. From this study, we define a generic task model shown in Figure 2. This model describes the tasks related to i) how the user defines the physical location of the data centers that contain the infrastructure elements (e.g., servers, routers, networks, subnets, etc.) and ii) how these elements are included in the infrastructure model. Considering the CTT notation, most of these tasks are “abstract tasks” (those represented with the “cloud” icon), however, they are detailed in Figure 3.
In Figure 2, the “Select Region” interaction task means that the IT technician defines the geographical area where the resources or services that will be used to model the infrastructure are located. Defining the geographic area implies defining the region and the availability zones where the resources are located. A region is a defined geographic area around the world where a provider’s data centers are physically located. Within a region, resources are located in isolated physical zones, called availability zones. The delimitation and isolation of regions and availability zones improve the efficiency in managing the availability of resources and guarantee the infrastructure resiliency (i.e., in the face of any disruption, the infrastructure services will continue to operate) (Firesmith, 2019). Each provider has multiple regions and availability zones, and the user must select in which of them to work. For instance, for Amazon EC2 and Microsoft Azure, regions and availability zones are shown in AWS (2022b) and Microsoft (2023), respectively.
The “Configure Net” task involves the following tasks:
“Create VPC”.- Define a Cloud Private Network (VPC) within the provider’s global network. Details of this task are shown in Figure 3-a
“Create Subnet”.- Define subnets within the VPC. The asterisk (*) in the task means repeatability, it is to say, the possibility of creating one or more subnets within the VPC. Creating subnets prevents resources from being dispersed throughout the provider’s network and being exposed to modifications by other users. Details of this task are shown in Figure3-b.
“Configure NACL”.- Define a list of access control to the network. The brackets “[]” around the task label mean that this is an optional task.
The “Create Instance” task consists of locating the virtual machines within the subnets. Virtual machines can be connected to other virtual resources, as represented in the metamodel in Figure 1. For example, a virtual machine can be connected to a load balancer or attached to a security group. Since several virtual machines can be created, this task is a repetitive task. It is to say, the user will perform this task for each resource that wants to include in the infrastructure model. Details of this task are shown in Figure 3-c. The task models presented in this section represent the general interactions that IT technicians perform when modeling the infrastructure. This is why these models become an important input for designers and developers who are challenged in designing and implementing envisioned user interfaces in the infrastructure provisioning domain. For our purpose, the task models become the entry point for designing the solution: the user interface prototype for the infrastructure modeling visual editor.

Design of solution
This section explains how the user requirements expressed in tasks are translated into a tangible user interface (UI). To design the UI, we defined and used UI design patterns; a UCD technique considered as a design best practice and a useful for UI design (MacDonald, 2019). Furthermore, by considering the relationships between the patterns, we defined a Pattern language as a suitable tool to design the web visual editor.
Patterns
The pattern concept was born in the architecture field to describe proven design solutions for recurring problems related to the building of buildings, houses, roads, etc (Weigold et al., 2020).
Since the concept was born in the architecture area, the concept has been adopted in several areas such as Software Engineering (Weigold et al., 2020) and Human-Computer Interaction (HCI) (Seffah, 2015), and adapted to the specifics of each area, but without losing its essence. In the area of User Interface Design (a subfield of HCI), the pattern also known as UI Design Patterns are defined as reusable/recurring components which designers use to solve common problems in user interface design (MacDonald, 2019).
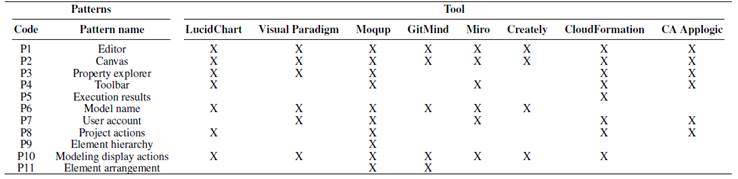
According to this definition and to gather ideas about how to design the visual editor, we studied the UIs of eight web tools for modeling or drawing software diagrams: Lucid Chart , Visual Paradigm , Moqup , GitMind , Miro , Creately , CloudFormation Designer , CA Applogic .
Though the list of tools could be too long, we selected them because i) they are commonly used in the software development community and ii) their user interfaces are web editors that allow users to model software engineering artifacts (e.g., the architecture or infrastructure of a software application); something similar to what we pursue with our web editor.
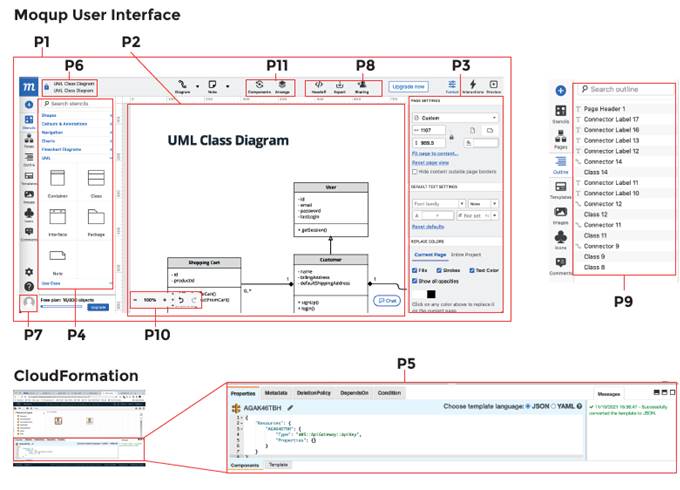
The main purpose of this study was to identify user interface design patterns. That is, identify UI design solutions that expert designers have reused over and over again to solve interaction problems in the software modeling domain. As a result of this study, we identified eleven patterns as shown in Table 1 where “X” indicates in which tool the pattern was identified. Figure 4 shows an example of the pattern identification task performed on user interfaces of Moqup and CloudFormation tools.
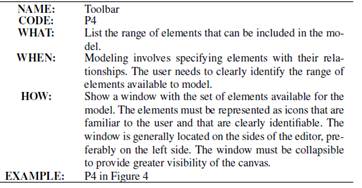
Once the patterns were identified, we documented them. There are several templates for documenting patterns, each tailored to the documentation needs of each domain. To document the identified patterns, we have adapted the Tidwell template (Tidwell, 2010) by defining four parts: WHAT (what the pattern solves, i.e. the problem it solves), WHEN (when the pattern is used or should be used), HOW (how the pattern can be implemented), EXAMPLE (one or more UI images showing how the pattern has been implemented). For instance, Table 3 shows the definition of Toolbar Pattern (P4) based on the four-part template. The rest of the patterns are described in Appendix A, in the same style as the Toolbar pattern.
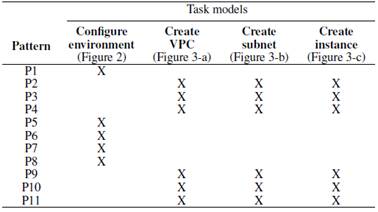
Although, the defined patterns describe general solutions to interaction problems in the modeling software domain, these patterns can be perfectly adapted to solve interaction problems in the infrastructure provisioning domain. Indeed, the idea is to relate the defined patterns so far with the interactions defined in task models (see Section 3.2). For instance, Canvas (P2), Property explorer (P3), and ToolBar (P4) patterns are related to the interactions defined in Create VPC task model (see Figure 3-a) since: from the toolbar (P4), the user can select an element that represents a VPC, drag and drop it onto the canvas (P2), and then define the VPC properties (P3) . In this sense, Table 2 shows the relationships between patterns and task models. The “X” in the table must be read as “The pattern P is related to the interactions of the task model M”.
A Pattern Language
Patterns are not isolated entities, but rather there are relationships between them. For instance, considering the HOW part of the description template of Toolbar pattern (P4) (Table 3): “ The window is generally located on the sides (right of left) of the editor, preferably on the left side. The window must be collapsible to provide greater visibility of the canvas. ”, we identified that Toolbar pattern (P4) is related to two patterns: Editor Pattern (P1) and Canvas pattern (P2).
The set of patterns and their relationships is commonly named by HCI community as Pattern Language (Van Welie and Van der Veer, 2003). Indeed, Van Welie and Van der Veer (2003) establish three main relationships between patterns:
Specialization.- Some patterns are specializations of other patterns. It is to say, a Pattern B inherits the basic idea of a Pattern A.
Association.- A pattern can be related to other patterns because they occur in a same context of the design.
Aggregation.- A pattern aggregates several other patterns.
Considering these relationships, Pattern language in Figure 5 resumes the relationships between the patterns defined in this paper. For instance, Toolbar pattern has i) an aggregation relationship with Editor pattern since Editor contains or aggregates the toolbar ii) an association relationship with Canvas pattern since they occur in the same context of the design: the elements located in Canvas are provided by Toolbar pattern.
The Pattern language becomes a point of reference for designing the web editor UI since we design the UI by considering the patterns and their relationships.
Editor
The UI design of the web visual editor, which we have called “Infrastructure Modeler”, is composed of 5 areas (A1, A2, A3, and A4, A5) which are delimited with dashed lines in Figure 6. Each area implements patterns and each pattern is indicated by its pattern code.
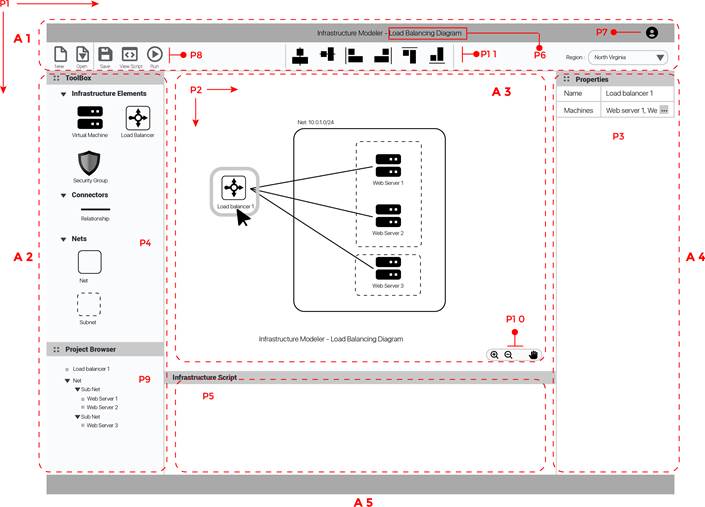
For example, area 3 contains patterns P2 and P10. Area 1 .- This area contains the project general information and operations related to the model. This area implements the P6, P7, P8, and P11 patterns:
The Project actions pattern (P8) is applied in this area to show the model managing and execution tools. Model managing tools allow to create a new infrastructure model (New button) or open an existing one (Open button). Modeling execution tools allow to save changes to the current model (Save button), transform the visual model into a code script (View Script button), and run the script on a specific infrastructure provider (Run button).
The Elements arrangement pattern (P11) was applied to help users organize the elements in the canvas. The user first selects two or more elements on the canvas and then applies one of six available options to align or arrange the elements.
The Model name (P6) and User account (P7) patterns were applied to display the name of the project model and the registered user, respectively.
In addition, in this area, we have located a selectable list on the right side of the area to allow the user to establish the provider region from which the infrastructure resources will be used.
Area 2 .- This area, located on the left side of the editor, implements the P4 and P9 patterns.
The Toolbar pattern (P4) was applied to create the toolbox section which contains the set of icons representing both the infrastructure elements and the connectors to establish relationships between the elements. The user can easily drag and drop the icons on the canvas.
The Element Hierarchy pattern (P9) is applied to display the Project Browser section which displays the infrastructure elements drawn on the canvas, arranged in a hierarchical structure where the user can easily infer which element contains another.
Moreover, the design of this area is intended to be flexible in case of increasing the number of options, this is why the Accordion design pattern has been applied to every section of this area (Tidwell, 2010). Accordion pattern is recommended to use when there is a lot of heterogeneous content that must fit into a small space in the user interface. Indeed, the design solution proposed by this pattern is placing content modules in a collinear stack of panels that can be opened or closed in an independent way. By applying this solution to the editor, all infrastructure elements can be organized into different categories (panels) that can be independently opened o closed in accordance with the user’s need.
Area 3 .- This area represents the canvas where the user will model the infrastructure by using infrastructure elements and connectors from toolbox in Area 2. This area implements the P2 and P10 patterns.
The Canvas pattern (P2) is applied to allow users to drag infrastructure elements available in the toolbox (in Area 2) and drop them on the canvas. Once the elements are in the canvas, they can be connected by using connectors from the Connectors category (in Area 2). The canvas behaves like a large workspace whose dimensions (width and height) dynamically grow to embrace all elements drawn on it.
The Modeling display actions pattern (P10) is applied to improve the navigation and visualization of the canvas. Users can navigate through the entire workspace and visualize the infrastructure diagram elements in detail.
Area 4 .- This area defines a form containing the fields related to the properties of the selected element in the canvas. Property explorer pattern (P3) was applied in this area. Each element has its properties and the form adjusts to the number of properties of each element.
Area 5 .- This area displays the infrastructure code resulting from running the infrastructure model in Area 3. Excution results pattern (P5) was implemented in this area. The code is produced once the user has pressed the “View Script” or the “Run” buttons located in Area 1. JSON or YAML are formats in which code can be presented considering that these formats are commonly used to specify infrastructure.
CONCLUSIONS
This article describes the design of a visual editor as a generic web user interface for modeling and provisioning cloud IT infrastructure. The visual editor design is intended to provide an interactive graphical environment to reduce the complexity of defining infrastructure elements through code.
The design of the user interface is guided by the User Centered Design methodology, using two techniques under the umbrella of this methodology: Task Analysis and User Interface Design Patterns. The former was applied to create task models that represent the interactions users perform when modeling/provisioning the infrastructure, and the latter to compose the UI design.
Based on the task models, expressed in the ConcurTaskTree (CTT) notation, the user interfaces of online tools oriented towards creating software/hardware and infrastructure diagrams were studied. The purpose of this study was to identify the designs used by expert designers to accomplish the tasks. This study was necessary since no defined user interface design patterns were found for the design of graphical editors. Indeed, a contribution of this article is to define a set of patterns intended to design visual editor user interfaces. Furthermore, a pattern language was built considering the relationships between the defined patterns. These relationships provide a logical way how to compose a user interface using patterns. Finally, the patterns and their relationships were used to compose the layout of the visual editor’s user interface.
The proposed design together with the task models and the defined design patterns become reference points for designing user interfaces in this domain. In future work, it is proposed to evaluate the designed user interface through tests with users. User feedback will help refine the design. Refined design can be implemented with standard web technologies (HTML, JavaScript, CSS)