


 Español (pdf)
 Articulo en XML
 Referencias del artículo
 Enviar articulo por email
 Citado por SciELO
  Similares en
SciELO
Similares en
SciELO 
 Permalink
INTRODUCTION
At a global level, in all regions, the increase in extreme heat events has led to human mortality and morbidity. These phenomena have been caused by the expansion of urban areas, the rise in extreme temperatures, and demographic transformations [1]. It is estimated that the ambient temperature will increase by an average of 1.5°C over the next 20 years [2], which represents an increase in energy demand to achieve comfort conditions in the buildings.
Ecuador is one of the countries geographically located in the tropical zone. This geographical zone is clearly defined as the region located between the tropic of Cancer and the tropic of Capricorn. A small annual temperature range is characteristic of the tropics. Near the equator, the difference in average temperature between the warmest and coldest months rarely exceeds 4°C, and in some places, it is less than 1°C. Annual temperature ranges increase as one moves away from the equator, even at the boundaries of the tropical zone; few locations have an annual range greater than 15°C [3]. The world experienced a net temperature increase between 1961 and 2018 of nearly 1°C from the baseline. During this period, the average warming in the tropics was 0.7°C, as was the case in South America [4].
This zone is characterized by high temperatures and high levels of humidity, which are likely to increase with climate change [5]. Based on current policies, the installed capacity of cooling equipment globally is projected to triple between now and 2050, leading to more than a doubling of electricity consumption [2]. It is crucial to consider that the refrigerants used in cooling systems can vary, including CFCs, HCFCs, HFCs, among others. HFCs, like their predecessors, CFCs and HCFCs, are predominantly used as refrigerants in air conditioning and refrigeration equipment. These substances are potent greenhouse gases. Although HFCs currently account for around 1% of total global Greenhouse Gases emissions, their global warming potential can be hundreds to thousands of times greater than that of CO2 per unit mass. During the operation, maintenance and disposal activities of equipment using these types of refrigerants, leaks are common, directly contributing to atmospheric warming [6]. In this sense, there is a need to consider energy efficiency strategies to decrease the energy consumption of the active cooling systems without compromising the thermal comfort of the occupants.
Pickering E, et al [7], analyzed six commercial buildings and identifies various building characteristics, including the potential for savings of over 700 MWh valued from building rescheduling alone, it is shown that there is an apparent spike in usage at approximately 6h00, indicating a scheduled Heating, Ventilation, and Air Conditioning (HVAC) event (i.e. pre-cooling) by the building management system, followed by a sharp decrease, showing the tendency for the HVAC units to overshoot demand and drop in usage. The analysis shows that the addition of unoccupied set point states would drastically alter the consumption and save significant amounts of energy in nighttime/baseload and weekend operation. This demonstrated the potential impact of no-cost energy efficiency measures on the energy consumption of buildings with specific activities.
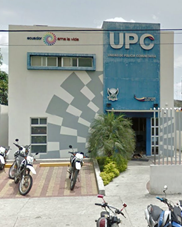
This research aims to study, identify and estimating strategies to reduce energy consumption in buildings known as Community Police Units (UPCs) located in the city of Guayaquil, which corresponds to a very hot and humid climate zone. Each UPC has jurisdiction to deploy police services in a 1 km2 radius area. Currently, Guayaquil has 104 UPCs; however, the data were collected from 43 UPCs built in the last four years. They have similar infrastructure, as well as the same materiality.
The difference is that some have more glass coverage, and the area varies according to the services. Therefore, they were classified as type A and B. The objective of this research is to establish a baseline on the energy performance of these buildings and identify the parameters that affect the thermal behavior and energy consumption of the UPC.
METHODOLOGY
The research is developed under the four-stage approach:
a) Selection and characterization of the sample analyzed,
b) Characterization of energy consumption and analysis of the influence of environmental temperature on energy consumption
c) Energy simulation.
d) Energy monitoring and identification of savings opportunities
Selection and characterization of the sample
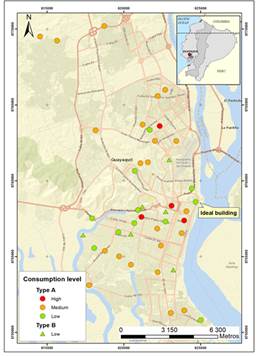
For the study, were selected 43 security buildings built in Guayaquil city in 2014. The selected sample is located randomly over the city as shown in Fig. 1. The city is located in a very hot humid climate zone, considered as an extreme climate zone in Ecuador [8]. According to the Köppen-Gaiger climate classification, Guayaquil belongs to the Aw group (tropical savannah climate) [9]. In addition, it has influence of marine currents from the Pacific Ocean. It is located at 25 m.a.s.l. with an average temperature of 26 ° C.
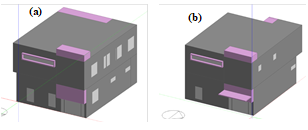
UPCs have similar characteristics. They present a standardized design in their structure and materials. Although, its difference is that some have a higher percentage of glass and the area differs according to the services. Therefore, they were classified as type A and B (see Fig. 2 Fig. 3). Typology A has a construction area of 225 m2 and typology B of 200 m2. Fig. 4 shows the architectural simulated model of the buildings that was provided by the Works Contracting Service of Ecuador (SECOB, n.d.).

Characterization of energy consumption and analysis of the influence of environmental temperature
The database monthly electricity consumption that was used corresponds to the years 2016 and 2017, was provided by the Regulatory Agency for the Control of Energy and Non-Renewable Natural Resources (ARCERNNR for its acronym in Spanish).
The energy use intensity EUI was defined from this information. It is defined as the ratio between the annual energy consumed and the total construction area [10] as shown in (1):
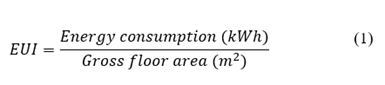
The EUI is considered an indicator of energy use that allows buildings to be compared. The characterization of energy consumption in buildings is done through a frequency distribution analysis of the EUI of the total sample.
Considering that the energy consumption of the air conditioning systems is highly influenced by the environmental temperature [11]. It is necessary to know the correlation that exists between these factors (consumption and environmental temperature), in order to define whether the greatest amount of energy consumed is due to a base load independent of temperature (energy related to lighting, office equipment, etc.) or if there is a high degree of influence of environmental temperature on the energy consumption of the building. This analysis allows knowing the energy consumption of the building depending on seasonal changes [11].
To identify the influence of environmental temperature on energy consumption, the two variables were correlated, finding increasing relationships with a pronounced inclination. The relationship between ambient temperature and energy consumption was defined by a linear regression model finding a coefficient of determination (R2) [12] between 0.4 and 0.7. The Environmental Protection Agency (EPA) states that the minimum R2 is 0.4 for simple adjustment ratios and 0.7 for more complex relationships [13]. This analysis allows identifying in a general way the type of energy efficiency measures that can be applied to reduce consumption.
Energy simulation
The simulation allows analyzing and determining the thermal behavior of the building under real environmental conditions, in order to estimate the electrical consumption. To carry out the simulation, the design builder software was used and the following was considered:
Building design and use: The building is divided into two floors with independent income. On the ground floor of the building are: complaint reception area, office, two bathrooms, warehouse, rack, meeting room, dining room, laundry, rake and domestic gas room. On the first floor there are: bedrooms for men and women (only the women's room has a private bathroom), common bathroom (with showers) and common area.
Building materials: 150 mm concrete block walls with internal and external stucco and paint coating, 200 mm concrete slab roof, 6 mm single glass windows and metal exterior doors with the exception of the main glass entrance. Thermal properties of the envelope elements are shown in Table 1.
The weather data for the 2016-2017 period of Guayaquil city were imported in the format (.epw) Energy Plus which is compatible with Design Builder. Table 2. shows the considerations of occupation of the building. The simulation was calibrated in order to approximate the model to the real energy consumption and the conditions of user behavior [14].
Energy monitoring
To accurately capture data on real electricity consumption, a comprehensive monitoring system was installed at the primary distribution panel of the UPC, as depicted in Fig. 5. The system comprises JANITZA current transformers, specifically model IPA40.5, coupled with a JANITZA energy meter, model UMG 103-CBM, and a DEXMA datalogger, model DXHW-DEXGATE.
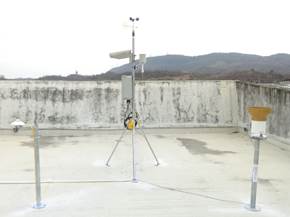
Furthermore, ambient temperature measurements were conducted utilizing a weather station situated within the socio-housing development 1 in Guayaquil, as illustrated in Fig. 6. The employed sensor is a VAISALA model HMP155, meticulously equipped with a solar radiation shield for optimal precision.
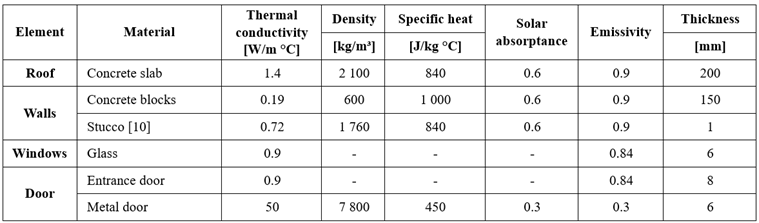
Table 2: Building occupation
| *Activity | Occupation (people / m 2 ) | ****Environmental control | Computers and office equipment | Openings | Lighting | |
|---|---|---|---|---|---|---|
| Ground floor | Reception room and hall | 0.04 (24x7 office) | Natural ventilation and Cooling with setpoint: 25 °C | Activate | Sgl Clr 6 mm without shutter | 24x7 Office ligth |
| Office | Temperature setpoint cooling:25°C | Activate | Sgl Clr 6 mm with shutter | |||
| Toilets | Mechanic ventilation | N/A | ||||
| Dinning room | Natural ventilation | N/A | ||||
| Rack | Temperature setpoint cooling: 25°C | Activate | ||||
| Meeting room | Natural ventilation | Activate | ||||
| Laundry | N/A | N/A | ||||
| Gas room | N/A | N/A | ||||
| First floor | Bathrooms | 0.0229 **(UPC Bedroom) | Mechanical and natural ventilation | N/A | Sgl Clr 6 mm with shutter | Dwell Dom Bed Ligth |
| Bedrooms | ***Temperature setpoint cooling:26°C | |||||
| Living room | N/A | Sgl Clr 6 mm without shutter | ||||
| * 34 holidays have been considered in Ecuador., | ||||||
| ** A template was created to consider a night-time occupation only. | ||||||
| ***This parameter is considered for bedrooms conditioned only at night. | ||||||
| **** It is considered as air conditioning equipment type split no fresh air | ||||||

Identification of savings opportunities
From the findings presented in the preceding sections, passive strategies were discerned for reduce electricity consumption, and the associated savings were estimated. To do this, an electricity rate of 0.072USD/kWh for community service buildings low voltage [17] and an emission factor for electricity use of 0.092tCO2/MWh [18] were chosen.
DISCUSSION AND RESULT ANALYSIS
Characterization of energy consumption and analysis of the influence of environmental temperature
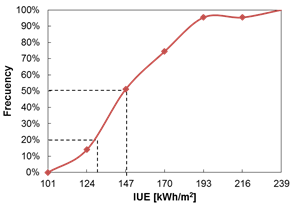
Fig. 7 shows the characterization of energy consumption of the two typologies which was calculated using (1). It was found that the average EUI in 2016 for buildings with typologies A and B are 155 kWh / m2 and 129 kWh / m2 respectively, while the average EUI of the group is 145 kWh / m2. In addition, approximately 30% of the buildings analyzed have a EUI between 124 and 147 kWh / m2, expected results according to the methodology defined by [10]. The average values indicate that type A consumes more energy than type B, because type A buildings have a higher percentage of glazing.
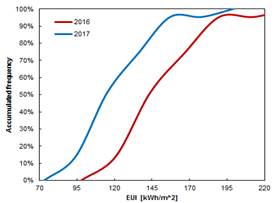
On the other hand, the analysis of the EUI, based on the real consumption of electrical energy in buildings, determined that consumption decreases in 2017 with respect to 2016, as is shown in Fig. 8, because of the environmental temperatures in 2017 were lower than the year 2016. In addition, if there is no change in the type of use of the buildings, it is established that the environmental temperature influences the behavior and energy consumption.
According to Fig. 8, it is defined that buildings that present EUI greater than 157 kWh / m2, in meteorological conditions similar to 2017, are categorized as large energy consumers. Then, the groups of high and medium consumption are the buildings type A and the buildings type B have an architectural design which decreases the energy use. The main architectural differences are that Type A has a greater amount of glazing and also has 25m2 more construction. On the other hand, Type B has a cover at the entrance door.
Energy simulation
For this research, a building type A was selected, which was simulated to get its energy behavior. In addition, it has an altitude of 9 m.a.s.l. which is the average altitude of the sample. Although, there is no relationship between the location of each building and the level of consumption. On the other hand, it is observed that the environmental temperature influences the energy consumption of all buildings for the 2016 and 2017 periods.
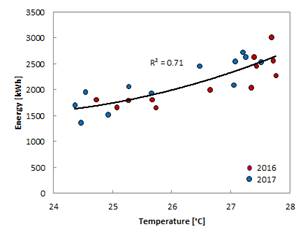
In Fig. 9 is observed that there is a growing relationship between electricity consumption and environmental temperature. The adjustment curve obtained shows that the energy consumed by the building presents a greater influence of the temperature from 26°C with an approximate consumption of 2 000 kWh.
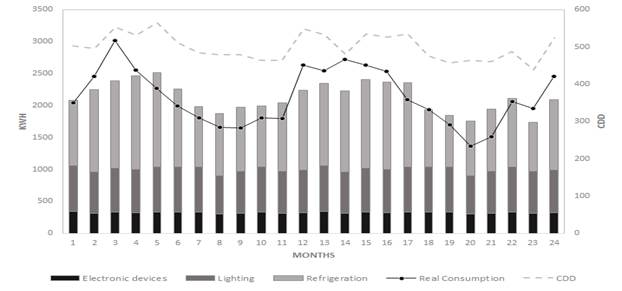
Subsequently, to validate the results obtained in Fig. 9. The energetic simulation of the ideal building was carried out with the previously established parameters. Fig. 10 shows the real energy consumption, simulated consumption and average environmental temperature for each month of 2016 and 2017. In addition, the behavior of cooling degree days (CDD) [15] is included to indicate the climatic conditions of the place. As a result, for the period established, it was obtained that the real and simulated energy behaviors are influenced by the required cooling loads as a consequence of the environmental temperature. In addition, a pattern of consumption is observed every six months which is repeated in the two years. Where the first semester of the year presents higher consumption than the second as shown in Fig. 10.
It is expected that the CDD have a behavior similar to real and simulated consumption as well as the month of November 2017, where the three factors decrease at the same time. The differences between real and simulated consumption are due to the behavior and operation of the building itself as its operation and occupation, which vary during the year according to the dynamics of the city and climate variability. In the simulation, the occupation was constant depending on the employees who provide the public service. Finally, Fig. 10 shows that the basic consumption of buildings, consisting of the lighting system and electronic equipment, has a constant value over 1’000 kWh. The simulated average base consumption corresponds to 46% of the total consumption, while for the air conditioning system it is 54% noticing that the energy consumption is related by the climatic conditions.
It is expected that the CDD have a behavior similar to real and simulated consumption as well as the month of November 2017, where the three factors decrease at the same time. The differences between real and simulated consumption are due to the behavior and operation of the building itself as its operation and occupation, which vary during the year according to the dynamics of the city and climate variability. In the simulation, the occupation was constant depending on the employees who provide the public service. Finally, Fig. 10 shows that the basic consumption of buildings, consisting of the lighting system and electronic equipment, has a constant value over 1’000 kWh. The simulated average base consumption corresponds to 46% of the total consumption, while for the air conditioning system it is 54% noticing that the energy consumption is related by the climatic conditions.
Energy monitoring
To validate the energy simulation, real energy consumption data of a UPC was collected for April and May, each 15 minutes. The energy consumption of the air conditioning systems accounted for 57.4% of the total building consumption. The remaining 42.6% corresponds to equipment with energy requirements independent of external climatic conditions, such as servers, lighting, printers, and other devices. These values exhibit an error of less than 5% compared to the results obtained from the energy simulation.
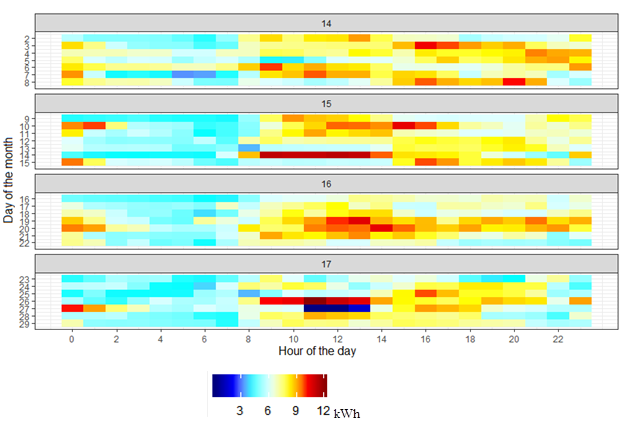
Using heat maps, the monitored monthly consumption patterns of the UPC were identified as shown in Fig. 11. Cool colors (shades of blue or light blue) indicate low-value ranges, while warm colors (shades of yellow or red) indicate high values within a given scale. It is observed that consumption does not depend on the day of the week but rather on the occupancy schedule.
The typical consumption schedule during a workweek is from 9h00 to 10h00, with elevated consumption observed. The periods of highest consumption are approximately from 12h00 to 18h00. Due to the activities carried out in the UPC, the building is occupied by staff 24 hours a day, 7 days a week. For this reason, it is not possible to define a specific start or end time for the workday. However, it is observed that from 22h00 to 8h00, most equipment, including the air conditioning, is turned off.
Identification of savings opportunities
Strategy 1
As shown in Fig. 11, the activation and deactivation of the air conditioning system are not automatic. The system is fully activated between 8h00 and 22h00, with 9h00 being the most frequent activation time. The system is deactivated between 21h00 and 12h00, and in some cases at 2h00. The building does not exhibit any difference in energy consumption on weekends compared to weekdays. However, from 22h00 until 9h00, it shows a similar hourly energy usage pattern during the week, amounting to 4.5 kWh
In this regard, an energy-saving strategy is proposed, which involves gradually activating the air conditioning system starting at 9h00 and deactivating it at 20h00. These two events must be carried out with the exterior doors completely closed to control internal thermal load.
When applying the described strategies, a minimum estimated monthly savings of approximately 9% is anticipated, equivalent to 10 322 kWh per year, 3.8 metric tons of CO2 emissions [18] and 743 USD considering the current rate [17].
Strategy 2
The electrical consumption of the air conditioning system is highly influenced by external environmental conditions. This allows for the determination of potential savings through the adjustment of the minimum operating temperature of the air conditioning system.
The analysis of Cooling Degree Days (CDD) showed that 22°C is the minimum activation temperature for the air conditioning system. By increasing the control temperature to 23°C, an approximate electricity saving of 16.83% of the system's consumption is expected, amounting to 478 kWh per month, 413 USD per year considering the current rate [17], and 1.4 metric tons of CO2 emissions [18].
In Table 3, the percentage increase or decrease in monthly consumption of the air conditioning system is presented when reprogramming the system's operating temperature. The values presented were determined based on the consumption data for April and May and may vary in different seasons with different climate control requirements.
Table 3: Energy savings percentages based on changes in the on-off configuration
| °C | T20 | T21 | T22 | T23 | T24 |
| T20 | 0.00% | -9.13% | -14.05% | -27.92% | -40.97% |
| T21 | 11.97% | 0.00% | -14.05% | -21.21% | -35.94% |
| T22 | 23.92% | 14.05% | 0.00% | -16.83% | -32.65% |
| T23 | 35.71% | 27.92% | 16.83% | 0.00% | -20.04% |
| T24 | 46.81% | 40.97% | 32.65% | 20.04% | 0.00% |
Table 4 shows the forecasted savings for both strategies.
CONCLUSIONS
The selected sample consists of two types of buildings A and B, which differ by the construction area and the amount of glazing. The statistical analysis shows that the energy consumption of buildings is influenced by temperature. It has been determined that the year 2016 had a higher temperature than 2017. Furthermore, the analysis of degree days of refrigeration confirms that Guayaquil city belongs to the very hot humid zone.
Within 43 buildings, 4 buildings form the group of high consumption during the two years, which corresponds to 13% of total energy consumption of the sample. If the 4 buildings had the energetic behavior of building type A, an approximate saving of 2 000 USD per building would be obtained. With this value it is possible to pay 90% of annual electric service of the monitored building.
The analyses on the UPC type A shows that the variables considered in the simulation (envelope, activity, use, equipment, etc.) are adapted to the real energy behavior. When UPC uses electrical energy only for base loads, electricity consumption is not influenced by weather conditions.
Real information was collected on the disaggregated energy consumption of a UPC to understand its energy behavior and in this way identify savings opportunities and optimize energy use in similar buildings in the same climatic zone.
Reducing the control temperature of the cooling system by 1°C has the potential to yield annual savings of 413 USD. Additionally, optimizing and automating the activation and deactivation of the cooling system can lead to savings of 743 USD per year

