INTRODUCTION
Renewable energies are all types of energy that can be produced continuously and are inexhaustible on a human scale, i.e., they are replenished at a higher rate than they are consumed, unlike fossil fuels that exist in a limited quantity and are exhaustible in a determined period [1]. The main forms of renewable energies that exist are biomass, wind, hydro, solar, geothermal, and marine energies, which come directly or indirectly from the sun's energy, except for marine and geothermal energies [2]. Nowadays, the use of renewable energies haves been boosted to contribute to the care and preservation of the environment. The climate change caused by the expulsion of CO2 into the atmosphere by industries, vehicles, burning of fossil fuels, etc., has led to the development of technology in different regions of the world to obtain energy (electric or thermal). This has led to the development of technology in different regions of the world to obtain energy (electrical or thermal) from renewable sources such as the sun.
The use of photovoltaic energy has spread in recent years to different regions of the planet and Ecuador is no exception, since it is a country with very varied topographic features, great climatic diversity and unique conditions that give it a high potential for the use of renewable and clean energy. Off-grid power systems are supplied by different renewable energy sources, although these sources are often intermittent, their use is taking place in both developed and process developing such as Ecuador. This is due to several factors, such as the downward trend in the cost of photovoltaic systems, as well as improved technology and falling prices of electrical storage systems [3].
In this paper, to compensate for the previous drawbacks explained while maintaining a degree of generality is the development of a simulation case study for a photovoltaic generation using the Simulink software of Matlab to know the behavior of electric power generation through photovoltaic energy.
The scheme of the off grid photovoltaic systems developed in the Simulink environment is composed of an array of photovoltaic modules, a charge controller, a storage system, and a single-phase inverter. In addition, a maximum power point tracking (MPPT) algorithm was developed to obtain the maximum power of the array and a discrete proportional control for battery charging and discharging was incorporated.
In addition, for the dimensioning of an off grid photovoltaic system, a tool was designed and developed using Excel Macros and Visual Basic, to facilitate the input of parameters and obtain the results simply and efficiently.
METHODOLOGY
For the development of the project, electricity demand data from three rural areas on the coast, highlands and Amazon regions of Ecuador were used. Based on this data [4], each of the components of the off grid photovoltaic systems was dimensioned. The simulation was carried out based on the electrical power demand and the solar resource obtained from the software of the European Commission Joint Research Center called Photovoltaic Geographical Information System (PVGIS), which allows for obtaining global radiation data. In addition, the dimensioning of the off grid photovoltaic system considered technical reports such as: “Balance Energético Nacional 2020” prepared by the Instituto de Investigación Geológico y Energético (IIGE) trought which it was possible to know how the people of Ecuador have increased the use of electric energy for different household, commercial and industry activities [5], “Microgeneración” of the Agencia de Regulación y Control de Energía y Recursos Naturales no Renovables (ARC) to know the regulation for off grid electrical systems [6] and “Atlas solar del Ecuador” of the Corporación para la Investigación Energética (CIE) to study the behavior of solar radiation in different regions of the country [7]. Consequently, a sizing tool based on Macros and Visual Basic was developed through Excel, which facilitated the input of different parameters.
Once the results were obtained through the sizing tool, an algorithm called maximum power point tracking (MPPT) was developed to obtain the maximum power of the PV array. In addition, a discrete integral proportional control was incorporated for the control of the batteries.
The parameters and algorithms were used to perform the simulation and performance tests in the Simulink environment of Matlab to obtain the curves of voltage, current and power generated by the photovoltaic systems, in addition, it was verified that the generation is capable of meet the demand.
System Requirements
Ecuador is a country that has very varied topographic characteristics, so it has a high potential for the use of photovoltaic solar energy. According to [8], the average global radiation values in Ecuador are homogeneous, which translates into a significant reduction in the problem of random variations of this resource. In addition, it provides confidence and profitability for the use of photovoltaic technology in the country [9-13].
The increase in population and the growing demand for electrical energy per inhabitant [14], makes it necessary to carry out studies that allow us to know how photovoltaic energy can be used to electrify different areas of Ecuador, especially those in which the conventional grid is limited by the difficulties of access inherent to nature. For this reason, three rural areas from different regions of Ecuador have been chosen for the study of the solar resource: coast region (Pedernales), highlands region (Ambuquí) and amazon region (Cuyabeno).
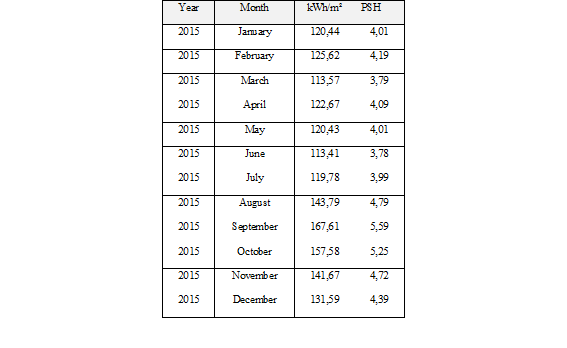
The PVGIS software was used to study solar resources, from which global radiation data were obtained for each of the selected areas. Table 1, Table 2, and Table 3 show the global radiation data for different regions and the peak sun hours (PSH) corresponding to 2015. The data obtained from the three places mentioned are provided by PGVIS because this online tool provides information on solar radiation and the performance of the photovoltaic (PV) system for any location in the world.
With the solar resource data of each one of the selected areas, and through an analysis of the electrical demand data presented in [4] and [5], the dimensioning of the off grid photovoltaic systems begins.
Component Modeling
The off grid photovoltaic system developed in the Simulink environment consists of the following elements:
Photovoltaic Module Array
The photovoltaic module harnesses the solar energy incident on its surface to convert it into electrical energy in the form of direct current.
Off grid photovoltaic systems use a certain number of modules according to the electrical demand to be satisfied [15]. In the Simulink environment, it is necessary to place a capacitor and resistor in parallel to stabilize the voltage and current at the output of the array of panels (Fig. 1), which will allow coupling of the charge regulator (Fig. 2).
Charge Regulator
It is one of the most important elements within an off grid photovoltaic system since its main function is to avoid situations of overcharge and over-discharge of the battery, with the sole purpose of increasing its useful lifetime [16].
The load controller developed in the Simulink environment is shown in Fig. 2 and is composed of a step-down converter and a bidirectional converter.
In addition, the charge controller is complemented by the following algorithms:
MPPT: the maximum power point tracker will allow obtaining the peak power of the PV array [17]. The algorithm used for this control technique is the Perturb and Observe (P&O) algorithm (Fig. 3) which is responsible for perturbing the operating voltage to ensure the photovoltaic modules deliver their maximum power.
Discrete integral proportional control: this type of control allows for the correction and compensation of disturbances to maintain the voltage and current variable within the parameters already established for the charging and discharging of the battery.
Three integral type proportional controls were developed in the Simulink environment.
Fig. 4 shows the current control that will govern the action of the bidirectional converter IGBTs for charging and discharging the batteries.
Fig. 5 shows the charge voltage control that allows obtaining a reference co-current for battery charging.
Fig. 6 shows the discharge voltage control to obtain a reference current for discharging the batteries, in such a way that it can allow the inverter to operate.
Storage System
This system (Fig. 7) makes it possible to store the electrical energy produced by the photovoltaic array and use this energy at times when the radiation received by the modules is not capable to achieve the photovoltaic power required to meet the demand.
Inverter
This element allows converting the direct current of the storage system into alternating current, same as the provided by the power grid for the residential sector: 110 or 120 (VAC) and a frequency of 60 (Hz). The single-phase inverter developed in the Simulink environment is shown in Fig. 8, which is composed of a step-up converter, IGBT bridge and LC filter [18].
Sizing Tool
To carry out the load study and determine each of the parameters that make up the photovoltaic system, a dimensioning environment was developed using Macros and Visual Basic in Excel. In addition, there is a database with the datasheets of the components of the off grid photovoltaic system based on the local market offer.
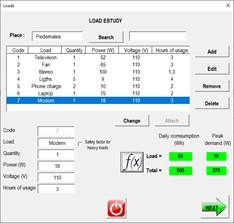
Fig. 9 shows the window to perform the load study, in which it is possible to Add, Edit, or Delete electrical loads. In addition, the daily consumption and total maximum demand of all aggregated loads will be obtained.
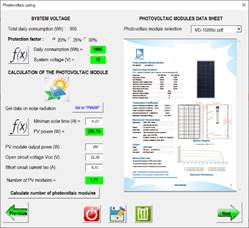
Fig. 10 shows the interface for PV module sizing, where the following data will be obtained: oversized daily consumption (Wh), system voltage (V), PV power (W) and several PV modules. With the oversizing of the daily consumption with factors of 20, 25 or 30%, it is assured that the photovoltaic system is capable of satisfying the electrical demand in the event that all electrical loads work simultaneously. In addition, system losses due to temperature coefficients, cloudiness and atmospheric conditions are compensated.
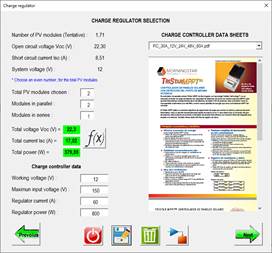
Fig. 11 shows the window for sizing the charge controller, open-circuit voltage Voc (V), short-circuit current Isc (A) and total power (W) will be obtained in this interface. With the previous data, the most suitable charge regulator can be selected.
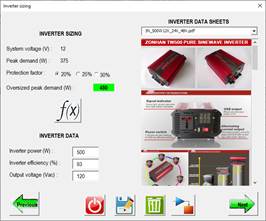
For the sizing of the single-phase inverter, the window shown in Fig. 12 is used and with the oversized peak demand data, the inverter with the most suitable electrical power is selected.
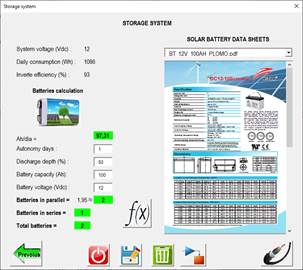
Fig. 13 shows the interface for sizing the DC electric energy storage system where the following data must be entered: days of autonomy, discharge depth (%), battery capacity (Ah), and battery voltage (Vdc). With the data entered above, the number of batteries in series and parallel is obtained.
In each of the windows developed for the dimensioning of the components of the off grid photovoltaic system, there is a button with the Simulink symbol that allows you to enter another macro interface, where the values of the components are obtained for the respective simulation of the system.
RESULTS AND DISCUSSION
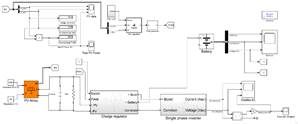
The schematic of the off grid photovoltaic system developed in the Simulink environment is presented in Fig. 14.
According to [19], the average radiation that reaches the earth's surface is 1000 (W/m²). This value is used together with the irradiation data in Table 1, Table 2, and Table 3 to calculate the PSH. Important data to determine the necessary photovoltaic power to cover the demand in the chosen areas.
Case study 1: Pedernales site. Fig. 15 shows the curves obtained by the photovoltaic array. The voltage has a maximum value of 18.49 (Vdc), the maximum current value is 17 (Adc) and the power obtained is 299.6 (W).
The curves of the single-phase inverter are shown in Fig. 16. The current has a peak value of 3.01 (Aac), the voltage has a peak value of 174 (Vac) and the power is 497.70 (W).
Case study 2: Ambuquí site. In Fig. 17, the curves of the Ambuquí photovoltaic array are presented. The value obtained in the voltage curve is 36.01 (Vdc) and the maximum output current has a value of 19.17 (Adc). The power for this area is 690.20 (W).
In Fig. 18, the curves of the single-phase inverter in the Ambuquí area are presented. The current reaches a peak value of 27.57 (Aac) and the voltage reaches a peak value of 159.3 (Vac). The output power of the inverter is 4359 (W).
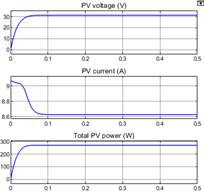
Case study 3: Cuyabeno site. In Fig. 19, the curves of the photovoltaic array of the Cuyabeno are shown. The voltage reaches a value of 31.29 (Vdc) and the current has a value of 8.62 (Adc). The power reaches a value of 269.9 (W).
In Fig. 20, the curves of the single-phase inverter in the Cuyabeno area are shown. The current has a value of 2.53 (Aac) and the voltage has a peak value of 182.9 (Vac). The peak power reached is 401.9 (W).
The Maximum Power Point Tracking (MPPT) algorithm will always obtain the peak power of the PV array, which will avoid power fluctuations due to changes in parameters such as irradiation since the solar resource is variable during the day.
The simulated MPPT charge controller allowed obtaining optimal voltages and currents for the storage system, thus avoiding overvoltage or overcurrent, and guaranteeing the stability of the battery parameters.
The discrete PI control developed allows controlling only the charge and discharge of the batteries. The electronic protections that the regulator has for overcharge and over-discharge conditions are not considered for the simulation.
CONCLUSIONS AND RECOMMENDATIONS
The possibilities and benefits that offer photovoltaic solar energy in rural areas of Ecuador were known after the analysis in the present paper. This simulation corresponds to a suitable tool for a study before the implementation of this type of renewable generation system.
The number of photovoltaic modules varies according to the peak power of the chosen module, so the selection of a small power panel will imply an increase in the number of solar panels to obtain the required photovoltaic power.
The results obtained in each of the simulations performed in the Simulink software are considered ideal values because the losses are due to the self-consumption of power of the elements of the off grid photovoltaic system and energy transport through electrical conductors is not modeled by the environment.
The dynamics tool developed in Excel Macros and Visual Basic will facilitate the study, dimensioning and implementation of the off grid photovoltaic systems due to its simple and efficient interface.
With the values obtained in the different case studies of this work, it is shown that it is possible to size and simulate off grid photovoltaic systems in a simple and dynamic way, which allows supplying various values of energy demand, considering that the energy supply has become a necessity for the development and good quality of life of people.
The work done can be considered for the development of future simulation studies and later implementation of the off grid photovoltaic systems, especially in rural areas of Ecuador where the lack of access to electricity limits the development of other technologies such as information and communication.
Based on the demands of the current panorama, rural locations must work to achieve a reliable, effective, efficient, sustainable and economic energy supply to guarantee progress and rural development. It is in this context, where the option of the off grid photovoltaic systems is used as an alternative to access electricity.
The developed tool proposes to the off grid photovoltaic systems as an energy solution that must be implemented more frequently on a small, medium and large scale; either due to being in isolated areas that are difficult to access or simply due to lack of coverage of the national interconnected system.


