


 Inglês (pdf)
 Artigo em XML
 Referências do artigo
 Enviar este artigo por email
 Citado por SciELO
  Similares em
SciELO
Similares em
SciELO 
 Permalink
Introduction
It is important to understand the process that must be carried out for adequate natural ventilation in buildings’ design, adaptable to urban areas’ scenarios. The analysis at an urban scale can be achieved through simulations with tools that allow evaluating the wind behavior (Yi & Peng, 2014). Since 2000, this new technique that combines energy simulation with optimization has started an emerging technology that generates new designs based on computational modeling results. This efficient methodology guarantees an optimal design, providing solutions to several problems (Lin, 2014). Yi & Peng (2014) proposed coupled outdoor-indoor microclimate simulation for the passive design of urban-scale buildings. The authors extracted an urbanization’s microclimate condition through simulations in ENVI-met software, allowing the visualization of wind direction and areas with higher temperatures. It was observed that the wind speed around the building is drastically reduced, which could impact the interior thermal conditions of the building. The authors emphasize that the indoor thermal performance interacts with specific outdoor microclimates, thus showing the importance of a coupled indoor-outdoor simulation at the microclimate level to implement passive design features in buildings.
On the other hand, Jiang, Wu, & Teng (2020) used ENVI-met software to simulate wind parameters in six case studies based on the various spatial distribution of a set of buildings. The characteristics of microclimatic conditions were compared and evaluated in terms of wind and air temperature. This study highlights the relationship between the distribution of buildings and wind in an outdoor environment. According to the direction of the prevailing wind, a correct arrangement of the buildings allows the formation of a ventilation corridor that favors airflow, thus preventing the structures from causing a barrier effect. The authors indicate that the hypodermic layout should be adequate by allowing the insertion of wind into the constructions and facades of the buildings.
The study by Tong, Chen, & Malkawi (2016) was based on the configuration of surrounding urbanization and the airflow through naturally ventilated buildings. Most of the studies have revealed that airflow is extremely sensitive. Different variables of urban morphology are an axis of action in this matter. The authors refer to the coupled exterior-interior technique they achieve using computational fluid dynamics (CFD) simulations. The authors stated that key urban parameters such as wind condition (wind direction and speed), H/W aspect ratio (building height/street width), the height of the buildings relative to the surroundings, and the number of obstacles in the direction of the wind flow are influential. The analysis of their work showed the influence of the surrounding building layers on the building under study. They also state that wind direction is significant for the flow pattern through and around the buildings. They point out that the flow field around the buildings is more “aerodynamic” under an oblique wind direction (45°); thus, the air change rate per hour was noticeably higher.
On the other hand, Kusumastuty, Poerbo, & Koerniawan (2018) considered building configurations, such as distance between structures, average height, orientation, and road width, to analyze a study based on the principle of climate-sensitive urban design. Bouchahm, Bourbia, & Bouketta (2012) performed a numerical simulation to evaluate the effect of wind, considering parameters such as orientation, the geometry of buildings, spatial arrangement, angle of wind incidence, and vegetation. Similarly, Priyadarsini, Hien, & Wai (2008) performed a numerical study of air temperature under different wind speed levels, noting that the air temperature decreases with increasing speed. Meiss & Feijo (2017) presented the use of a model capable of qualifying and quantifying the available natural ventilation flows applied to energy retrofitting of residential districts. It considered factors such as wind pressure, building envelopes, and turbulence.
At the Faculty of Built Environment, University of New South Wales, Sydney, a study on natural ventilation performance and its associated influence on outdoor thermal environment potential and thermal comfort was conducted (He, Ding, & Prasad, 2020). Some mitigating measures for the local heating caused by the urban heat island (UHI) phenomenon were presented. Through urban planning and design techniques, the insertion of wind at lower temperatures was allowed, thus mitigating the UHI. This is one of the main reasons causing the reduction of natural ventilation.
At the City University of Hong Kong, a study was conducted to examine the influence of urban canyon aspect ratio and tree configuration on microclimate and thermal comfort (Morakinyo & Lam, 2016). This study included the relationship between tree height and crown diameter, trunk height, leaf area index, and planting pattern, subject to different wind conditions. It was found that there was some reduction in air temperature and the mean radiant temperature. The latter was dependent on radiative fluxes (specifically direct shortwave radiation). The trees’ shading effect is attributed to these changes in the microclimate and thermal comfort of the urban canyon.
The evaluation of the modeling techniques previously implemented by researchers contributes to analyzing the parameters and indicators that should be considered for studying natural ventilation potential at the urban scale. One of the approaches to determine the indicators at the design stage is the coupled dynamic simulation. At this stage, objective criteria can be selected to evaluate the performance of the indicators often used in the literature.
Providing a better understanding of the surroundings’ microclimate before applying natural ventilation to the design is a fundamental step in mitigating the consumption cost in a building from the beginning of its conception (Pérez, 2018). Furthermore, it is possible to take advantage of this natural resource to obtain good thermal comfort and ensure optimal indoor air quality (Kastillo & Beltrán, 2015). The use of natural ventilation strategy could achieve energy savings of 9.7%, especially for residential buildings (Guía de construcción sostenible para el ahorro de energía en edificaciones, 2016). A simulation study in a residential building area was performed to study the effectiveness of natural ventilation; Amin Mirakhorli modeled in EnergyPlus building thermal behavior (Mirakhorli, 2017).
Currently, there is significant uncertainty about the future energy sustainability of Panama. The growing urbanization of Panamanian society has led to a massive construction method over time, leaving aside indoor comfort parameters, which leads users to opt for electromechanical air conditioning systems that considerably increase energy consumption (Pérez, 2018). Statistics show that almost 60% of the electricity consumption in Panama is concentrated in providing comfort to stores, residences, and public and private offices, where 11% of total residential consumption is due to air conditioning. The National Energy Secretary (SNE) project estimates that by 2050, 66% of homes will have at least one air conditioning unit, which means that more than one million homes will have this equipment. Knowing the total energy demand of the residential sector and the number of homes with air conditioning, it is expected that, by 2050, 55% of residential consumption will be due to this equipment, which is a significant increase.
On the other hand, Panama's ratifications of international agreements commit the country to the goals of economic development and the environment, contributing to reducing greenhouse gas emissions and making it possible to advance in the fight against climate change. Therefore, the approval of building codes and standards is crucial for Panama. Furthermore, being a country where more than 70% of electricity is consumed in houses and buildings, it is required that architects, urban planners, and engineers take advantage of the natural environment and prioritize bioclimatic design strategies with a view to the energy efficiency of buildings (Secretaría Nacional de Energía, Plan Energético Nacional 2015-2050, 2016).
This research arises because a technical-scientific study is essential to guide the authorities, urban planners, architects, and engineers of the Republic of Panama to energy development conceived by implementing passive strategies, such as natural ventilation, in the construction process of housing developments. Thus, the objective is to evaluate the microclimate's effect on buildings’ thermal and energetic performance in an urban area of the historical heritage in Panama City. This evaluation uses dynamic simulation, a numerical approach, and existing indicators in humid tropical climates. The wind is the most recommendable climatic parameter to take advantage of, so it is essential to study its behavior to identify the architectural strategies and urban distribution to exploit suitable natural ventilation.
Methodology
Building energy simulation software has gradually become widely used to evaluate urban natural ventilation (Mirakhorli, 2017). Similarly, microclimate simulation tools that offer the possibility of making small-scale climate predictions for different urban configurations have been employed (DesignBuilder, n.d.). Therefore, integrating these programs could be a solution that allows the quantitative evaluation of the effects of microclimate on the thermal behavior of buildings and energy used in an urban context (Mirakhorli, 2017).
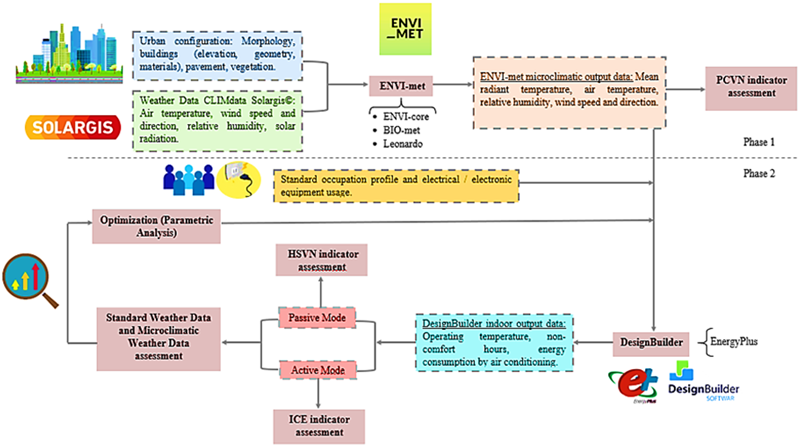
For this study, an integrated simulation method was established to evaluate buildings' natural ventilation potential and energy use in urban environments based on the urban microclimate model ENVI-met and the building energy simulation software Designbuilder (based on the EnergyPlus calculation engine).
ENVI-met is a prognostic, three-dimensional, non-hydrostatic, micro climatological model based on computational fluid dynamics (CFD) and thermodynamics. It simulates microclimate data, such as air temperature, relative humidity, wind speed, and mean radiant temperature. Furthermore, it is a tool that calculates various processes such as thermo-hygrometric exchange and bioclimatology. It can analyze the interactions between architecture, atmosphere, and the surrounding urban environment. It estimates the energy and the exchange processes between the exterior space and the interior environment of buildings (Cordero, 2014).
DesignBuilder is a tool that identifies quickly and efficiently the design options that offer the best performance in terms of cost, energy, and comfort. This module can be used to select design solutions with greater energy, environmental and economic potential. Also, it can be used to conduct a parametric analysis and sensitivity to identify the design variables with the most significant and minor impact on the simulation results. This might be useful for discarding unimportant design variables and focusing on those with the most significant impact (DesignBuilder, n.d.).
The ENVI-met model is widely accepted and has several landscapes and built environment studies (Morakinyo & Lam, 2016). This model was used to predict the outdoor thermal environment concerning the urban configuration of the case study. The outdoor weather boundary conditions adopted in that tool were derived from data observations at satellite weather stations. In addition, a compendium of historical weather data from the CLIMdata Solargis © service was used. Microclimate variables such as air temperature and relative humidity were extracted from ENVI-met simulation results. Then, these variables were used as input data to the DesignBuilder software. Microclimate effects on the building energy performance could be incorporated into the DesignBuilder simulation to obtain the indoor thermal conditions, as shown in figure 1. The DesignBuilder software was developed in the United Kingdom; the version v7.0.0.116 was used in this study.
The qualitative method was used, which is related to the physical-geographical descriptions of the study area, and the quantitative method, which refers to the environmental variables (air temperature, relative humidity, wind speed, wind direction, and mean radiant temperature). The case study consists of the urban area of Casco Antiguo in Panama City as a reference to analyze the microclimate's effects and the indicators' performance that allowed the evaluation of the natural ventilation potential through the established criteria. This urbanization based on the standard construction style in Panama's context was optimized for maximum energy use. It also analyzes the buildings' electricity consumption using standard meteorological and microclimatic data. With the help of the DesignBuilder software, the aim is to reduce unsatisfied hours of comfort and energy consumption.
Description of the case study
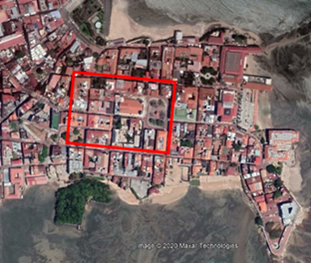
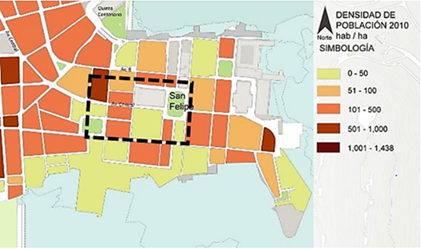
The urban area taken as a reference for this case study is the Casco Antiguo of Panama City (Figure 2), which has spatial and environmental characteristics typical of its socio-historic context. It was the second city of the Spanish colony in the Isthmus (1673). It obeyed the urbanization plan legislated by the Laws of the Indies (1680), which established guidelines on the design of the cities colonized by the Spanish Crown. Currently, the site is considered a World Heritage Site by the United Nations Educational, Scientific, and Cultural Organization (UNESCO), and it is maintained under Panama’s Historical Heritage conservation regulations as a National Monumental Site (Mendes & Romero, 2021).
It has a checkerboard layout aligned to the four cardinal points where the main square consists of the main church. As the city grew, the other surrounding squares emerged. According to the vernacular constructions, the buildings maintain a norm of heights between one and three naves, composed of calicanto, wood, clay blocks, and concrete. Most of the roofs are of colonial tiles and a few slabs. The streets are made of red cobblestones; they are 4.5 to 9 m wide (Mendes & Romero, 2021).
The Casco Antiguo study area is in the Awi climatic region according to the Köppen classification (Atlas Nacional de Panamá, 1988): tropical climate (A) with the dry season (w) during the northern hemisphere winter and slight thermal oscillation (i), also called tropical savanna climate (Mendes & Romero, 2021). Therefore, the study area was classified as a local climate zone type 3. This is because it presents a compact zone composed of low-rise and high-density buildings. The study area presents buildings between one and three levels, few trees, paved ground cover, and construction materials such as concrete and brick (Cordero, 2014).
Microclimate assessment of the case study
An image of the Casco Antiguo was taken from Google Earth Pro © with Bitmap extension (BMP); the image was cut to scale with the area's dimensions. This crop was 290 m (x) by 226 m (y), covering the Metropolitan Cathedral Church, the Independence Square, and part of the Tomás Herrera Square.
We proceeded to define the pixel size of the space to be simulated (GRID): for (z), we used twice the height of the highest building of the stage; for (x) and (y), we used values between 2 and 3. The pixel size should follow the stage so that it fits correctly to the details of the cut-out surfaces.
The north is rotated so that the model is adjusted in an orthogonal format to the worktable's axes (x, y), thus simplifying the modeling process. From this, we proceeded to construct the model for the simulation of the urban microclimate. Finally, the information regarding building heights, surface materials, pavements, and plant species compatible with the software database was selected and placed (Figure 3a) and figure 3b
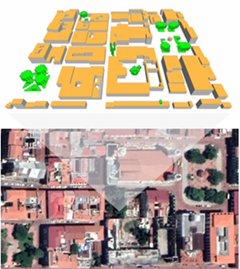
The model was developed using the plugins included in ENVI-met software (ENVI-core, BIO-met, and Leonardo). ENVI-core allowed the extraction of the maps that compile the algorithms of the behavior of the modeled microclimate. BIO-met calculated the comfort indices, and Leonardo generated the maps of the environmental variables (air temperature, relative humidity, average radiant temperature, wind speed).
Only the most critical day of each month was used for the simulations due to limited access to computing resources and time. These days were selected according to the highest air temperature and highest direct solar radiation recorded. The meteorological conditions of the most critical days of each month were obtained through a compendium of weighted historical meteorological data from the CLIMdata Solargis © service. The data for the simulation were extracted from this information (considered standard meteorological data), as shown in Table 1. The wind direction was obtained using histograms where the most frequent values were selected, and their average speed was obtained. For this case study, 2015 was chosen because it had the driest months and the lowest relative humidity (2015-2019). According to the case study, a roughness factor value of 0.1 was used. The results for the twelve months of the year were evaluated at the height of 1.5 m from the ground at 7:00, 15:00, and 21:00 hours. Each simulation lasted about 19 hours using a computer with 64 Gb RAM, an Intel i7-9700F processor @ 3.0 GHz CPU speed, and eight cores.
Table 1: Weather conditions for each simulation.
| Monthly Critical Day | TMax (°C) Hour | Tmin (°C) Hour | HRMax (%) Hour | HRMin (%) Hour | Wind Speed (m/s) | Wind Direction (°) |
|---|---|---|---|---|---|---|
| January 3 | 35.00 15:00 | 23.90 6:00 | 94.00 5:00 | 44.00 15:00 | 0.43 | 126.00 |
| February 20 | 34.60 15:00 | 22.20 6:00 | 93.00 6:00 | 40.00 15:00 | 2.77 | 85.67 |
| March 17 | 35.60 15:00 | 24.90 6:00 | 73.00 6:00 | 36.00 16:00 | 2.30 | 49.00 |
| April 11 | 35.30 15:00 | 24.80 6:00 | 82.00 00:00 | 44.00 16:00 | 1.75 | 87.00 |
| May 20 | 34.80 15:00 | 24.50 6:00 | 90.00 6:00 | 53.00 16:00 | 0.87 | 83.30 |
| June 23 | 32.80 15:00 | 23.40 6:00 | 94.00 6:00 | 58.00 15:00 | 0.45 | 108.25 |
| July 21 | 35.50 16:00 | 24.30 5:00 | 97.00 4:00 | 49.00 16:00 | 0.30 | 89.30 |
| August 19 | 34.70 15:00 | 24.10 6:00 | 95.00 5:00 | 52.00 15:00 | 3.90 | 188.00 |
| September 1 | 32.50 15:00 | 23.00 6:00 | 98.00 00:00 | 60.00 15:00 | 2.10 | 83.00 |
| October 20 | 32.50 15:00 | 23.00 6:00 | 96.00 6:00 | 62.00 14:00 | 2.33 | 90.67 |
| November 11 | 32.90 15:00 | 23.70 6:00 | 94.00 5:00 | 61.00 13:00 | 2.55 | 80.00 |
| December 16 | 34.30 15:00 | 24.60 6:00 | 94.00 6:00 | 50.00 16:00 | 4.20 | 34.50 |
Microclimatic data generation from ENVI-met results
The outdoor air temperature and relative humidity are harmonic functions of time with angular frequency ω and amplitude A o (Zhou, Zhang, Lin, & Li, 2007). Through simulations in the ENVI-met software, these variables' monthly maximum, average, and minimum values were obtained at 1.5 m. A time lag of 24 hours was considered where ω=2𝜋/24 ℎ −1 . The 24 hours were recreated for all other days of the corresponding month. The outdoor air temperature can be expressed as shown in equation (1), leading to equation (2) (Zhou et al., 2007).
where 𝑇 𝑎 is the average outdoor air temperature, 𝑇 𝑚𝑎𝑥 is the maximum outdoor air temperature value recorded, t is the time in hours, and Ø represents the phase shift.
The outdoor relative humidity was assumed to follow a behavior as expressed in equation (3), which leads to equation (4).
where 𝐻𝑅 corresponds to the average relative humidity and 𝐻𝑅 𝑚𝑎𝑥 represents the recorded maximum outdoor relative humidity value.
For the outdoor air temperature function, the offset was obtained by replacing the maximum value at the corresponding time ( 𝑇 𝑎 = 𝑇 𝑚𝑎𝑥 @ 𝑡) in equation (2), resulting in a value of 3.93 rad. The same procedure was applied to obtain the offset in relative humidity (𝐻𝑅= 𝐻𝑅 𝑚𝑎𝑥 @ 𝑡) with equation (4), resulting in 0.26 rad.
In addition, DesignBuilder also requires the dew point temperature (T dp ) corresponding to the microclimate, which was calculated by employing both outdoor air temperature and relative humidity in equation (5) (Lawrence, 2005):
In this way, the values of 𝑇 𝑎 , 𝐻𝑅 and T dp were obtained for the 24 hours of each day, using the results of the ENVI-met simulation. Since the microclimatic data was performed for the most critical day, the resulting 24-hour values for 𝑇 𝑎 , 𝐻𝑅, 𝑎𝑛𝑎 T dp were adopted for the entire corresponding month (i.e., every day in March has the same behavior as the most critical day in the month). Other environmental variables, such as direct, diffuse solar radiation, wind speed, and wind direction, are considered equal to those provided by the standard meteorological data.
The microclimatic data resulting from the simulations in ENVI-met are presented in Figures 4-6 for each month throughout the year. The critical month corresponds to March, with the highest outdoor air temperature recorded for the standard meteorological data (Table 1) and the microclimatic data. The temperature levels in figure 4 show that external thermal comfort is only achieved during the night and early morning hours. This is important as it certainly benefits the nocturnal activities of the site; however, most of the cultural activities take place during afternoon hours.
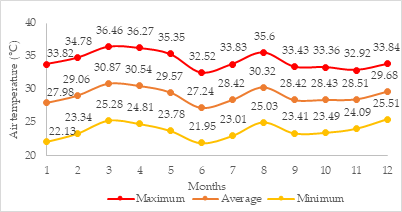
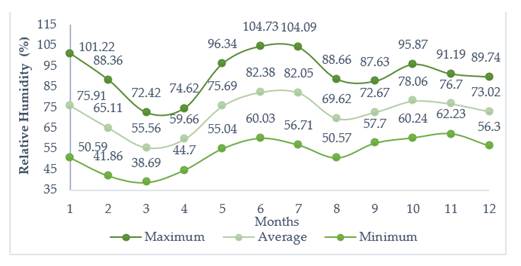
The values in figure 5 show that the month with the lowest relative humidity recorded was March, considered the driest month. The relative humidity values higher than 100% are due to the approximation used; however, they were limited to 100% in the simulations. The highest humidity levels occur in the early morning hours. In contrast, the lowest values occur in the midday or afternoon hours.
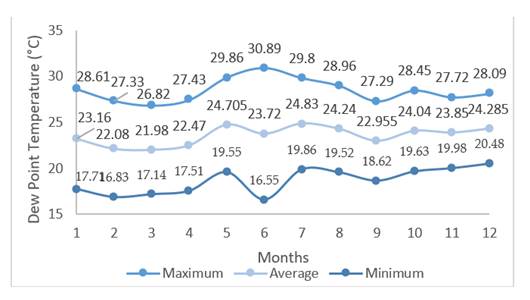
In the case of the dew point temperature, as shown in figure 6, June has the highest value, coinciding with the month with the highest relative humidity (Figure 6). However, the graph also shows that a minimum value of 16.55 °C was reached just this month.
Urban settlement natural ventilation potential assessment
The NVCP was used as one of the indicators for assessing ventilation potential. This indicator is based on air temperature and relative humidity (Yoon, Norford, Malkawi, Samuelson, & Piette, 2020).. It is defined as the number of hours within a stipulated time range. The local outdoor climatic conditions are favorable for using natural ventilation.
The criteria for lower and upper temperature were determined by the adaptive model of the ANSI/ASHRAE 55 standard. Two thresholds were established to assess whether the climatic conditions allow natural ventilation: the outdoor air temperature must be within the comfort range established for indoor temperature variations, and the outdoor relative humidity must be within the comfort range established for indoor relative humidity variations as presented in equations (6) and (7) (Causone, 2015).
where 𝑇 𝑖𝑛𝑡, 𝑖𝑛𝑓 and 𝑇 𝑖𝑛𝑡, 𝑠𝑢𝑝 are the lower and upper indoor temperatures, respectively. 𝐻𝑅 𝑖𝑛𝑡, 𝑖𝑛𝑓 and 𝐻𝑅 𝑖𝑛𝑡, 𝑠𝑢𝑝 are the lower and upper indoor relative humidity, respectively.
The upper limit for indoor temperature ( 𝑇 𝑖𝑛𝑡, 𝑠𝑢𝑝 ) was determined by applying the ANSI/ASHRAE 55 (ASHRAE, 2013) standard procedure based on an acceptable 80% environment (Causone, 2015), following equations (8) and (9).
where 𝑇 𝑐??𝑚𝑓 is the optimum comfort temperature, and 𝑇 𝑎 is the monthly average outdoor air temperature. For the lower limit ( 𝑇 𝑖𝑛𝑡, 𝑖𝑛𝑓 ) the following equation (10).
The lower and upper relative humidity thresholds were established, considering RH values within the comfort range, generally between 30% and 70%.
Thus, the PCVN is calculated by adding the hours in which the climatic conditions meet both criteria simultaneously, divided by the total number of hours in the year (Equation (11)) (Causone, 2015).
where ℎ 𝑉𝑁,𝑖 is equal to one, if the climatic condition at the 𝑖 𝑡ℎ hour of the stipulated time range meets the established criteria and equals to zero otherwise; ℎ 𝑡𝑜𝑡 is the total number of hours of the stipulated time in which the evaluation was performed.
Indoor thermal comfort and energy consumption assessment
The building block tool was used to construct the cut-out buildings in the DesignBuilder software. The data on the dimensions of streets, buildings, squares, and vegetation were obtained using Google Earth Pro.
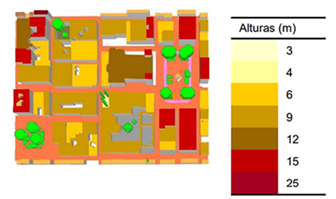
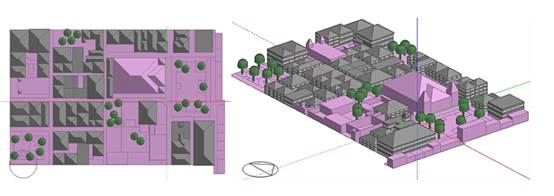
The building block tool (light purple sections in figure 7) was used for uninhabited buildings, churches, and historical ruins. As the model was being built, the information regarding the heights and buildings’ levels were selected and placed using the Google Earth cut-out as a guide. Then, in the DesignBuilder database, materials were selected according to the actual characteristics of the surfaces, pavements, and plant species.
The cut-out of the Casco Antiguo has a different occupancy profile depending on the building typology. Around 50% of the buildings are establishments dedicated to commercial activities, such as restaurants and bars, causing high flows of people on weekends at night. Around 40% are facilities dedicated to hotel and residential services, and around 10% are public offices and institutions (Padilla, 2016).
The town of San Felipe, where the Casco Antiguo is located, has a population of approximately 3262 people (Padilla, 2016). The population density in the cut-out under study is presented in figure 8; it was considered equivalent to the occupancy profile for the simulation in the DesignBuilder software.
Among the high-consumption equipment critical for characterizing the energy use profile, the following were considered: air conditioning units, refrigerators (running 24 hours a day), and fans (used during midday and afternoon hours). Multiple fluorescent lights were also considered using an energy use profile at night and every morning (Table 2). Other devices such as blenders, microwaves, television, and coffee maker were used in hotels, restaurants, and residences. However, their use is minimal, so it was decided to omit them within the characterization.
For the evaluation of thermal comfort, the operative temperature is employed as an indoor temperature. According to Panama building regulations, indoor temperature levels must be within 23.5 - 28.5 °C, with relative humidity between 60 - 80%.
Table 2: Equipment usage and occupancy profile.
| Schedule | |
|---|---|
| Occupation profile 0 - 0.005 pl/m2 0.0051 - 0.01 pl/m2 0.0101 - 0.05 pl/m2 0.0501 - 0.1 pl/m2 | Mon to Fri: 8:00 to 18:00 Sat to Sun: 13:00 to 17:00 |
| Luminaires (24 W) | Mon to Fri: 19:00 to 22:00 Sat to Sun: 19:00 to 5h00 |
| Fans (70 W) | Mon to Fri: 12:00 to 16:00 Sat to Sun: 11:00 to 16:00 |
| Computers (65 W) | Mon to Fri: 9:00 to 17:00 |
| Refrigerator (145 W) | Sun to Sat: 0:00 to 23:59 |
| Air conditioning unit | Mon to Fri: 9:00 to 17:00 Sat a Sun: 10:00 a 22:00 |
Passive cooling potential for indoor thermal comfort assessment
The Natural Ventilation Satisfied Hours (NVSH) is another indicator used to quantify this potential. It is defined as the number of hours, within a stipulated time range, that the indoor operating temperature, under natural ventilation conditions, can meet the thermal comfort requirements. This indicator's definition considers the outdoor climate and the buildings’ characteristics, such as geometry and thermal performance. The NVSH measures the maximum number of hours when the outdoor climate is favorable for natural ventilation inside buildings, based on the thermal comfort requirements established in the ASHRAE 55 standard (ASHRAE, 2013) regarding naturally conditioned areas (Tan & Deng, 2017).
The criteria for this indicator are based on the standard’s comfort range; this is defined as a function of the average outdoor air temperature ( 𝑇 𝑎 ) and the operative temperature ( 𝑇 𝑜 ). The NVSH is calculated as the intersection of 𝑇 𝑎 y 𝑇 ?? for an acceptable 80% environment, equations (12) and (13).
where ℎ 𝑆𝑉𝑁,𝑖 is equal to one if the thermal comfort condition at the 𝑖 𝑡ℎ hour of the stipulated time range meets the established criteria and is equal to zero otherwise; ℎ 𝑡𝑜𝑡 is the total number of hours of the stipulated time in which the evaluation was carried out.
Energy performance for active cooling assessment
Electricity Consumption Indicator is used to quantify the active mode power consumption of buildings; it is defined by equation (14).
where 𝐶 𝐸 is the electricity consumption for air conditioning (air conditioning + mechanical ventilation) for each building.
Assessment of passive strategies to improve building performance
The optimization method may require the application of various techniques so that it can be successfully adapted to a specific case study (Belegundu & Chandrupatla, 2019). For this optimization process, the microclimatic data generated from ENVI-met was used and was performed for March through a sensitivity analysis and a parametric study using the DesignBuilder software. The non-comfort hours are based on the ASHRAE 55 (ASHRAE, 2013) adaptive model of 80% acceptability. This software runs a series of simulations and performs a screening process to identify the most important design variables. These variables are combined until optimal and best-performing solutions are achieved to discard unimportant options and focus on those with the most significant impact (DesignBuilder, n.d.). The optimization was performed from two perspectives and for two design criteria: passive and active modes.
Passive mode
Under the passive design criterion, the optimization process involves sensitivity analysis that includes input variables such as the operating hours of external windows (natural ventilation), window glazing, external wall construction material, and roof construction material (Table 3). These parameters influence the non-comfort hours based on the ASHRAE 55 adaptive model with 80% acceptability. A parametric study was also performed to identify the best option out of certain combinations representing the optimal solution and the best performance.
Table 3: Design variables options for the optimization process.
| Window operation schedule (natural ventilation) | Roof types | Wall construction materials | Window glazing types |
|---|---|---|---|
| Off 24/7 | Clay tiles (25 mm) on air gap (20 mm) on roofing felt (5mm) | Lightweight superinsulated | Double Low-E Glass (e2=1) Clr 6mm / 6mm air |
| RestPub-EatDrink- Occ (Mon to Fri: 8:00 to 18:00 Sat to Sun: 13:00 to 17:00) | Flat roof superinsulated | Project wall | Sgl Bronce 6mm |
| On 24/7 | Flat roof U-value = 0.25 W/mk | Super insulated brick/ block external wall | Sgl Clr 6 mm |
| Night ventilation schedule 19:00-07:00 | Pitched roof - State of the art - Heavyweight | Timber frame wall domestic (insulated to 1995 regs) | Sgl Gris 6 mm |
| Pitched roof - Uninsulated - Heavyweight | Uninsulated brick/ block wall | Sgl LoE (e2=2) Clr 3mm | |
| Pitched roof - Uninsulated - Lightweight | Wall - energy code standard - medium weight | Dbl Bronce 6 mm/ 6mm air | |
| Pitched roof - Uninsulated - Medium weight | Wall - state of the art Medium weight | ||
| Project pitched roof | Wall - uninsulated - medium weight |
Sensitivity analysis identifies how the uncertainty in an output variable relates to the input parameters, indicating which input variables most influence the simulation results. Four input parameters were selected: external window operating hours, outer wall construction material, pitched roof construction material, and window glazing type. The ASHRAE 55 adaptive comfort model with 80% acceptability was selected as the key performance indicator for the output variable. Regression and random sampling methods were used for this sensitivity analysis. The standardized regression coefficient (SCR), on the other hand, generates the sensitivity of each input variable, thus identifying the most and least important variables. In addition, other linear regression data such as the “adjusted R-squared” and the “p-value” help determine the level of confidence and reliability of the results (DesignBuilder, n.d.).
Active mode
The parametric analysis was performed for March under an active design criterion, i.e., air conditioning. The most efficient options for electrical energy consumption for air conditioning were identified through parameters such as roof type, insulation level, and thermal mass of walls.
Results analysis
Microclimate natural ventilation potential assessment
The highest air temperature values are recorded at 15:00. In March, the maximum temperature of 36.46°C was recorded (Figure 9a). These high temperatures in the afternoon are due to the solar radiation that causes the heating of the surfaces and the air near them, depending on the material that constitutes it (Guía de construcción sostenible para el ahorro de energía en edificaciones, 2016). The albedo of the materials, i.e., the fraction of reflected radiation concerning incident radiation, is another characteristic responsible for this energy exchange process. Most of the materials used in the buildings of the Casco Antiguo are opaque, and surfaces with high emissivity (e.g., cobblestones, concrete, tiles) predominate.
At 15:00, there is also a noticeable drop in relative humidity. This is due to impermeable surfaces, solar radiation, and high air temperature. A minimum of 38.69% is recorded in March, considered the driest month (Figure 9b).
On the other hand, the layout of the streets causes predominant winds parallel to the streets. As a result, it presents a channeling effect, as shown in figure 9c. This channeling effect in the streets causes prevailing velocities in the road co-rounds up to a maximum of 2.63 m/s for this specific case. In addition, the streets perpendicular to the wind experienced the barrier effect on the windward side and the mat effect on the leeward side, registering minimum flows.
The maximum mean radiant temperature value of 74.70°C corresponds to March; see figure 9d. It is important to note that even the mustard-colored shaded areas maintain a high mean radiant temperature. With the arboreal vegetation, there was a slight decrease in the mean radiant temperature under the trees; a value of about 1 °C was observed, attributed to the site's extensive impervious cover.
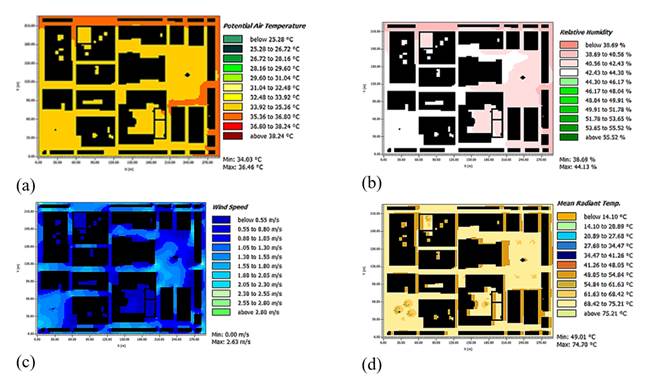
Figure 9: Microclimate results: (a) Air temperature, (b) Relative humidity, (c) Wind speed, and (d) Mean radiant temperature.
The air temperature and relative humidity obtained through simulation in the ENVI-met software establish how the outdoor climate presents favorable conditions for natural ventilation. For calculating the NVCP, temperature and relative humidity limits were taken, as shown in section 4.2, resulting in an annual range of 22.74 °C (June) - 30.87 °C (March) and 30% - 70% relative humidity. In table 4, the comfort temperature calculated for each month, the upper and lower temperature thresholds, and the hours of natural ventilation climate potential NVCP indicator (%) are presented.
Table 4: Monthly upper and lower temperature ranges and natural ventilation climatic potential hours.
| Months | Optimal Comfort Temperature, Tcomf | Lower Indoor Temperature, Tind, lower | Upper indoor temperature, Tind, upper | Hours | NVCP (%) |
|---|---|---|---|---|---|
| January | 26.47 | 22.97 | 29.97 | 155 | 20.83 |
| February | 26.81 | 23.31 | 30.31 | 168 | 25.00 |
| March | 27.37 | 23.87 | 30.87 | 248 | 33.33 |
| April | 26.96 | 23.46 | 30.46 | 180 | 25.00 |
| May | 26.97 | 23.47 | 30.47 | 93 | 12.50 |
| June | 26.24 | 22.74 | 29.74 | 90 | 12.50 |
| July | 26.61 | 23.11 | 30.11 | 93 | 12.50 |
| August | 26.90 | 23.40 | 30.40 | 155 | 20.83 |
| September | 26.61 | 23.11 | 30.11 | 150 | 20.83 |
| October | 26.61 | 23.11 | 30.11 | 124 | 16.67 |
| November | 26.64 | 23.14 | 30.14 | 120 | 16.67 |
| December | 27.00 | 23.50 | 30.50 | 124 | 16.67 |
| Annual | - | - | - | 1700 | 19.41 |
The NVCP results show how the microclimate generated in a built space can significantly affect the natural ventilation potential. The higher the NVCP value, the higher the climatic potential for natural ventilation.
The highest value of NVCP occurred in March because the indicator instructions point to air temperature and relative humidity as input parameters. In other words, although March has the year’s highest temperatures, it shows more hours of ventilation potential because it is the month with the lowest relative humidity.
The annual NVCP indicates that 19.41% of the year, there are adequate microclimatic conditions that allow the use of natural ventilation. This is a low percentage since the recommended percentage, according to Causone (2015) is 47% when natural ventilation can ideally be used 47% of the time during the year.
It is important to note that Panama has a warm, humid climate. Therefore, microclimatic parameters in an urban sector (such as unfavorable wind directions, high temperature, and relative humidity), urban morphological factors (such as high building density, unfavorable H/W ratio, urban obstructions, inadequate orientation and geometry of buildings), scarcity of vegetation, and the general urban design of the site, can affect the number of hours in which natural ventilation can be used as a passive cooling strategy.
Comfort and energy performance assessment
A quantitative index representing the correlation between NVSH and NVCP is shown in table 5. These results implied that, although the potential of natural ventilation was significantly influenced by the external microclimate (NVCP), the effects of internal building characteristics, such as design, on the internal heat gains and envelope thermal performance are factors that must be considered and cannot be underestimated when natural ventilation is to be used as a passive technique.
Table 5: Natural ventilation satisfied hours (NSVH).
| Months | Hours | NVSH (%) | h*/h** (%) |
|---|---|---|---|
| February | 28 | 4.17 | 16.67 |
| October | 124 | 16.67 | 100 |
| November | 120 | 16.67 | 100 |
| Annual | 272 | 3.11 | 16 |
* Hours from NVSH indicator for the three months. ** Hours from PCVN indicator for the three months.
The NVSH confirms the thermal unconformity recorded inside the buildings according to the operating temperature resulting from the dynamic simulations performed in passive mode. However, the evaluation of the NVSH indicator could only be performed for three months because they were within the allowable operating temperature range, yielding percentages that are considered very low (Causone, 2015).
Table 6 presents the monthly critical day consumption using standard meteorological and microclimatic data. The annual consumption recorded using the microclimatic data is higher (149646 kWh) than that of the standard meteorological data (143536 kWh).
Table 6: Energy consumption indicator (ECI).
| Months | Monthly critical day consumption Standard weather data (kWh) | Monthly critical day consumption Microclimatic weather data (kWh) | Percentage Difference, (%) |
| January | 13382 | 13503 | 0.90 |
| February | 12577 | 13547 | 7.72 |
| March | 9597 | 10537 | 9.79 |
| April | 13256 | 13578 | 2.43 |
| May | 14051 | 14438 | 2.75 |
| June | 9628 | 10106 | 4.96 |
| July | 11756 | 11272 | 4.12 |
| August | 13384 | 13992 | 4.54 |
| September | 9961 | 10280 | 3.20 |
| October | 9793 | 10457 | 6.78 |
| November | 12934 | 14032 | 8.49 |
| December | 13217 | 13904 | 5.20 |
| Annual | 143536 | 149646 | 4.26 |
Figure 10 compares the resulting electricity consumption using standard meteorological data (light blue) and microclimatic data (dark blue). The highest electricity consumption coincides with the month whose operating temperature resulted in the highest values.
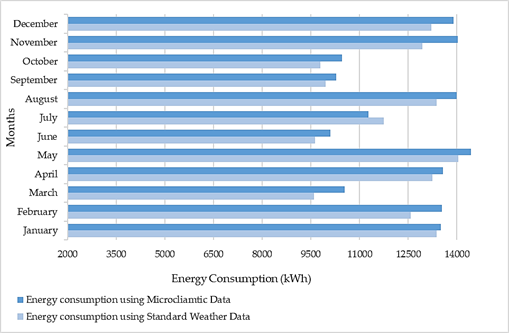
The results show a significant difference for each month, where the highest percentage difference is 9.79% (940 kWh), corresponding to March. The lowest is 0.90% (121 kWh), corresponding to January, which is important in energy consumption and costs. This indicates that the differences are due to the use of air conditioning. However, the difference between electricity consumption does not seem to follow a clear trend since a considerable variation by month is found, even if the internal heat gains due to occupancy, lighting, and equipment were kept the same for each case (under standard microclimatic and meteorological data).
In addition, given that the resulting electricity consumption is higher when using microclimatic data, with an average percentage difference of 5.07%, this sets an important precedent for future energy simulation in this case study, when high accuracy is required. Finally, it is important to highlight that the type of urban area studied, in this case, is not typical of the other urban spaces in Panama City. Therefore, it may be necessary to perform a similar study for other areas.
Assessment of passive strategies to improve building performance
In table 7, the standardized regression coefficient (SRC) indicates the relative sensitivity of the input variables to the output. Its absolute value ranks them in order of sensitivity and importance. The sign represents whether the relationship with the output is direct or inverse. For example, the glazing type strongly influences the adaptive comfort model’s output variable. It is directly related since increased glazing leads to an increase in the adaptive comfort model. This can be explained by the fact that an increase in glazing decreases the solar gains through the windows. In addition, the adaptive comfort model is strongly influenced by the operating hours of the external windows; however, it presents an inverse relationship. Furthermore, it was moderately influenced by the construction material of the roof and external walls.
Table 7: Sensitivity analysis results in passive mode for Adaptive Comfort ASHRAE 55 - 80% acceptability.
| R 2 =0.10 | Standardized regression coefficient, (SRC) | “p-value” |
|---|---|---|
| Glazing type | 0.28 | 0.00 |
| External window operation schedule | -0.22 | 0.03 |
| Pitched roof construction | -0.05 | 0.60 |
| External wall construction | 0.05 | 0.61 |
The “p-value” in the green color represents high importance, while those in red are irrelevant. This indicates that, in passive mode, the most significant parameters are window glazing and window operating hours.
The value of “R2” is 0.10, considered low, indicating that the actual input variables cannot usefully explain the uncertainty in the output. However, the relationship of each variable to the output variable may be relevant. On the other hand, a “p-value” higher than 0.05 indicates that there is a low level of confidence in their results, such as the case for the variables of pitched roof construction (0.60) and external wall construction (0.61).
On the other hand, it was found that the recorded minimum range of hours without comfort was 488.8 - 489.7. Thus, the month of March has 527 hours of total occupancy, which means that, in passive mode, about 93% of the time, there are no comfortable conditions inside the buildings.
Passive mode
The analysis shows that roofs with different insulation and thermal mass levels and window operation schedules do not generate significant changes in the hours of non-comfort (Figure 11). The average value recorded was 495 hours; taking as a reference the 527 hours of total occupancy in March results that 94% of the occupancy time remains in non-comfort conditions. Also, it can be observed the non-comfort hours when applying the different types of glazing for the four window operation schedules. Therefore, the optimal combination is the Bronze 6 mm material with a 24/7 window operation schedule.
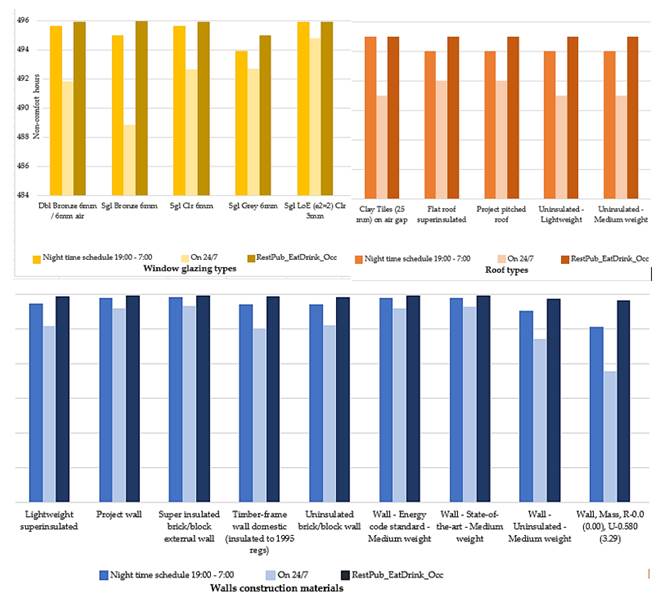
Figure 11: Discomfort hours resulting from using different window glazing, wall construction, and roof types in passive mode.
Active mode
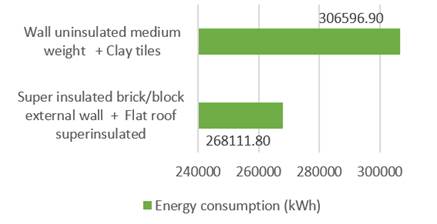
Moreover, another parametric analysis was performed in active mode. The results showed that the combination of uninsulated medium-weight wall and clay tiles roof (current materials) has one of the highest average electricity consumptions for March out of the eight defined combinations.
However, the superinsulated brick/block external wall and flat roof superinsulated combination present the lowest electrical consumption. Therefore, according to the performance and design objective, this is a good combination of variables.
The variation of materials concerning power consumption is significant. It is shown that the material of the walls and roof is a critical parameter and that replacing it with a superinsulated and low thermal mass material has a significant effect on the electrical consumption for air conditioning, resulting in a percentage difference of 12.6%, which translates into a decrease of 38485.10 kWh in consumption for air conditioning (Figure 12).
Discussion
The results can be analyzed from two perspectives: passive and active modes. The microclimate and its natural ventilation potential are evaluated in the passive mode through the NVCP indicator. The indoor thermal comfort of the buildings is analyzed through the NVSH indicator. On the other hand, in the active mode, the electricity consumption for air conditioning is compared through the ECI indicator using standard meteorological and microclimatic data. With both techniques (passive mode and active mode), optimization methods were applied based on sensitivity analysis and parametric studies considering input variables (envelope materials, glazing, and window operating hours) and the output variable (hours of non-comfort according to the ASHRAE 55 adaptive model - 80% acceptability).
The result of the NVCP (Table 4) indicates that 19.41% of the year, under air temperature and relative humidity conditions, an outdoor climate (microclimate) favorable for natural ventilation is present. However, according to the one recommended (Causone, 2015), it is a meager percentage. Similarly, this percentage can be justified to some extent by the annual thermal behavior of the climate (Padilla, 2016), which indicates that 71% of the annual hours in Casco Antiguo would require cooling. It is important to mention that Panama has a tropical climate with high temperatures and humidity. Therefore, this could be one of the main reasons that affect the hours in which natural ventilation (according to the indicator's input parameters) is technically favorable as a passive cooling strategy.
The satisfying hours of natural ventilation (NVSH) could only be evaluated for February, October, and November (Table 5), because they were the months within the allowable operating temperature range, according to the ANSI/ASHRAE 55 standard as the thermal comfort range for naturally conditioned areas. This indicates that the rest of the months presented non-comfort conditions during the occupancy period of the buildings. Thus, the annual NVSH was 3.11%, thus confirming the thermal discomfort from the outdoor and indoor operating temperature results from the dynamic simulations. The microclimate around the buildings shows that natural ventilation does not favor indoor thermal comfort, although the wind enters the buildings. Comparing electricity consumption results when implementing the standard meteorological data and the microclimatic data, it can be observed that higher consumption values are recorded using the microclimatic data. This can be justified because the climatic conditions of the built space are affected by environmental variables (relative humidity, wind speed and direction, air temperature, solar radiation) and urban morphological factors (building density, construction materials, orientation and geometry of buildings, H/W ratio, vegetation) that affect the indoor thermal comfort of buildings, which leads users to opt for air conditioning systems, thus increasing electricity consumption. The results (Figure 10) show that the most significant percentage difference was 9.79%, equivalent to 940 kWh corresponding to March, and the lowest was 0.90%, equivalent to 121 kWh corresponding to January. These values are essential in terms of energy consumption and costs.
Regarding the optimization process, the passive mode uncertainty analysis indicates that the minimum hours out of comfort conditions, based on the ASHRAE 55 adaptive model (80% acceptability), are 488.8; this is a very high value when compared to the 527 hours of total occupancy for March. Furthermore, the sensitivity analysis (Table 7) indicates that glazing and window operating hours are the variables that most influence the hours without comfort. At the same time, roof materials and external walls are parameters that do not generate significant changes.
The parametric study in passive mode (Figure 11) shows that roofs with different insulation and thermal mass record values vary between 491 and 495 hours. The same occurs when applying different construction materials to the external walls. As a result, the hours outside the comfort conditions vary between 492 and 496. Although the glazing type is one of the variables that reduce the number of thermal discomfort hours compared to that of the others (roof materials and external walls), its minimum value recorded was 488.8, indicating that it is still a parameter that does not reflect significant changes since the reduction is only 6%. This means that 92.75% of the occupancy time remains outside the comfort conditions under a passive design criterion.
On the other hand, the parametric study in active mode reflects essential changes in envelope materials concerning electricity consumption. For example, combining a superinsulated exterior wall and a superinsulated roof generates a difference of 12.6%, equivalent to decreasing 38485.10 kWh in electricity consumption for air conditioning.
Although materials recommended by bioclimatic (uninsulated envelopes and low thermal mass) were considered within the design options, they did not generate improvements concerning the hours of thermal discomfort in passive mode. The literature indicates that such recommendations are sufficient for individual and remote buildings; however, there were no favorable results when applied in an urban area, such as this case study. This could be attributed to the proximity between buildings since the urban construction design of the Casco Antiguo consists of minimal or almost no distance between buildings, forming compact building blocks.
This study is the starting point for future experimental research by evaluating the natural resource potential and its energy use using dynamic simulation. It can be applied to implementing this passive technique in urban scale buildings in the country.
Conclusions
The natural ventilation potential of the Casco Antiguo urban area was evaluated using the NVCP indicator. A methodology based on dynamic energy simulations using ENVI-met and DesignBuilder software was used to evaluate the indoor thermal comfort of the buildings. The adaptive comfort model ASHRAE 55 with 80% acceptability was used through the NVSH indicator to evaluate the satisfied hours of natural ventilation. The main findings of the study can be summarized as follows:
The potential to use natural ventilation to maintain indoor thermal comfort is significantly altered by the microclimate of the built space and outdoor conditions. The NVCP result indicates that 19.41% of the year, under air temperature and relative humidity conditions, a favorable climate for natural ventilation is considered low.
The indoor operating temperature was higher than the upper thermal comfort threshold (set by the NVSH indicator) during most periods in passive mode. The annual NVSH was 3.11%, which indicates that most months present non-comfort conditions during the building occupancy and thus confirms the thermal discomfort evidenced from the results of the dynamic simulations. This indicates that the indoor thermal comfort requirements could only be met by active air conditioning techniques (air conditioning + mechanical ventilation) throughout the year.
When implementing the standard meteorological and microclimatic data, the electricity consumption results showed a significant difference of 9.79%, equivalent to 940 kWh corresponding to March, and the lowest of 0.90%, equivalent to 121 kWh corresponding to January. These values are important in terms of energy consumption and costs.
The optimization process showed that the envelope materials do not generate significant changes concerning the hours of thermal discomfort in passive mode. However, energy use in active mode was reflected by implementing superinsulated walls and ceilings; a difference of 12.6%, equivalent to decreasing 38485.10 kWh in electricity consumption for air conditioning, was the result of the simulation. It was possible to demonstrate an energy use due to the characteristics of the envelopes but not due to the implementation of natural ventilation as a passive air conditioning technique.
The results show that natural ventilation is insufficient to guarantee thermal comfort inside the buildings for this case study. The high microclimate temperature causes higher outdoor heat gains. The spatial distribution of air temperature is related to wind direction and solar radiation. The building design forming compact building blocks and leaving no space between them should be a focal point. A study based on the various spatial distribution of a set of buildings is required to analyze the relationship between the location of the buildings and the wind in an outdoor environment. By doing so, the formation of ventilation corridors that favor airflow would be evaluated, thus preventing the structures from causing the barrier effect, as evidenced in the results. Proper hyperdynamic layout and variation of building heights could allow for wind insertion into facades and buildings. Applying these modifications to the case study would be difficult because it is an area considered a historical heritage of humanity and is protected by UNESCO. However, these recommendations can be taken as a reference and applied in the design stage of new projects.
Methods to mitigate thermal stresses caused by solar radiation should be considered, including urban planning and alternative construction materials for buildings and pavements. Tree vegetation and bodies of water in urban areas can positively impact the outdoor microclimate. In addition, the planning, length, spacing, and shape of buildings should be reasonably allocated.
This study considered only the urban area of Casco Antiguo, being a different area from the rest of Panama City due to its construction design. Therefore, it is necessary to conduct further research to analyze the variation of natural ventilation potential in the rest of the country. Likewise, since this study is based on dynamic simulations through computational tools and methods used in the literature, further validation studies based on experimental tests with outdoor and indoor field measurements are required to compare the results.
The findings and the simulation approach presented are expected to help urban planners, architects, and engineers in Panama quantify the potential for using natural ventilation in different country areas. Besides, it is expected to be used as a reference guide to make observations on the climate for executing architectural and urban design projects to allow optimal natural ventilation in Panama buildings.
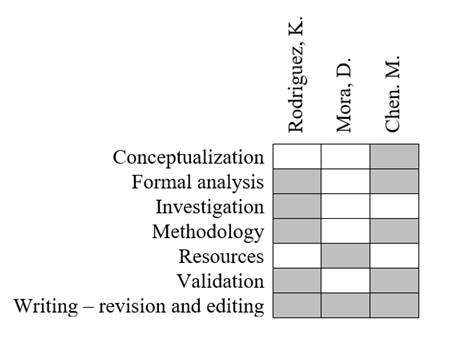
Authors’ contributions
Following the internationally established taxonomy for assigning credits to authors of scientific articles (https://casrai.org/credit/). Authors declare their contributions in the following matrix:
Conflicts of Interest
The funders had no role in the study's design in collecting, analyzing, or interpreting data in the writing of the manuscript or in the decision to publish the results.
Acknowledgment
The authors would like to thank the Technological University of Panama and the Faculty of Mechanical Engineering for their collaboration, together with the Research Group Energética y Confort en Edificaciones Bioclimáticas (ECEB) https://eceb.utp.ac.pa/. This research was funded by the Panamanian Institution Secretaría Nacional de Ciencia, Tecnología e Innovación (SENACYT) https://www.senacyt.gob.pa/ , under the project code FID18-056, as well as supported by the Sistema Nacional de Investigación (SNI).

