


 Espanhol (pdf)
 Artigo em XML
 Referências do artigo
 Enviar este artigo por email
 Citado por SciELO
  Similares em
SciELO
Similares em
SciELO 
 Permalink
1 Introduction
Monitoring heavy metals in the environment and biological samples is of utmost importance for evaluating and preserving the environment and public health quality levels.
One of the best ways of performing this monitoring is through sensitive and fast response sensors used in situ. Sensors with these characteristics provide real-time results useful to establish reference locations needed to follow the contaminants' behavior as a function of location and time. This type of study is increasingly necessary because heavy metals concentration in the environment keeps growing due to the larger augment in global anthropogenic activities. Consequently, more and more heavy metals get into the environment and, through the food chain, into the human organism (Karri et al., 2016). Among the contaminants, Cd(II) and Pb(II) are the ones that could be most dangerous to human health (Wan et al., 2010).
Cadmium could get into the human organism via inhalation or by food or drink ingestion. It could act as a cancer promoter by altering the regular genetic expression, inhibiting DNA reconversion, and inducing oxidative stress (Singh et al., 2009; Lin et al., 2016). The lead could get into the human organism similarly, as Cd does. Lead, as a contaminant, among other effects, could supplant calcium in proteins causing protein malfunctioning and thus impairing physiological functions (Zhang et al., 2015). Since Cd and Pb appear not to have known natural biological functions, the presence of these elements in the human body, at any concentration level, must be due to contamination. Institutions such as the Center for Disease Control (CDC), International Agency for Cancer Research (IACR), and World Health Organization (WHO) have dictated maximum concentration limits permitted for these metals, including Cd and Pb, in food, drinks, biological and environmental samples (Gumpu et al.,2015). Cd and Pb concentration levels in non-contaminated geological and environmental samples are usually relatively low, 10 (g L-1. However, those low levels must be accurately known to start a study regarding the extent of a possible contamination process by these two elements as a function of time.
Evaluation of electrochemistry-based techniques together with the best way of preconcentration and isolation of heavy metals for their accurate determination have been the goal of several research studies (Zhu et al., 2006; Liang et al., 2005; Abkenar et al.,2010; Abkenar et al., 2011; Hosseini et al., 2010; Dahaghin et al., 2017a,b; Bagheri et al., 2012; Huang et al.,2014; Huang et al., 2011; Bhatluri et al., 2017). Among the most widely used electrochemistry techniques for Cd and Pb determination, based on their high sensitivity and freedom from matrix effects, anodic re-dissolution voltammetry (ASV) is one of the most convenient.
During the first step of the ASV methodology, the analyte's ions in solution are reduced by electrolysis under reducing potential conditions, by way of which the analyte is separated from most of the sample's matrix freeing its measurement from most matrix effects. The reduced analyte's preconcentration follows this step by its deposition on the working sensor's surface, which increases the detection capacity of the technique. Finally, the analyte is re-dissolved under anodic re-dissolution conditions originating an electrical signal proportional to the analyte's concentration.
Fabrication of an electrode, which could function close to the ideal one for lead and cadmium determination at trace level in complex matrices, has been the objective of many research studies (Xiong et al., 2016). In most cases, mercury and mercury film-based electrodes are selected due to their excellent re-dissolution capacity (Zhu et al., 2004; Lakshmi et al., 2007; Ferreira et al.,2002). However, the presence of a highly toxic element, as in massive mercury sensors, makes them inadequate from the point of view of contamination (Cargnelutti et al., 2006). To further diminishing toxicity, bismuth, a more ecologic element, was chosen instead of mercury as a modifier for the sensor (Pei et al., 2014; Borgo et al., 2015). Based on those findings, we have tried several glassy carbon (G.C.) modified electrodes for the determination of Cd(II) and Pb(II) in human serum and urine samples (Valera et al., 2018).
In the present work, we report on the determination of Cd and Pb in human serum and urine samples using two electrodes, the first one consisting of a G.C. electrode covered by a Nafion (Nf) film doped with HgAg alloyed and the second one by BiAg alloyed.
Experimental
2.1 Reagents
Nafion (5% (w/w)) was purchased from Aldrich; BiNO3.5H2O(98%), cadmium nitrate (99.5%); lead nitrate (99.5%), and hydrogen peroxide (6% (w/w)) were purchased from Merck; silver nitrate, 99.8%, nitric acid (65%), acetic acid (99.8%) and ethanol (99.8%), were purchased from Riedel- de Haën.; potassium hydroxide (87.8%) was purchased from J.T. Baker; sodium hydroxide (98%) was purchased from Eka Nobel; sodium acetate (98%), and dimethylformamide (DMF) were purchased from Sigma. All reagents used were analytical grade reagents or better unless otherwise stated. Aqueous solutions were prepared using distilled/deionized, 18M ( cm-1 Millipore water.
2.2 Instrumental
Electrochemical measurements were carried out using a Princeton Applied Research (PAR), 273A model Galvanostat/Potenciostat, computer-controlled by the 270/250 Research Electrochemistry Software 4.23 from PAR, coupled to a conventional 15 mL three-electrode reaction cell. The modified electrodes in the evaluation were used as working electrodes; Ag/AgCl electrodes were used as a reference, and 0.5 cm diameter platinum wires were the counter electrodes. Scanning electron microscopy (SEM) analyses were performed using a PHENOM PROX tabletop scanning electron microscope. A PARK SYSTEMS equipment (NX10) was used for the ex-situ atomic force microscopy (AFM) studies.
2.3 Deposition of alloyed bimetallic deposits
G.C. electrodes were chosen as substrates for the deposition of the alloyed bimetallic to produce the modified electrodes. As a previous step, the G.C. electrodes were firstly polished using the number 2000 sandpaper and afterward using spreads of aluminum oxide powder, with decreasing particle size 1.0 µm, 0.3 µm, and 0.05 µm, on a billiard tablecloth. After polishing, the G.C. electrode was submerged in an ultrasonic bath containing distilled/deionized water for 5 minutes to eliminate any aluminum oxide particle loosely adhered to the glassy carbon. Five microliters of a 1% Nf solution were cast on the G.C. electrode using a micropipette. Immediately, 3 µL of pure DMF was added with a micropipette. Ethanol and DMF used as solvents were evaporated by heating at 30oC with an air gun and rotating the electrode at 50 rpm.
After this treatment, the electrode, already covered with an Nf film, was submerged in an aqueous solution having either 85% Ag and 15% Hg or 85% Ag and 15% Bi for 3 hours. Afterward, the electrode was carefully washed with distilled/deionized water to remove non-absorbed material. Finally, the metallic ions trapped in the Nf net are reduced by submitting the electrode to Coulombimetry at controlled potential (CPC) at -1.2 V for 300 seconds in a 1mol L-1 KNO3+ 0.1 mol L-1 HNO3 solution.
2.4 Sample recollection and treatment
2.4.1 Blood
A modified method according (Valera et al., 2018). Professional nurses collected blood samples directly into new "Vacutainer" tubes containing EDTA as an anticoagulant. After gentle shaking to promote contact with de EDTA solution, the samples were refrigerated until taken for analysis. For analysis, blood samples were centrifuged at 3000 rpm for 15 minutes to separate serum from the rest of the sample. Two milliliters of serum were diluted with 15 mL distilled/deionized water under gentle shaking and 8 mL conc. Nitric acid was added, and the sample was left shaking for 5 minutes to initiate digestion. After this time, 1 mL of a 30 % hydrogen peroxide solution was added. The samples were ultrasonicated for 30 minutes at 60 °C, then diluted to 25 mL with distilled/deionized water, which renders them ready for analysis.
2.4.2 Urine
A modified method according (Valera et al., 2018). Urine samples were collected by donors in virgin urine collection vessels. Donors were informed about the study and instructed on the best way of avoiding contamination during collection. Samples were immediately acidified with 2 mL conc. Nitric acid to avoid metal hydrolysis and microorganism growth and refrigerated until taken for digestion. Digestion was initiated on 10 mL of filtered samples (Whatman N° 1" filter paper) by adding 1 mL conc. Nitric acid plus 1 mL of a 30% hydrogen peroxide solution. Samples were then left under gentle shaking for 5 minutes and ultrasonicated for 30 min. at 60°C. Finally, samples were diluted to 25 mL with distilled/deionized water rendering them ready for analysis.
2.5 Determination of Cd (II) and Pb (II) by Anodic Stripping Voltammetry
For the preconcentration step, a 15 mL of a 0.1 mol L-1, pH 4.5, acetate buffer solution, and precisely known volumes of Cd(II) and Pb(II) standard solutions were added to a three-electrode conventional cell. The cell was then purged with an argon flow (20 mL min-1) for 5 minutes, and a -1.2 V potential was applied for 120 s, with continuous agitation followed by a 10 s period with no agitation.
Differential pulse voltammetry (DPV) scanning at 20 mV s-1 within the range from -650 to -350 mV vs. Ag/AgCl, was used for the re-dissolution step. After each concentration/re-dissolution cycle, the electrode's Cleaning was achieved by applying a -200 V vs. Ag/AgCl potential for 15 s.
Results and Discussion
3.1 Modified electrodes characterization
Figure 1a shows a micrograph of the Nf film covering the G.C. electrode (Valera et al.,2018), which is the first step in preparing the modified Nf/G.C. electrode. The whole Nf film seems flat in the figure, presenting some holes, approximately 900 to 950 nm in diameter, seen as dark spots.
Figure 1b shows a micrograph of the resulting AgBiNf/G.C. electrode's surface, obtained after 180 min (Valera et al.,2018). Immersion of the Nf covered the G.C. electrode in a 0.85 µg L-1 Ag + 0.15 µg L-1 Bi solution. SEM images allow for appreciation of metallic particles, white spots inside the Nf film. Particles with an approximate particle diameter of 150 nm were obtained.
The images of the surfaces after individual immersion for 180 minutes of G.C. electrodes in an Ag-Hg solution to produce the AgHgNf/G.C. electrode are shown in figure 1c (Valera et al., 2018).
Although the particle size of the AgBi alloys seems to be smaller ((150 nm) than the particle size of the AgHg ((200 nm), the latter shows a more dispersed distribution. AFM images are shown in figure 2. These images suggest that the Nf film completely covers the G.C. electrode (figure 2a). After deposition of the bimetallic particles, the images suggest that the particles are three-dimensionally dispersed throughout the polymer film, figure 2b (Valera et al., 2018).
3.2 Nafion film thickness
The simplest way of covering the G.C. electrode with an Nf film is by applying a small volume of an Nf solution to the electrode followed by adding a small volume of DMF to increase the polymeric film's stability (Kefala et al., 2004). Nf film thickness can be controlled by adding to the glassy carbon substrate a given volume of solutions containing different Nf concentrations.
We added fixed volumes of solutions containing Nf concentrations of 1% (w/v). Assuming a uniform distribution of the Nf solution on the glassy carbon electrode's surface (as indicated by the SEM images), film thickness I Na can be calculated, to a first approximation, by the formula I Na = m Na / πR 2 d Na (Valera et al.,2018); where m Na is the mass of Nf deposited on the electrode; d Na is the density of the Nf film (1.58 g cm-3), and R is the radius of the glassy carbon electrode (1.5 mm). With the addition of 5 µL of solutions containing 1.0 % w/v Nf and a volume of DMF of 3 µL, films with thickness 4.47 µm were obtained.
Preconcentration potential
Starting with 120 s preconcentration time, the influence of Cd's preconcentration potential and Pb's re-dissolution were studied in a -0.8 V to -1.3 V potential range.
The results depicted in figure 3a indicate that current peaks increase from -0.9 V to -1.2 V, and peaks start decreasing at -1.2 V. Given these results, -1.2 V was chosen as the optimal re-dissolution potential for best preconcentration of Cd and Pb.
3.4 Pre-concentration time
As preconcentration time plays a significant role in analyte's accumulation, a 1.2 V potential was applied to a 50 µg L-1 de Cd(II) and Pb(II) solution to find out the amount of Cd and Pb accumulated on the AgHgNf/G.C. and the AgBiNf/G.C. electrodes as a function of time accumulation was estimated by measuring the redissolution charge (µC) for each metal (figure 3b). Increasing time from 0 to 300 s resulted in augmented re-dissolution currents, indicating increased amounts of each analyte on the electrode's surface. After 300 s, the current starts to stabilize and keeps its value up to 400 s and even longer times; 120 s was selected as preconcentration time for all measurements.
3.5 Working range and sensitivity
Figure 4a depicts the working curves for the simultaneous re-dissolution of Cd (blue dots) and Pb (orange dots), using the AgBiNf/G.C. electrode. Both analytes behave similarly regarding their current-concentration linear relationship. The lead response is seen to be more sensitive. Linearity is kept from around 10 to 120 µg L-1, being limited by electrode surface saturation. After a 120 s preconcentration time, detection limits calculated based on the 3s criterion measuring blank solutions were 0.78 µg L-1 for Cd(II) and 0.66 µg L-1 for Pb(II), n = 6. Results obtained using the AgHgNf/G.C. electrode are shown in figure 4b. This figure was constructed in the same way as figure 4a using the corresponding current values from the voltammograms shown in the inset. Both analytes respond quite differently at this electrode. Sensitivity for Pb is higher than for Cd; the linear range is the same for both metals, meaning that the process of electrode surface saturation is very similar for both electrodes. After a preconcentration time of 120 s detection limits calculated based on the 3 s criterion measuring blank solutions were 0.17 µg L-1 for Cd(II) and 0.24 µg.L-1 for Pb(II), n = 6
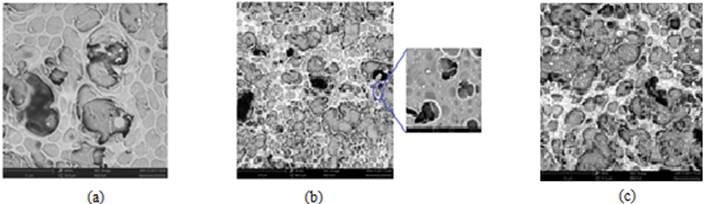
Figure 1: SEM images of the Nf film covering the G.C. electrode and the Nf covered G.C. electrode surface after (a) 60 s. (b) 180 minutes of immersion of the Nf covered G.C. electrode in a 0.85 mg L-1 Ag + 0.15 mg L -1 Bi solution and then reducing the metallic ions trapped in the Nf net by CPC, and (c) After 180 minutes of immersion of the Nf covered G.C. electrode in a 0.85 mg L -1 Ag + 0.15 mg L -1 Hg solution and then reducing the metallic ions trapped in the Nf net by CPC (Valera et al., 2018)
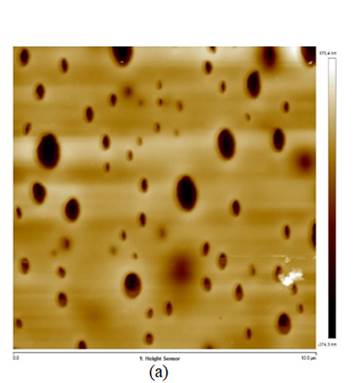
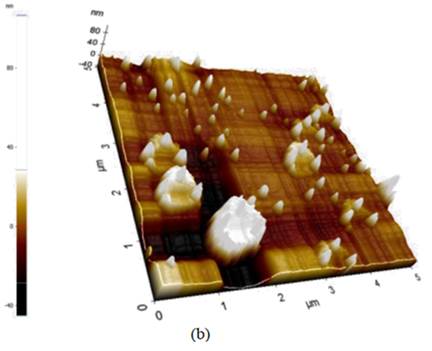
Figure 2: AFM images: (a) High magnification images (scan region 5 mm), showing the thickness of the AgBi nanoparticle. (b) AgBiNpNf on the G.C. substrate; the image shows the three-dimensional arrangement of alloyed nanoparticles, Ag-Bi (Valera et al., 2018).

Figure 3: (a) Effect of the analyte preconcentration potential on the charge. (b) Effect of analyte preconcentration time on determination of 50 mgL-1 Pb (II).

Figure 4: (a) Calibration curves at AgHgNf / CV electrode. (b) Calibration curves at AgBiNf / CV electrode.

3.6 Precision of measurements
After a 120 s preconcentration time from a 40 µg L-1 Cd and Pb solution, twenty consecutive determinations of each metal were carried out, figure 5. Relative standard deviation (RSD) values range from 1.18 to 4.61. These could be considered outstanding RSD values attesting to an exact methodology.
3.7 Determination of Cd and Pb in human blood serum and urine samples
Modified electrodes were applied to Cd and Pb's determination in human blood serum and urine samples collected from donors living in a rural area that was part of a broader environment pollution study. Samples were collected from students of the University (Universidad Simon Bolivar, Caracas-Venezuela), doped with 40 µg L-1 of both Cd(II), and Pb(II), and analyzed following the analytical protocol described in section 2.5.
The ASV methodology's accuracy was checked by calculation of percentages of recovery of the two analytes, expressed as a relative error, R (table 1).
Results in table 1 demonstrate that Pb's determination can be achieved, with recoveries within 96 to 99 % in both types of samples, serum, and urine, using any new electrodes.
This accuracy indicates that these samples' organic matrices do not represent a limitation in Pb's determination. However, this is not the case for the determination of Cd in blood serum samples for which R% was 80% using the AgBiNf/G.C. electrode and even more extensive, 53%, using the AgHgNf/G.C. electrode.
These results show that AgBi alloyed are more convenient for modifying Nafion covered G.C. electrodes destined for analysis of organic samples with complex matrices than the AgHg alloy. Modifying the Nf/G.C. electrodes with AgHg alloyed nanoparticles produces electrodes unsuitable for Cd analysis in blood serum due to their unacceptable inaccuracy. Nonetheless, for urine, a sample with a lighter matrix than blood serum, the AgHgNf/G.C. electrode produces accurate results with recoveries within 92 to 94%.
Table 1: Results
| Analyte | AgBiNf/GC found (µgL-1) | AgHgNf/GC found (µg L-1) | AgBiNf/GC found (µg L-1) | AgHgNf/GC found (µg L-1) | AgBiNf/GC R(%) | AgHgNf/GC R (%) | ||
| Serum | Serum | Urine | Urine | Serum | Urine | Serum | Urine | |
| Cd (II) | 41.16± 4.12 | 29.35 ± 4.43 | 46.23 ± 2.77 | 46.79 ± 2.66 | 80.32 | 92.46 | 52.84 | 93.59 |
| Pb (II) | 48.27 ± 1.94 | 48.69 ± 1.91 | 49.01± 2.15 | 49.48 ± 2.92 | 96.54 | 98.02 | 97.37 | 98.96 |
Conclusion
Results show that the new electrodes could be useful for Pb determination in human serum and urine samples with acceptable accuracy and precision. The new electrodes' ASV technique offers a faster, lower cost, more mobile, and easier to operate alternative. The AgHgNf/G.C. electrode has the advantage of being slightly more sensitive than the AgBiNf/G.C. for Cd and Pb determination, but it is not useful for Cd determination in serum samples due to lack of accuracy. Even though the AgHgNf/G.C. electrode still contains mercury, this amount of mercury is infinitesimally lower than that in a massive Hg sensor so that the electrode can be used with practically no harm to people or the environment.
We believe that improved accuracy and sensitivity in the bimetallic modified electrodes could be due to the metallic couple's synergistic effects.

