


 Español (pdf)
 Articulo en XML
 Referencias del artículo
 Enviar articulo por email
 Citado por SciELO
  Similares en
SciELO
Similares en
SciELO 
 Permalink
Introduction
There is still a huge population in the world not having drinking water while other people have it too much. The water distribution systems (WDS) do not have tools enough to balance the inequitable distribution. Some authors direct their research to the economical approach through tariffs systems proposals (Sahin, Bertone & Beal, 2017; Santopietro et al., 2018). Others Scientists are especially concerned about improving WDS (Tricarico, de Marinis, Gargano & Leopardi, 2007) because the fresh water availability (Rodell et al., 2018) is becoming scarce and the urbanization increases together with the human comfort and the necessity to supply drinking water as well (UNESCO, 2009).
The climatic change also impacts the fresh water availability (Rodell et al., 2018) and consequently affects the drinking water consumption DWC. Since these events seem to be unavoidable, some authors have taken other direction to optimize the DWC. Some reports demonstrate water consumptions rises when the amount of dish washers as well as clothes washing machines increase at home (Morote Seguido, 2017).
Other Authors go further and made quantifications of water use per person in residential buildings (Matos, Teixeira, Duarte & Bentes, 2013). Morote Seguido (2017), made a wide bibliographic review about DWC. He identified the following factors: social, demographic, economical, management, psychological, urban and climatological factors, which affect the DWC. The demographical and climatological incidence was recently quantified by Arellano, Bayas, Meneses & Castillo (2018)
From the demographic approach, the DWC shows different patterns in small, medium and big cities (Arellano et al., 2018). This report keeps the same range of cities sizes and quantifies the DWC per capita, upon the number of sanitary devices at home. Its aim is to provide some lineal models to quantify the DWC by knowing how many sanitary devices there are in a residential house. The SD is easy to identify when designs and building construction need authorization by WDS managers. The models allow managers to set up tariffs or bonds to the users in order to change the water consumption habits. This article contributes to water conservation as well as water management literature.
Methodology
2.1 Cities characteristics
The cities are located in three geographical regions in Ecuador, with different socio economical and climatic characteristics. Arellano et al. ( 2018) reported three groups of cities (small, medium and big), with DWC similarities. This paper analyzes the variables into each group of cities. Cities population were withdrawn from national census reports carried out in 2010 (table 1).
2.2 Samples
Every month the researchers wrote down the water consumption data from residential buildings micrometers. The data had registered m3 consumption with a decimal fraction and converted to liters per month. The fields’ work in 11 cities started in 2013 and finished in 2015 (Carrillo & Quintero, 2013; Montenegro & Tapia, 2014; Morillo & Luna, 2013), (Barreno, 2015; Cáceres & Rubio, 2015; Noriega, 2015; Patiño & Pino, 2014; Sagñay & Carguachi, 2015; Samaniego & Muela, 2015).
The field`s work on each city took six months. The whole field information contained mainly: how many people live in a residential building, how many and which sanitary devices they have. Therefore, we could know how much drinking water per person is consumed and how many sanitary devices per person there are.
Table 1: Cities, population, size and samples.
| Population range | Size | City | Population inhabitants 2010 | Sample records |
|---|---|---|---|---|
| 500 - 8000 | Small | Columbe | 526 | 258 |
| Cubijíes | 588 | 264 | ||
| Guamote | 2648 | 294 | ||
| Chambo | 4459 | 330 | ||
| Quimiag | 5257 | 270 | ||
| Guano | 7758 | 354 | ||
| 8000 - 30000 | medium | Joya Sachas | 11480 | 312 |
| Macas | 18984 | 406 | ||
| Guaranda | 23874 | 678 | ||
| 30000 - 150000 | Big | Ventanas | 38168 | 588 |
| Riobamba | 146324 | 1296 |
2.3 Variables
The DWC expressed as per capita consumption (PCC) (lt/person-day). The primary information shows sanitary, social and economic characteristics from each house sampled. The sanitary devices (SD) are toilet, washbasin, shower, kitchen sink and clothes washing machine (CWM). We call sanitary equipment (SE) to all devices together. The SD and SE area expressed in units per person. Since the people’s habits are rather different, this study includes SD more often used in South American countries. Therefore, the bath as well as dish washer machines were not.
2.4 Data process
The Statistical software R was applied to make a descriptive statistical assessment due to small amount of data.
We applied the simple lineal regression technique to infer data from others. We calculated the Pearson correlation coefficient R to determine a parameter variation with relation to another parameter (SD related CPC or SE related CPC). We also calculated the Spearman determination coefficient R². The R² values are between 0 and 1. The closer to 1, the better the model is. When R² values are higher than 0.6 the relation is significant. When R is between 0.50 and 0.75, the correlation is considerable. When R is between 0.75 and 0.90, the correlation is very strong. When the R is between 0.90 and 1.00, the correlation is perfect (Hernández, Fernández & Baptista, 2006).
A correlation will be statistically significant when p < 0.05. It will be statistically highly significant when p < 0.001 (less than one in a thousand chance of being wrong). When the pattern shown a lineal tendency, the model is:
where the constants m and b are determined by the least square method.
Results and Discussion
3.1 Big cities (30000-150000 inhabitants)
When the analysis is done individually, between each sanitary device and the DWC, there is a perfect correlation between toilet, washbasin, shower and CWM respectively, with PCC values (R² >0.8; p<0.05). There is a strong correlation between kitchen sink and PCC (R² >0.60; p<0.05). The p value so low means it is significant from statistical point of view.
The equations state:
y= monthly average drinking water per capita consumption (liters/ person-day).
x= number of each sanitary device individually (toilet, washbasin, shower, kitchen sink and clothes washing machines) per person (units/person).
These equations could be used to predict the DWC from a residential building by counting the number of a sanitary devices.
When we consider SD as a set, we call it sanitary equipment (SE). The Figure 3 plots SE against drinking water per capita consumtion. The lineal model obtained is considerable and highly significant statitically (Pearson R = 0.6146 y p-valor = 0.001, Table 2). The DWC increases when SD and SE increase. It seems water consumption increases because there is more sanitary device rather than water necessities. Will water demand drop down if people would not have many SD at home? It confirms that water consumption increases as well as the number of sanitary water users increase at home (Morote Seguido, 2017).
In both cases either with sanitary devices individually or as equipment, the models could predict the DWC, in big cities.
Medium cities (8000-30000 inhabitants)
In the medium size cities (Guaranda`s data was removed) the relations between al SD and PCC are considerable (R > 0.5) but they do not have stadistical signficance because their p values are much higher than 5% (table 3). Therefore we did not calculate lineal equations.
Small cities (8000-30000 inhabitants)
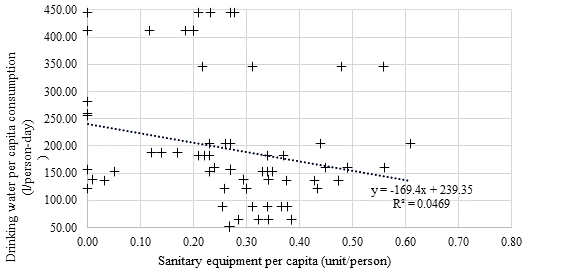
In the cities’ smaller than 8000 people the results are much different than the previous ones. There is not statistical significance between sanitary devices and PCC (p-value is much higher than 5%, table 4) and there is no aceptable correlation (R values are to low). The DWC in small cities does not depend on the number of sanitary devices at all. The correlation between DWC and SE, in small cities, is negative and is not valid from statistical point of view (Pearson R =-0.2166, table 4) although is highly significant (p-valor de 0.0568, figure 5). Perhaps other factors affect the DWC in small cities, thus because the graphic trends are different from big and medium cities.
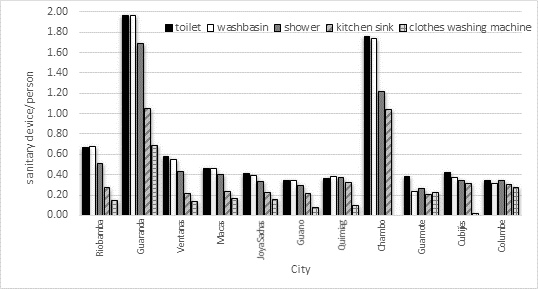
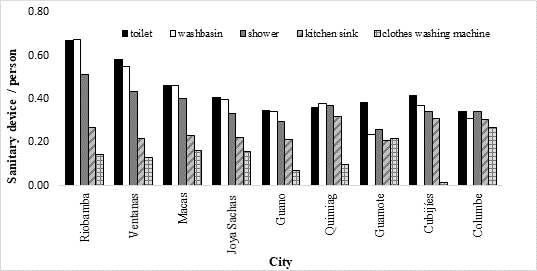
Table 2: Sanitary devices and equipment, versus drinking water per capita consumption in big cities (30000-150000 inhabitants).
| Sanitary device | R 2 | R | p-valor | Equation |
| Toilet | 0,908 | 0,9529 | 0,0003 | y = 165,86x + 101,2 |
| Wash basin | 0,8902 | 0,9435 | 0,0004 | y = 160,23x + 107,65 |
| Shower | 0,8954 | 0,9463 | 0,0004 | y = 221,69x + 100,59 |
| Kitchen sink | 0,6046 | 0,7776 | 0,0231 | y = 621,7x + 53,306 |
| Clothes Washing Machine (CWM) | 0,9573 | 0,9784 | 0,0001 | y = 434,48x + 145,79 |
| Sanitary equipment | 0,3777 | 0,6146 | 0,001 | y = 103,5x + 163,94 |
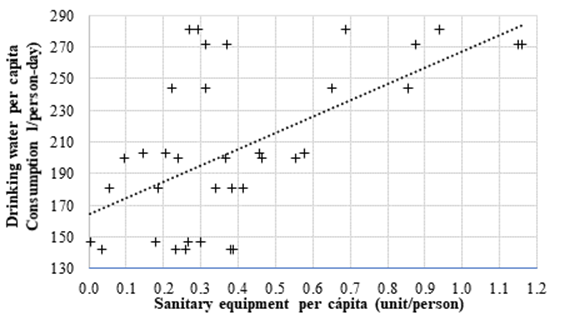
Figure 3: Drinking water consumption and sanitary equipment in big cities (30000-150000 inhabitants).
Table 3: Sanitary devices and equipment, versus drinking water per capita consumption in medium cities (8000-30000 inhabitants).
| Sanitary devices | R 2 | R | p-valor | Equation |
| Toilet | 0,3023 | 0,5498 | 0,2010 | - |
| Washbasin | 0,3093 | 0,5561 | 0,1948 | - |
| Shower | 0,3285 | 0,5731 | 0,1786 | - |
| Kitchen sink | 0,3457 | 0,5880 | 0,1650 | - |
| Clothes Washing Machine | 0,5439 | 0,7375 | 0,0585 | - |
| Sanitary equipment | 0,1862 | 0,4315 | 0,0097 | y = 190,54x + 180,82 |
The researh about water quality, water cost, total inflation, leakings will provide more information about it. Figure 1 shows high peaks in two cities (Guaranda and Chambo).
Applying the box plots to identity the outliers and removing the data from those cities, we obtain figure 2, it diminished the data. However, when the sanitary equipment SE is drawn against the drinking water per capita consumption (figure 4), it yields a medium correlation (R=0.4315; R2= 0.1862) with statistically highly significance (p-value=0.0097).
The DWC could be predicted by counting all sanitary devices and applying the following lineal model. It is valid for residential buildings.
The R value is rather low perhaps due to lack of data.
Where y is the label for monthly average drinking water consumption (l/person-day); and X represents the number of: toilets, washbasins, showers, kitchen sinks and clothes washing machines together (units/person).
Table 4: Sanitary devices and equipment, versus drinking water per capita consumption in small cities (less than 8000 inhabitants).
| Sanitary devices | R 2 | R | p-valor |
| Toilet | 0,0138 | -0,1175 | 0,6768 |
| Wash basin | 0,0043 | -0,0656 | 0,8171 |
| Shower | 0,0439 | -0,2095 | 0,4536 |
| Kitchen sink | 0,2130 | -0,4615 | 0,0833 |
| Clothes Washing Machine | 0,1866 | -0,4320 | 0,0735 |
| Sanitary equipment | 0,0469 | -0,2166 | 0,0568 |
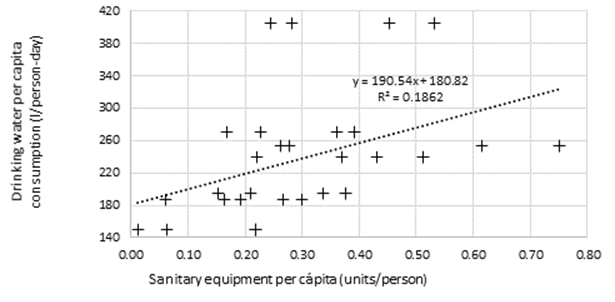
Figure 4: Drinking water consumption and sanitary equipment in medium cities (8000 a 30000 inhabitants).
4 Conclusion
The drinking water consumption (DWC) in medium and big cities, depends directly on the number of sanitary devices (SD). The clothes washing machines (CWM) lineal models seem to give better results than the other devices equations. In big cities, the CWM and DWC got a perfect correlation, with high statistical significance. In medium cities, the same device and DWC model got a considerable correlation with statistical significance. In big cities, the sanitary equipment and DWC model got also a considerable correlation with high statistical significance. In medium cities an unacceptable correlation was got. We can not calculate the DWC in small cities because it has not correlation with SD.
It seems people misuse water when they have too many sanitary devices in medium and big cities. The DWC rises when SD rises too (Morote Seguido, 2017). If we see the other way around, the DWC would diminish if the number of SD would diminish too. This correlation gives a very important contribution to define awareness’ strategies to optimize DWC in Ecuador. The equations yield useful values to fix water tariff in function of SD number in a residential building (Santopietro et al., 2018). The more SD the higher the water tariff. Santopietro mentions the economic value of water recognized by the International Conference on Water and Sustainable Development (ICWE). If it is so, these mathematical models help to calculate the water distribution cost based on the number of SD. Santopietro calculates the WDS rehabilitation cost, but he does not mention about the consumption cost. The WDS managers could apply these models to set up differentiated rates for water consumption. The more sanitary devices at home, the higher the tariff to pay.

