


 Español (pdf)
 Articulo en XML
 Referencias del artículo
 Enviar articulo por email
 Citado por SciELO
  Similares en
SciELO
Similares en
SciELO 
 Permalink
1 Introduction
Micro computed tomography (micro-CT) is a non-destructive technique tool which obtains tri-dimensional images of the sum of bi-dimensional images or slices from a sample (Boerckel et al., 2014). The principle of micro-CT is based on the attenuation of x-rays passing through the object or sample being imaged. As an x-ray passes through the tissue, the intensity of the incident X-ray beam is diminished according to the equation, I 𝑥 = 𝐼 0 𝑒 −𝜇𝑥 , where 𝐼 0 is the intensity of the incident beam, 𝑥 is the distance from the source, 𝐼 𝑥 is the intensity of the beam at distance x from the source, and 𝜇 is the linear attenuation coefficient (Stauber & Müller, 2008).
Conventionally computed tomography (CT) uses the absorption contrast which does not permit some details to be seen in some type of samples due to weak absorption, but phase shifts in the X-ray beam can be applied for obtaining the best image (Bronnikov, 2006a). A significant improvement over conventional attenuation-based X-ray imaging, which lacks contrast in small objects and soft biological tissues, is obtained by introducing phase-contrast imaging (Zhou & Brahme, 2008). The inline phase-contrast X-ray imaging method, sometimes also called the image-based propagation technique (PBI) or the in-line holography process, exploits the Fresnel diffraction and is dubbed the phase-contrast imaging method in microtomography, which is made possible by using third generation synchrotron radiation sources or microfocus X-ray tubes (Bronnikov, 2006a) (Zhou & Brahme, 2008).
Absorption-contrast X-ray imaging serves to visualize the variation in its attenuation within the volume of a given sample, whereas phase contrast allows one to visualize variations in the X-ray refractive index (Gureyev et al., 2009).
In the principle of in-line phase-contrast imaging, the projected images of the computer phantom of the spheres are shown for different positions of the detector along the z-axis. If the phase contrast occurs in the Fresnel diffraction region, it means that it is necessary to place the detector at a certain distance from the source (Bronnikov, 2006a).
The image is edge-enhanced, and for soft tissues, it is possible to retrieve the phase projection from a single in-line image. The phase contrast technique is used for reconstructing the phase coefficient using the retrieved phase projections (Cai, 2009). In the PBI phase of contrast X-ray imaging, the phase contrast effects are due to thick samples, where the contrast effect increases linearly with the sample according to detector distance (Lussani et al., 2015):
High-resolution X-ray produces detailed three-dimensional images of soft tissue and bone structure. In the case of soft tissue, the highest resolutions are achieved with the help of a contrast agent, which increases the X-ray attenuation of the tissue of interest. For this technique, the need for high X-ray doses to obtain the finest resolution precludes scanning of live specimens (Phenogenomics, 2019). The multi-contrast X-ray images of a mouse can be obtained with a conventional X-ray image based on attenuation, the differential phase-contrast image based on X-ray refraction, and dark-field image based on X-ray scattering (Bech et al., 2013).
The reconstruction process transforms the raw acquisition data into a stack of 2D cross-sections through the sample, resulting in a 3D data set. A number of artifact and noise reduction algorithms are integrated to reduce ring artifacts, beam hardening artifacts, COR (center of rotation) misalignment, detector or stage tilt, pixel non-linearities, among others (Zhao et al., 2009).
Phase retrieval is a method permitted the quantitative analysis of images, reconstructing the image phase from the measured intensity of projections, in-line phase-contrast X-ray imaging provides characteristics of images in absorption and refraction (Chen et al., 2013).
Phase retrieval enables us to obtain quantitative information about the sample from phase-contrast images (Mayo et al., 2003a). Microtomography experiments can be performed in the so-called Propagation Based Imaging (PBI) modality by using a sufficiently coherent X-ray beam, such as the one obtained at e.g. third generation synchrotron then, both the amplitude and phase transmitted through the sample can be retrieved from the radiography a quantitative relationship exists between the phase shift induced by the object and the recorded intensity. The inversion of this relationship is called phase retrieval and in PBI this can be performed via digital image processing (Bronnikov, 2006a). Propagation-based imaging requires that the detector is positioned at a sufficient distance from the sample; optical elements are unnecessary between the sample and the detector.
Python is a high-level general purpose programming language because code is automatically compiled to byte code and executed. Python is suitable for use as a scripting language, web application implementation language, etc. Python can be extended in C and C++, and can provide the speed needed for even computer intensive tasks, because of its strong structuring constructs (nested code blocks, functions, classes, modules, and packages) and its consistent use of objects and object-oriented programming (Kuhlman, 2009).
Python has a huge number of Graphical User Interface (GUI) frameworks (or toolkits) available for it, the major cross-platform technologies upon which Python frameworks are based include Gtk, Qt, Tk and wxWidgets, although many other technologies provide actively maintained Python bindings (Simon, 2019). PyQt a Python graphic tool, brings together the Qt C++ cross-platform application framework and the cross-platform interpreted by the Python language. PyQt is a set of Python v2 and v3 multiplatform bindings (Riverbank, 2019).
Python is being widely used to create scripts which cover different necessities in computational scenarios. For example, the Brazilian Synchrotron Light Laboratory successfully developed Python scripts to control beamlines operations, including a case of GUI creation using Tkinter (Beniz & Espindola, 2016).
Python, Qt and some Python libraries: PyQt, PyDM and Py4syn are powerful resources of these modules and Python straightforward coding guarantees flexible user interfaces: it is possible to combine graphical applications with intelligent control procedures (Fedel et al., 2017).
Py4Syn, an open-source Python-based library for data acquisition, device manipulation, scan routines and other helper functions which is driven by easy-to-use and scalability ideals, offers control system agnostic solutions and high customization levels for scans and data output, covering distinct techniques and facilities for synchrotrons (Slepicka et al., 2015).
2 Methodology
2.1 Biomedical Beamline for in vivo and in-vitro experiments
The biomedical beamline, part of the European Synchrotron Radiation Facility (ESRF), located in Grenoble (France), is involved both in diagnostic imaging and therapeutic irradiation for pre-clinical and potentially clinical applications (ESRF, 2019a). In the scan process the object is moved vertically through the beam while the detector type Charge-Couple Device (CCD) camera constantly acquires projection images (Donzelli et al., 2016).
The wiggler in biomedical beamline is a neat way to increase the intensity of synchrotron radiation. It is a periodic arrangement of dipole magnets generating an alternating static magnetic field which deflects the electron beam sinusoidally. The filters are also placed as beam attenuators. They are located between the source and the sample to avoid overheating of the optical elements in the optic hutch (ESRF, 2019b).
2.2 Phanton
The routine preclinical CT calibration phanton (Price et al., 1990) consists of known tissue-mimicking material (King et al., 2011) that are ideally suited for preclinical CT number calibration or for further multiple energy research when using a dedicated image-guided microirradiators (micro-IR) or preclinical in vivo cone-beam CT devices. This routine phantom consists of a validation and calibration phantom as an independent test to determine and assess the accuracy and precision of dual energy computed tomography (DE-CT) material decomposition algorithms (Solutions, 2019a).
2.3 Microtomography Technique
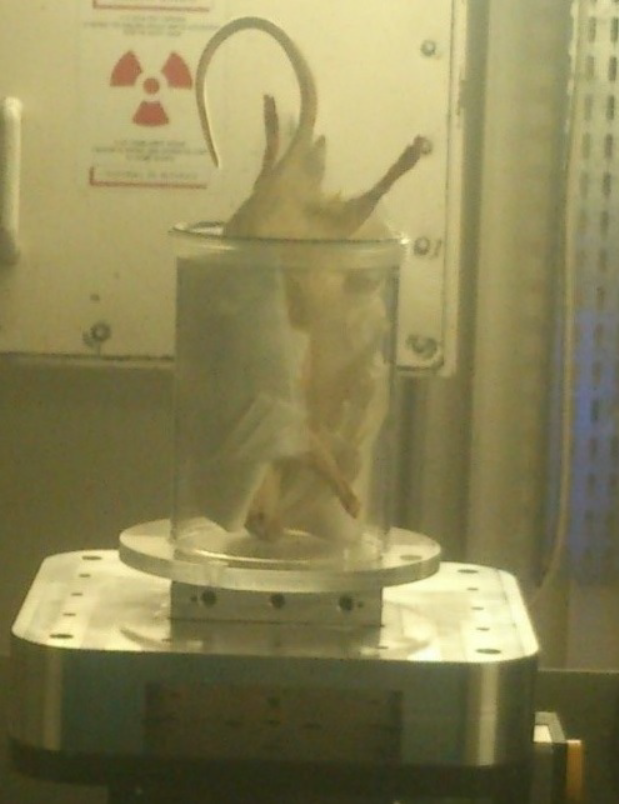
Figure 1 shows the phantom placed on the CT stage during the acquisition, the distance between the detector and the stage was 2.5 m.
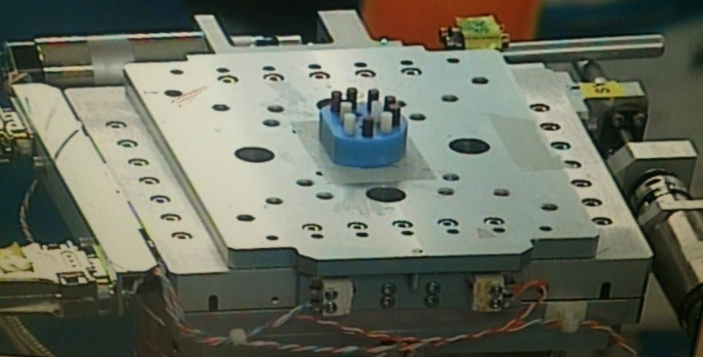
After preparing and aligning the sample stage, two wigglers were set: W 150:55 mm and W 125:65 mm, for each selected energy at 30 keV, two filters (0.8 C + 0.5 Al) were manually introduced to keep the same incoming flux on the object and to reduce the heat load on the optical elements.
2.4 Software Development
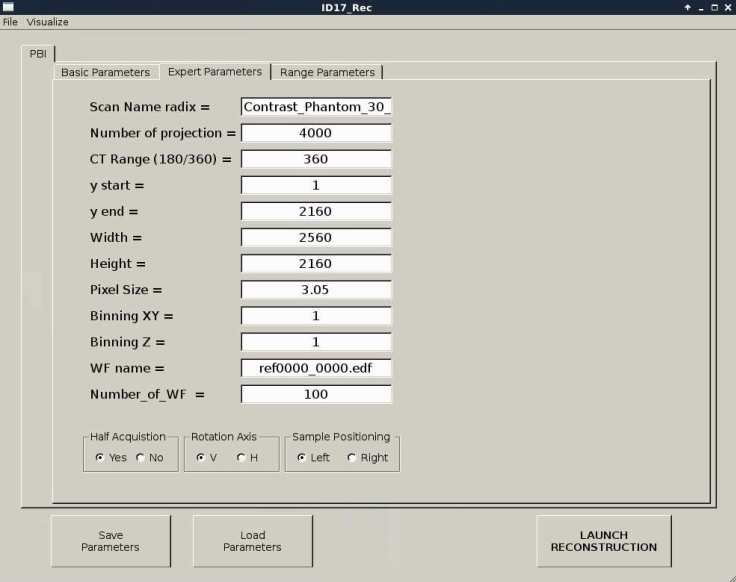
A Graphic User Interface was developed in Python Language for beamline in ESRF (Grenoble − France). It was designed for online image reconstruction during experiments. Autonomous handling of reconstruction software and the specific routines were developed for the specific users. The first step was to structure the present code into different clases and methods, the second step involved the PyQt library for construction the GUI. The main goal of the GUI is to provide a user-friendly multi-technique platform that can be used to handle the data obtained from Propagation-based imaging (PBI) technique.
The program template was linked to the functions grouped into classes in the python code, according to the python code made by scientists of beamline. The template generates a text file, according to the instruction manual.
The tab "Range Parameters" contains the COR RANGE parameter which refers to the center of rotation, this parameter allows linking to the script to reconstruct a single slice of the volume concerned using different centers of rotation in the range generated automatically from reconstruction software. The CT files are saved in the COR folder ( figure 7). The delta-beta range parameter allows linking to the script to reconstruct a single slice of the volume concerned using a different Paganin number in the range (2480-2550). The CT files are saved in the PAG folder. The folder is created automatically (see figure 7).
The GUI allows the following operations: The "Save Parameters" button writes the expert parameters and basic parameters used for reconstruction in a text file. The "Load Parameters" button updates the expert and basic parameters reconstruction from a text file.
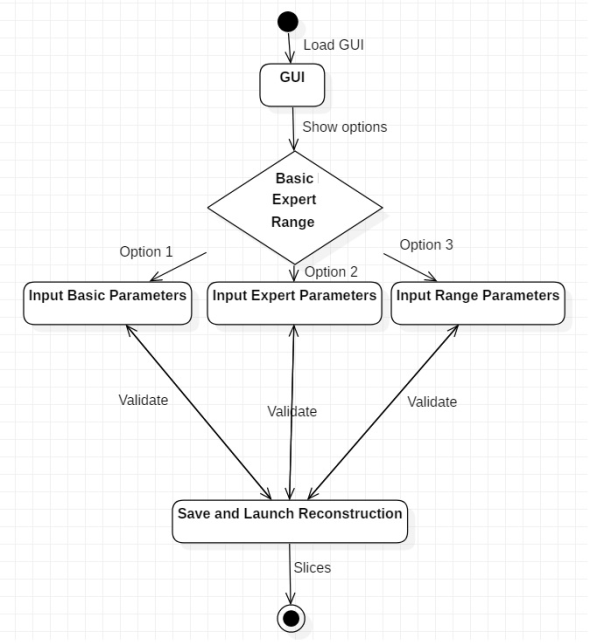
For the development of the GUI the Cascade Model is used, the same one that is used for the development of the application, the development steps are seen downwards (one after the other, in a linear and sequential way); this model is used in the development of applications whose approach considers development times of applications, small or standard systems, cost is a factor that is not considered, and backsliding to the previous phases is not accepted. The phases of the model are: Requirement Analysis, Design, Development and Implementation, Testing and Release (Maintenance) (Pressman, 2010).
2.4.1 Tool for reconstruction and Algorithms
PyHST2 is a tool for reconstruction based on Python language which implements parallel geometry for phasecontrast and absorption tomography; the code implements besides a default filtered back projection reconstruction algorithm (Bronnikov, 2006b), iterative reconstruction techniques with a-priori knowledge to improve the reconstruction quality or reduce the required data volume and reach a given quality goal.
The acquired images were reconstructed using the filtered-back projection algorithm after the application of the single defocused-image Paganin algorithm (Mirone et al., 2013).
2.4.2 Requirements Analysis
The purpose of the needs analysis is to examine the feasibility and importance of the functions. The results of this phase are the specifications that contain the requirements that must be developed; thus, the following requirements were determined: immplement a graphical interface that allows the entry of parameters for image reconstruction, upload data to the interface through an external file, provide an easy-to-use interface,and multitechnical platform that allows the management of the instrumentation for the acquisition of images.
2.4.3 GUI Design
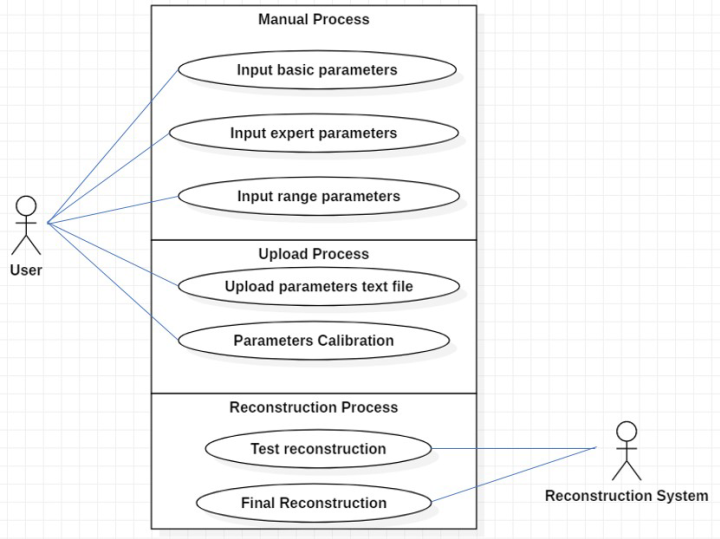
The components of this phase use the diagrams that show the behavior of the system, the instructions on the architecture of the GUI and the applied technologies which are also adjusted, such as: programming languages, use of libraries or libraries, programming techniques and structures of control. So, based on the requirements we have designed some diagrams that describe its operation, behavior, elements, actors, etc. (see figure 2 , figure 3 and figure 4).
System modeling
b) Coding Structure
The image reconstruction code was structured into classes and methods for its call from the GUI using the PyQt tools for the construction of the GUI (see table 1.).
2.4.4 Implementation
The figures 5 and 6 show a part of the structure of programming code for the calibration of the Paganin length.
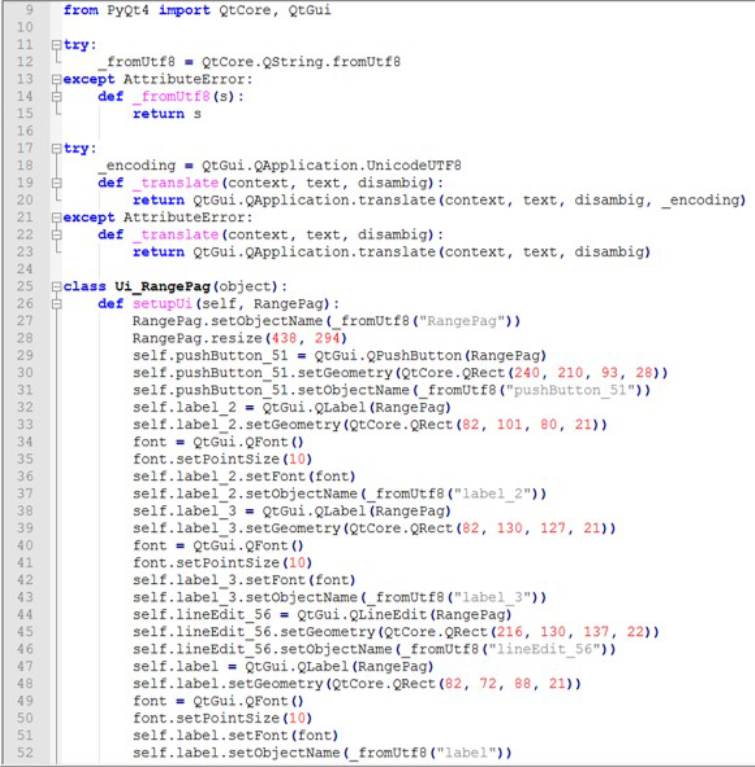
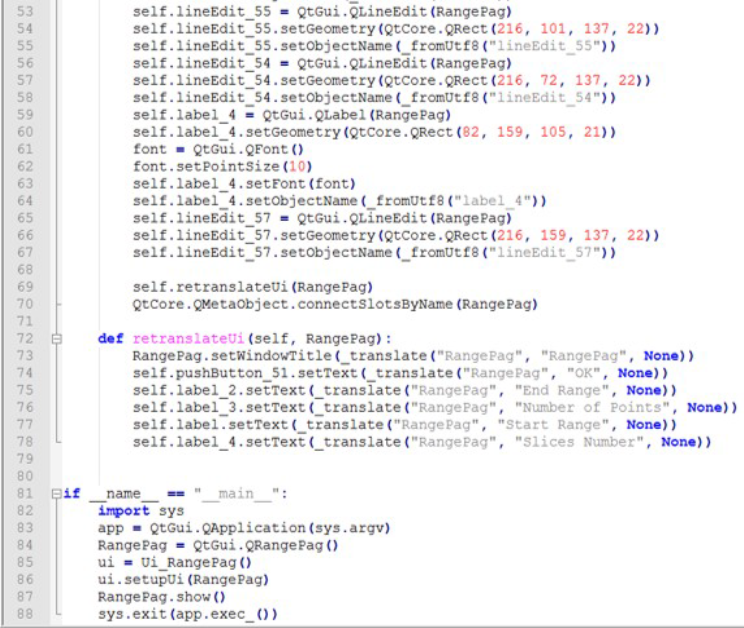
Table 1: Code Structure of Graphical User Interface.
| Classes / Methods / Libraries | Description |
|---|---|
| Library: PyQt4 | Set of Python bindings for Qt cross-platform. |
| Class 1: Calculation | Calc center of rotation. |
| Method 1.1: CalcCenterOfRotation | Calculate center of rotation. |
| Method 1.2: DoSino | Create sinograms |
| Method 1.3: normalization | Make the normalization of projections |
| Class 2: Parameters | Read text file and store the values into a dictionary |
| Method: 2.1: addParameters | Creation parameters for reconstruction |
| Method 2.2: DoParFile | Create text file containing the info about the scan |
| Class 3: Utility | Reconstruction send to the cluster, |
| Method 3.1: DoScript | The reconstruction is submitted to the cluster. |
| Class 4: Ui_RangeCor | Create GUI for calibrate center of rotation |
| Method 4.1: setupUi | Create template for RangeCor |
| Method 4.2: retranslateUi | Calls for the RangeCor class occur. |
| Class 5: Ui_RangePag | Create the GUI for calibrate the Paganin legth |
| Method 5.1: setupUi | Create template for RangePag |
| Method 5.2: retranslateUi | Calls for the RangePag class occur. |
| Class 6: Ui_Basic_Expert | Create the GUI for calibrate the Basic_Expert |
| Method 6.1: setupUi | Create template for Basic_Expert |
| Method 6.2: retranslateUi | Calls for the Basic_Expert class occur. |
2.4.5 Parameters GUI
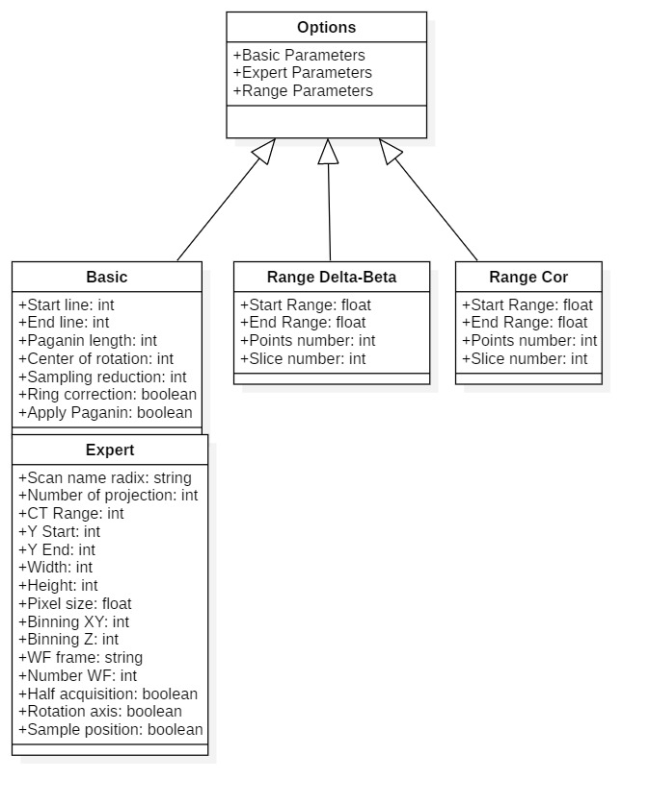
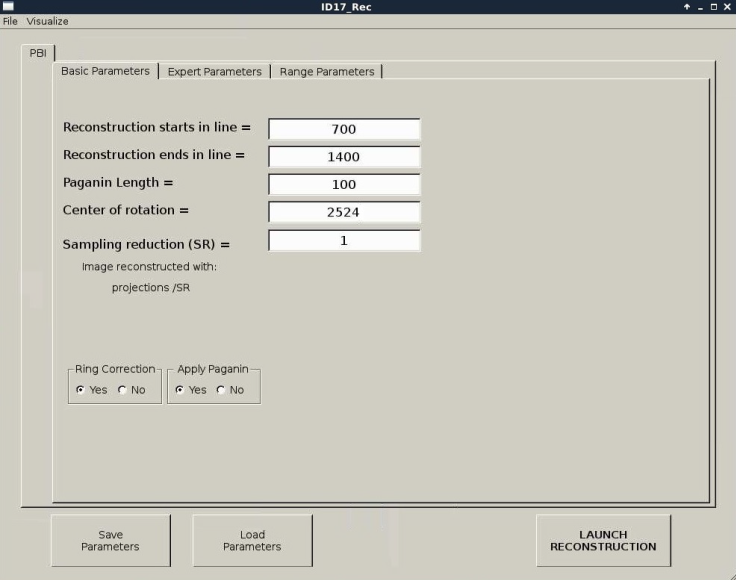
The basic parameters are explained according to figure 4:
- Reconstruction starts in line: indicates the starts in line of reconstruction
- Reconstruction ends in line: indicates the end in line of reconstruction
- Paganin Length: refers to Paganin dimension which input previous reconstruction
- Center of rotation: defines rotation center of reconstruction
- Sampling Reduction (SR), is a practical algorithm based on Random Sampling Reduction (RSR) (Buchmann & Ludwig, 2003).
- Ring Correction (yes/no): refers to PyHST ring correction
- Apply Paganin (yes/no)?: refers to Paganin algorithm
The expert parameters are explained according to figure 5:
- Scan Name radix: corresponds to the radix name of the file without extension.
- Number of projections: corresponds to the effective number of projections acquired
- CT Range (180/360): refers to scan at 180 or 360 degrees
- y start: region of interest (ROI) start
- y end: region of interest (ROI) end
- Width: pixels image width
- Height: pixels image height
- Pixel Size: refers to effective pixel size
- Binning XY: binning in the reconstruction plane (Mohammadi et al., 2014).
- Binning Z: binning along the vertical axis
- WF name: name of one white field file
- Number of WF in the file: number of white fields acquired
- Half Acquisition (yes/no)?: refers to half acquisition
- Sample Positioning (left/right): left in the case of half acquisition
- Rotation Axis (H/V): H= horizontal and V= vertical rotation axes.
3 Results and Discussion
3.1 Software Test
The first operation into the reconstruction process was to determine the exact centre of rotation for each dataset. For this purpose, the GUI was used, and a series of reconstructions performed automatically using different centres of rotation. As a second step, the optimal ratio 𝛿\𝛽 (Mayo et al., 2003b) to perform the phase-retrieval was chosen again using another automatic method present in the reconstruction software (see figure 3).
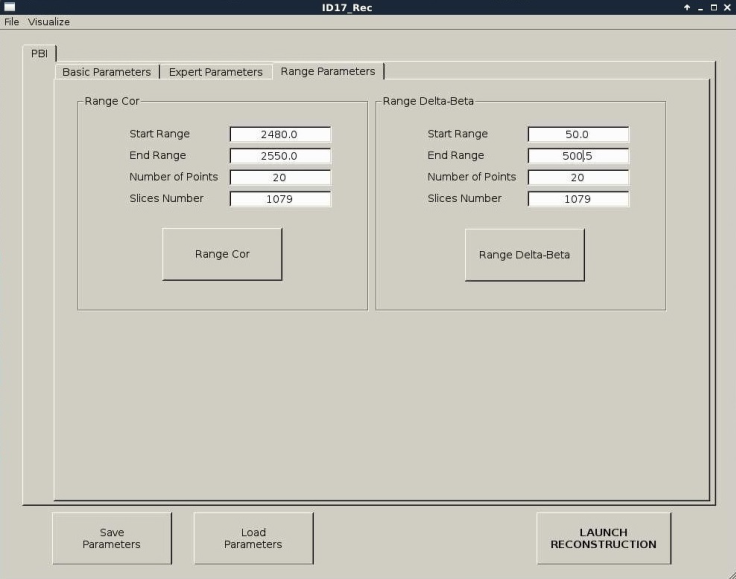
Figure 8 shows the basic parameters of the previous reconstruction, which would be fixed after finding the correct values in the range parameters. The expert parameters were loaded automatically from a text file generated after the micro-CT procedure (see figure 9).
3.2 Scanning of Phantom
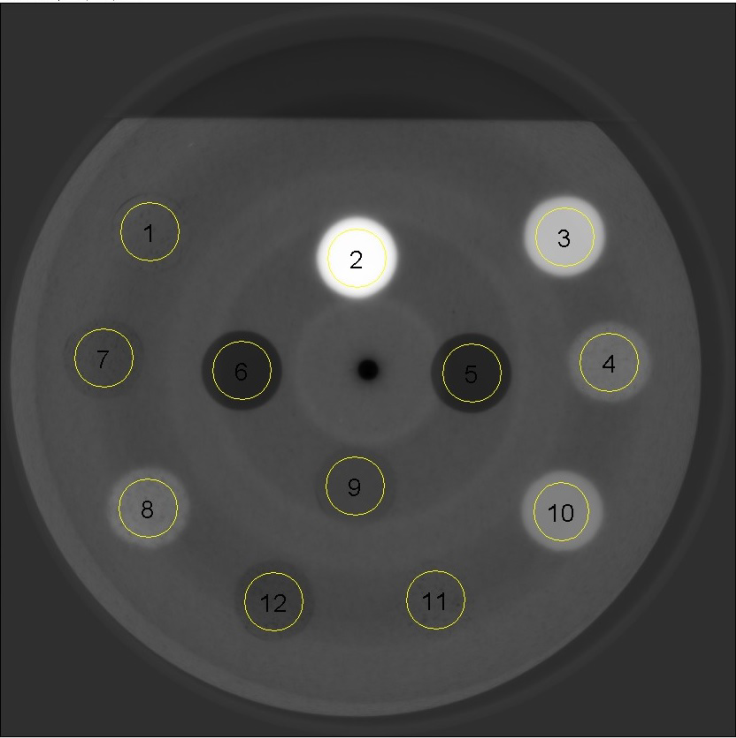
Figure 10 illustrates a reconstructed slice at a photon energy equal to 30 keV where the regions of interest (ROI) are numbered for each material according to table 2.
3.3 Scanning of rat sample/specimen
The PlastiRat is an extremely useful tool for conducting imaging quality assurance tests as well as for irradiation planning studies, and for educational purposes. The benefit of PlastiRat is that it is biologically inert, being a motionless rigid object that represents the true anatomy of a living rat including all the mineralized components of the bones (see figure 11) (Solutions, 2019b).
Parameters of experiment:
- The distance between the sample stage and the detector was 11 m.
- Wigglers: W150 - 55 mm, W125 - 45 mm.
- Filter: 2.5 mm Al + 0.8 mm C.
- Energy: 60 KeV.
- FReLoN CCD camera coupled with 1:3.6 optic.
- Effective pixel size 47 𝜇 𝑚 2 .
Parameters of reconstruction:
Sampling_reduction = 1
Width = 2048
COR = 180
CT_Range = 360
Number_of_projections = 4000
Sample_Positioning = 1
Rotation_Axis = 1
End_Range = 181.0
Scan_Name = plastified_rat_001_
Number_of_WF = 100
y_end = 211
Only_CT = 1
y_start = 1
Paganin_Length = 50
Slices_Number = 105
Slices_NumberP = 105
Number_of_Points = 2
Reconstruction_starts = 1
Reconstruction_ends = 211
Half_Acquisition = 1
Do_Paganin = 1
Number_of_PointsP = 20
AngleCT = 0.09
DEFINE = RETRIEVAL
BinningXY = 1
Start_Range = 179.0
Pixel_Size = 2.95
End_RangeP = 65.0
WF_name = ref0000_0000.edf
Make_Sinos = 0
BinningZ = 1
Height = 211
Ring_Correction = 1
Start_RangeP = 35.0
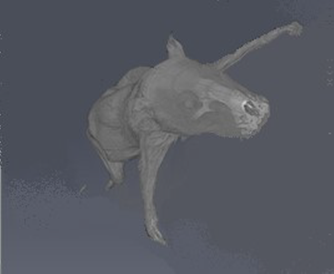
3D Rendering and Segmentation:
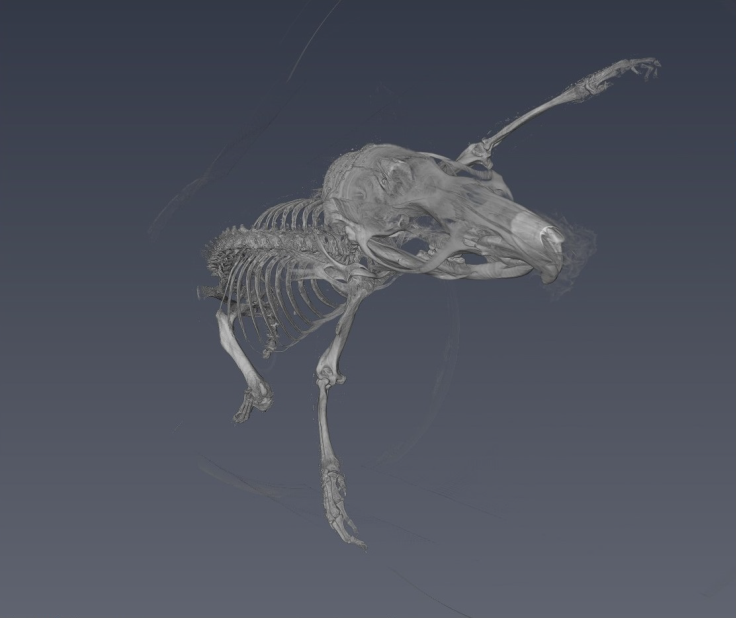
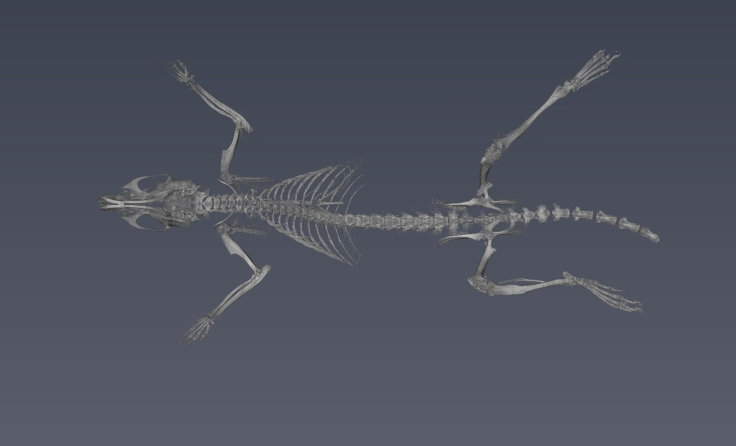
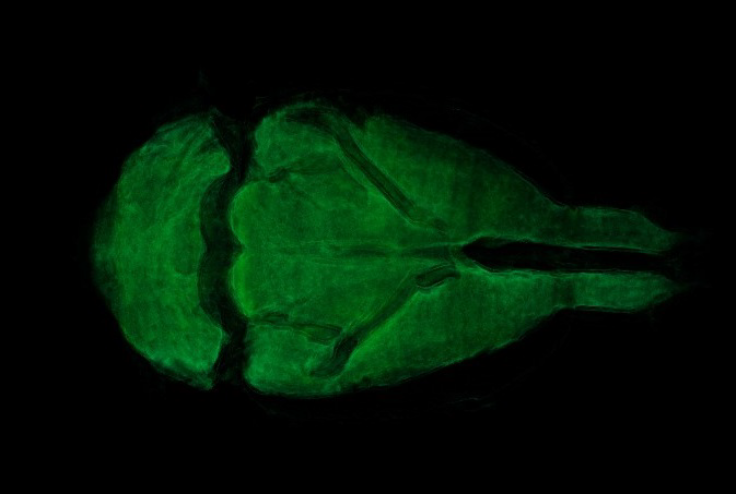
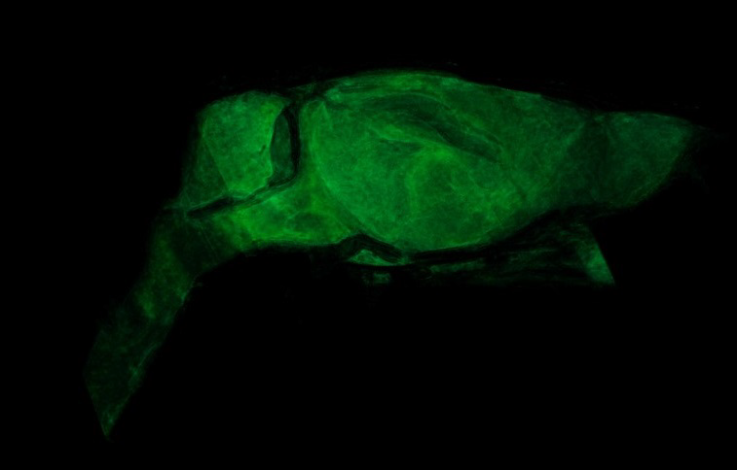
ImageJ was used for 3D rendering and segmentation. The segmentation assigns a label to each pixel of the image describing which region or material it belongs (Konrad-Zuse-Zentrum, 2019). Figure 12 shows the external tissue, figure 13- figure 14 depict the skeleton view, and figure15 - figure 16 illustrate some different views of the 3D brain of a rat using the technique region growing segmentation (Jarek, 2019).
3.4 Comparison of results
The reconstruction parameters entered in the GUI were adequate in both experiments, allowing the 2D reconstruction to be optimized in both experiments free of image artifacts. The 3D rendering for the reconstruction of the plasticized rat, permitted to verify the accuracy of the parameters entered in the GUI, for reconstruction of each slice based on the PyHST2 tool.It was possible to segment the external tissue, the bone structure and an internal organ (brain) of the plasticized rat. The scan of the plasticized rat and its subsequent rendering in 3D was the most complete test of the system, where the accuracy of the parameters entered into the GUI was evaluated, the use of PyHST2 as a reconstruction tool for each slice. A single data set of 700 slices was used for phantom reconstruction; instead, the plasticized rat, was used 54 data sets with 1400 slices each one for reconstruction. Another important factor is the Paganin value which is minor for the rat scan with respect to the phantom parameter allowing us to obtain a better contrast in the rat tissue and other small details. The binning values were 16 for the phantom scan and 1 for the rat scan, with the greater binning permitting an improvement in the contrast sensitivity and signal improvements.
4 Conclusions
It can be concluded that the methods and techniques used that allowed the development of this graphic interface were carried out successfully. The reconstruction parameters entered in the graphic interface using the image-based propagation technique were successfully tested in two experiments, which was demonstrated in the 2D and 3D reconstructions.

