


 Español (pdf)
 Articulo en XML
 Referencias del artículo
 Enviar articulo por email
 Citado por SciELO
  Similares en
SciELO
Similares en
SciELO 
 Permalink
INTRODUCTION
Steam systems in hospitals are essential since they produce saturated steam for the operation of equipment, such as autoclaves, boilers, boilers, industrial washers, industrial dryers, steam irons, and water heaters. A steam system is formed by the boiler, the distribution pipes, and the consuming equipment, which interact with each other, therefore, if any of them fails, it damages the whole system, producing energy losses, related to costs [1]. Nowadays, steam is one of the most important factors when industrial costs are analyzed. According to Palacios et al. [2], steam leaks stand out as one of the most expensive issues in a hospital. Notably, steam trap leaks can elevate operating expenses by as much as 33%. Consequently, initiatives aimed at conserving energy should commence with a thorough examination of these traps. It is crucial to recognize that even the slightest leak can result in annual costs of up to USD 7 000 [3].
Energy efficiency applied to steam systems is fundamental since it allows the steam to be used in the correct way, generating most of the heat for the different processes. Yogesh et al. [4] indicate that, by having good energy efficiency, fuel savings are generated and it helps the environment, reducing pollution. Mandrela et al. [5] conducted an energy audit of a food company in which they used thermography and ultrasound techniques to reduce energy losses and produce savings for the steam system.
In the last decades, several studies have been carried out, such as Ocaña et al. [6], who performed an energy analysis in a hospital steam system, applying the procedure established by the ASME EA-3-2009 standard for energy evaluation. The objective of the study was to assess the thermal losses resulting from the lack of thermal insulation on the steam and condensate return pipes in the four areas exhibiting the highest steam consumption. The findings revealed a cumulative energy loss of 513 GJ per year, equivalent to approximately USD 4 060. By implementing insulation in the pipes, a loss reduction of 195 GJ/year was achieved, representing 38 %, by completely insulating the pipes, which generated savings of USD 1 542 per year. The estimated cost of insulating the system with glass wool was USD 3 400, recoverable in a period of 2 years and 7 months, considering for the calculations a subsidized Ecuadorian diesel price of USD 1 037 per gallon.
The energy analysis of a boiler for reducing fuel expenditure was presented by Caetano et al. [7]. The methodology was to analyze an ATA 14 H 3N boiler model, with a capacity of 33.3 kg/s of steam. The data were obtained by measurements with a thermographic camera and a flue gas analyzer. The energy efficiency of the generator was 74.65 %. The most significant thermal losses were found in the combustion gases, with 11.18 %, radiation and convection losses reached 4 %, presenting a total boiler loss of 25.35 %. Two improvement alternatives are concluded, the first one is to reduce the excess air and the second one is to place thermal insulation in the non-insulated pipes. Perez et al. [8] carried out an analysis of a steam system of a meat factory, showing that the boiler efficiency was 90.7 % and the losses of the pipes without thermal insulation were 207.09 kW. Two improvement alternatives were proposed, the first was the thermal insulation of the distribution pipes with glass wool insulation and the second was the design of a water preheater at 70 ºC to feed the steam generator. The implementation of glass wool in the pipes generated a reduction of thermal losses by 92.30 %, the design of the water preheater generated a reduction of fuel consumption of 64 186.51 L per year, and the investment for the improvements was USD 450, this investment will be recovered in 1.4 months.
Ibrahim et al. [9] conducted a study on energy savings in the industrial steam system of a palm oil mill. During the development, we employed the steam SSAT system assessment tool along with the 3E Plus insulation program software. The outcomes revealed multiple sources of energy losses contributing to increased costs for the plant, notably with a low boiler efficiency of only 68.6 %. The study identified potential enhancements, specifically through the installation of a water economizer and a reduction in steam generator blowdowns. These improvements elevated the system's efficiency to 77 % from its initial operational state. Consequently, steam quality was enhanced, leading to annual energy savings of 75.28 GJ and fuel savings amounting to 598.3 tons per year.
The energy efficiency analysis of 5 boilers was performed by Santana et al. [10]. Surface temperature values of the insulated and uninsulated pipes were obtained using a Testo 875 thermographic camera. The study involved the determination of useful heat within the cooking system and a thorough analysis of thermal losses occurring in the distribution pipes. The transmission losses in the insulated pipes were 13.32 and 4.22 kW for uninsulated ones, for a total of 17.53 kW of heat losses. The analysis determined that the total heat loss of the installation was 14.43 kW, with respect to 243.02 kW which represented the available heat, obtaining a system efficiency of 94 %.
The thermo-energetic study of a thermoelectric plant with a capacity of 49 MW was developed by Retirado et al. [11]. The applied methodology utilized an algorithm to assess both the gross and exergetic thermal performances of the boilers. The findings revealed a notable efficiency in thermal energy utilization coupled with a relatively low capacity for exergy use in the installations. Specifically, the thermal efficiency of the system reached 90.1%, while the exergy efficiency was recorded at 45.5%. Suntivarakorn et al. [12] proposed enhancing boiler efficiency through heat recovery and the implementation of an automatic combustion control system. This improvement harnessed the heat from chimney gases for fuel drying, air preheating, and regulating the burner air intake using a fuzzy logic control algorithm. Experimental findings demonstrated that heat recovery and fuel drying reduced fuel moisture content by 3 wt.%, leading to a 0.41 % increase in boiler efficiency. Air preheating resulted in a 35 °C temperature rise, contributing to a 0.72 % boost in efficiency. The fuzzy logic-controlled air system exhibited an accuracy of 89.15 %, correlating with a 4.34 % efficiency increase. When all three systems operated concurrently, a collective boiler efficiency increase of 5.15 % was achieved, translating to annual fuel savings of 246.88 tons.
Erbas [13]. conducted a comprehensive study on the thermal performance of a coal-fired boiler, employing the energy balance method in accordance with the ASME PTC 4 standard. The analysis focused on a 75-ton-per-hour capacity boiler installed in the mining industry. The performance test revealed an impressive boiler efficiency of 93.07 %. Utilizing the indirect method, the top three contributors to the overall losses in the boiler were identified as water heat loss in the fuel at 4.03 %, dry flue gas loss at 3.23 %, and the proportion of unburned coal in the waste products at the end of combustion at 1.65 %.
Sagaf et al. [14] performed a prediction on the efficiency deterioration of two boilers in two power plants, with an individual capacity of 660 MW in Indonesia. ASME PTC 4 guidelines and linear regression method were followed. The findings highlight that the primary sources of thermal losses stem from hydrogen burning moisture in the fuel and heat loss attributable to moisture in the fuel. Notably, the degradation in boiler efficiency is measured at 0.19 and 0.4 % per year for the first and second units, respectively. One of the causes of the boiler efficiency deterioration is the use of coal of variable quality and the accumulation of ash in the economizer that reduces heat transfer.
This work aims to propose energy efficiency improvements by analyzing the boiler and distribution piping system, applying energy management techniques, and obtaining operating parameters to determine improvements. This document is divided as follows, Materials and Methods detail the utilized methodology to develop the study, focusing on energy management techniques to achieve outcomes. Results study the data in order to determine the improvements in the system. Finally, in Conclusion, the qualitative and quantitative information is synthesized to demonstrate the fulfillment of this work.
MATERIALS AND METHODS
Steam generation, distribution and consumption
The steam generation and distribution system for the study is a hospital in the province of Chimborazo, with an altitude of 2 760 m above sea level, the average annual temperature is 15 °C and the atmospheric pressure is 71.33 kPa, according to statistical data from the National Institute of Meteorology and Hydrology (INAMHI) [15]. Steam generation is carried out in a vertical boiler Model V1X69-150-9, with a power of 30 BHP, which runs on diesel and has the capacity to generate 469.47 kg/h of steam, working at a nominal pressure of 620.5 kPa.
The process begins when raw water from the public network is sent to two 64 m3 tanks, from which point the fluid is sent by a pumping system to the water treatment process, where it is softened with cationic resins. Then, the water is sent to the storage tank, where it is mixed with the condensate that returns from the process. The water is then supplied by a multi-stage pump to feed the boiler, usually at a temperature of 60 ºC. On the other hand, the fuel is stored in a 7 570-liter main tank, and from there, it is pumped to the secondary tank that feeds the boiler. Subsequently, it is distributed by gravity to the burner, having an average fuel consumption of 18.93 liters per hour, at a fuel oil temperature of 18 ºC.
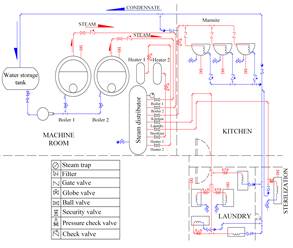
Fig. 1 shows the distribution of steam generated to a storage manifold and to the consuming areas of the hospital steam system. The Laundry area consists of three sections, the Garment Drying area which is composed of an industrial dryer with a capacity of 60 kg, the Garment Washing area with two industrial washers of 45 kg capacity and the Ironing area with a 3 HP ironer. The next area is the Kitchen with 115-liter kettles, followed by the Sterilization area, which consists of two Autoclaves with 180 kW power. The last area is the Power House which consists of a water heater capable of generating 13.25 liters per minute.
Technical system status
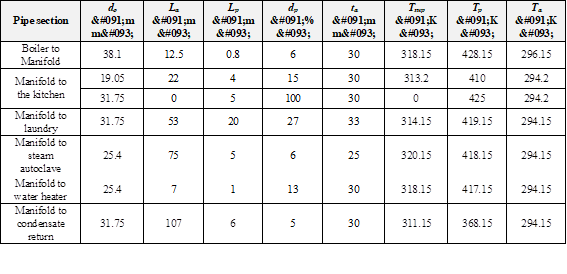
The steam system has a main boiler and a reserve boiler and its thermal insulation is in good physical condition. Several sections of the steam and condensate return piping are not insulated, generating heat loss to the environment and energy costs, and also causing poor steam quality. The areas where most of the insulation is missing are the laundry and sterilization areas. Table 1 shows a review of the condensate distribution and return system. The external diameter (d o ), insulated (L a ) and non-insulated pipe length (L p ), insulation thickness (t a ), ambient temperature (T a ), surface temperature outside the insulated (T sup ) and non-insulated (T p ) pipes were measured. For these records, a SATIR thermographic camera was used, taking measurements in 6 sections. To gather operating parameters of the system, pressure gauges and thermometers are strategically installed at key points of interest, complemented by the use of a DN100 electromagnetic flowmeter.
Technical system status
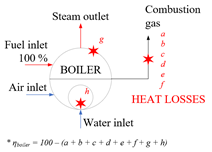
For the steam system diagnosis and subsequent energy efficiency improvement proposals, the recommendations of the ASME-EA-3-2009 standard [16] were followed. It is utilized for energy evaluation of steam systems, which suggests collecting and analyzing design, operation, energy use, and system performance data to identify opportunities for energy efficiency improvement. Efficiency was evaluated by the energy balance method [17]. Fig. 2 lists the causes for heat losses, due to dry flue gas loss (a), H2 loss (b), fuel moisture (c), moisture in the air (d), CO loss (e), fly ash loss (f ), surface loss (g) and bottom ash loss (h).
The calculation of the boiler efficiency is performed following the procedure outlined in Platzer [18]. For this, the stoichiometric air/fuel ratio and the excess air supplied, described in equations (1) and (2), respectively, are determined. To perform these calculations, the fuel properties must be considered, in this case, the boiler uses diesel fuel No. 2. It is also necessary to know the constitution of the combustion gases, by considering the measurements of the main boiler, that were made with a Bacharach ECA 450 gas analyzer:

Where M air, theoretical is the theoretical air quantity per fuel quantity. Excess air (EA) is obtained from gas analysis data by applying equation (2):

Then the amount of actual air mass (M a ) entering, per amount of fuel, is determined [18]:

The mass of dry flue gas (m) is then determined:

It is essential to identify the diverse thermal losses associated with the boiler, commencing with the determination of heat loss due to dry flue gas (L 1 ). This loss, considered the primary one for the boiler, is derived using equation (5):

The thermal loss due to the evaporation of water formed by H2 in the fuel (L 2 ) is related to the combustion of hydrogen, which causes a heat loss because the combustion product is water, which is converted into steam and is calculated with the equation (6):

To determine the loss due to the moisture present in the fuel (L 3 ), it is considered that the moisture that enters with the fuel produces a superheated steam, and it is determined by equation (7):

In computing the loss attributed to moisture in the air (L 4 ), the mass of vapor in the air is ascertained using psychrometric charts. The quantification of this moisture-related loss is achieved through the application of equation (8):

Heat losses due to incomplete combustion (L 5 ) are the products containing CO, H2, and hydrocarbons that are in the combustion, value determined with equation (9):

The surface losses (L 6 ) are calculated by knowing the boiler surface area and temperature:

Once the different heat losses have been determined, the boiler efficiency is determined by equation (11) [19]:

Calculation of heat losses in pipelines
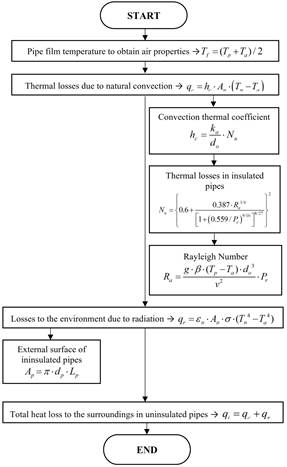
Fig. 3 presents the calculation method established in the scientific literature to determine losses in insulated steam pipes, based on NOM-009-ENER-1995 [20].
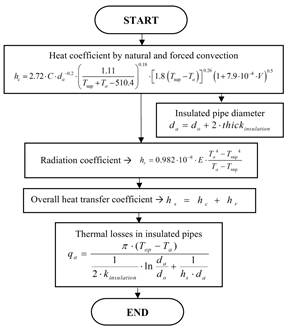
In the equations presented in Fig. 3, the dimensionless geometric coefficient for pipes (C) is denoted as 1.016. The variable V represents wind speed, which, in this scenario, is assigned a value of zero due to the entirety of the installation being situated within the confines of a building. Additionally, E and k insulation correspond to the emissivity and conductivity of the insulation, respectively, while T op signifies the operating temperature of the boiler.
In the absence of insulating material, pipes are regarded as horizontal cylindrical surfaces that dissipate energy through a combination of convection and natural radiation. The calculation method established in the scientific literature to calculate the losses in non-insulated steam pipes was considered with the modeling proposed by Cengel [21]. The operating conditions are considered to be stationary and the formulation synthesized and systematized in Fig. 4 is used.
Calculation of heat losses in pipelines
The primary alternatives proposed include pipe diameter standardization and thermal insulation, with the initial focus on pipe diameter standardization. The steam pipes within the hospital exhibit varying diameters, spanning from 12.7 mm (0.5 in) to 38.1 mm (1.5 in). Certain sections necessitate this range of diameters to meet the steam demand of the associated equipment. However, in the section from the steam manifold to the boiling pans located in the kitchen, 2 sizes of pipe diameters prevail, due to the lack of adequate couplings to maintain a single pipe diameter, which generates a greater heat loss. For this pipe section, the diameter is unified by acquiring the fittings and pipe of the same size, and the calculation is made in the pipe section, by applying the calculation model shown in Fig. 4. After calculating the pipe loss by unifying the diameter, the loss due to the variety of diameters is determined by means of equation (12):

In addition, it is proposed to implement thermal insulation in the non-insulated distribution pipe sections. Initially, the thermal losses for each uninsulated pipe section are reassessed by introducing thermal insulation. The calculations adhere to the methodology outlined in Fig. 4. Given that the surface temperature outside the insulation (T sup ) is not known, an initial temperature value is assumed, and the corresponding thermal losses (q a ) are then determined. To obtain that the calculated thermal losses (q a ) are admissible, the iterative approach suggested in NOM-009-ENER-1995 [20] is used, with equation (13):

This equation determines if the calculated value is acceptable, by obtaining the calculated surface temperature (T sc ) and comparing it with the surface temperature of the insulation, initially assumed for the calculation of losses in the insulated pipes. If T sc is equal to T sup , then the heat losses are acceptable, if T sc is different from T sup then the q a calculations must be repeated, equaling T sc to T sup , and then the temperatures are compared again. After determining the losses of the insulated pipes, the heat loss due to lack of insulation is determined with equation (14):

RESULTS
Boiler energy efficiency analysis
Table 2 details the results of heat losses after calculating the boiler efficiency, with the objective of finding opportunities for improvement.
Table 2: Steam generator energy efficiency calculation
| Heat Losses | Value [%] |
|---|---|
| L 1 | 10.41 |
| L 2 | 7.52 |
| L 3 | 0.03 |
| L 4 | 0.21 |
| L 5 | 0.01 |
| L 6 | 1.54 |
| η | 80.29 |
It is observed that the highest loss is due to dry combustion gases, with a percentage of 10.41 %, due to the excess of air present in the combustion equal to 15 %, followed by the loss of hydrogen in the fuel with 7.52 %. The heat loss by radiation and convection is within the parameters, according to Saidur et al. [22], which indicates that these losses represent a maximum value of 2 %. Finally, a boiler efficiency of 80.29 % is obtained, which is a value that can be considered tolerable, although it can also be improved for the type of fuel used, according to Retirado et al. [23].
Thermal loss analysis of the piping system
The analysis aimed to identify opportunities for improvement by assessing thermal losses in both insulated and non-insulated pipes within the system. The pipes were segmented into six sections, and characteristic geometric values of the pipe system, along with surface temperatures in both insulated and non-insulated pipes, were measured. Surface temperatures ranged from 40 °C for insulated pipes to a maximum of 150 °C for non-insulated pipes values falling within the application range for glass wool as per ASTM C-552 [24] and C-1696 [25]. Table 3 outlines the losses per section, with the total loss calculated at 15.33 kW.
Table 3: Steam generator
| Heat Losses [kW] | Boiler to Manifold | Manifold to the kitchen | Manifold to laundry | Manifold to steam autoclave | Manifold to water heater | Manifold to condensate return |
|---|---|---|---|---|---|---|
| In insulated pipes | 0.41 | 0.50 | 1.52 | 2.17 | 0.19 | 3.19 |
| In uninsulated pipes | 0.22 | 1.31 | 4.20 | 0.85 | 0.17 | 0.62 |
| Total, in sections | 0.63 | 1.81 | 5.72 | 3.02 | 0.35 | 3.81 |
| Total, in pipes | 15.33 |
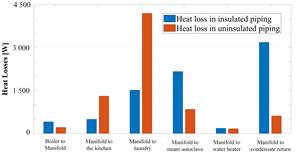
Fig. 5 presents the actual loss values for the insulated and uninsulated pipes in each section. The current total heat loss of the piping system is 15.33 kW, of which, 7.36 kW is lost in the uninsulated pipes, representing 48 % of the total losses. Currently, the steam system falls outside the parameters defined by the NEC energy efficiency standard regulations [26], as it exceeds the permissible maximum energy loss of 4% attributable to inadequate insulation [27].
Steam system efficiency improvements
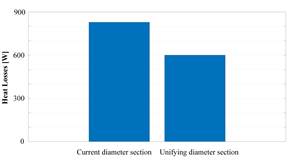
The piping section from the steam manifold to the kitchen area is made up of two diameters, due to the lack of fittings and piping, identifying a 5 m section with different diameters. It generates greater heat loss, therefore, the effect of unifying the pipe diameter is considered. The analysis is carried out regarding the installation of 19 mm (0.75 in) pipe, of the same diameter as the other pipes in this section. In this manner, a heat loss reduction of 228 W is generated and represents a total annual energy saving of about 2.4 GJ per year, which corresponds to USD 64. Fig. 6 compares the heat loss in the section without unifying the pipe diameter and unifying the diameter, which was calculated considering that the steam distribution system works 8 hours per day, the whole year.
Insulation of distribution pipeline
For the analysis, it is proposed to install an insulator with the same characteristics as those installed in the insulated pipes. The insulators possess the characteristic of being composed of glass wool material featuring an aluminum coating adhered to it, with insulation thickness ranging from 25 to 33 mm. Through measurements with a thermographic camera, it was determined that these insulation thicknesses guarantee that the surface temperature is within the parameters allowed in Cengel [21], where the surface temperature should not be higher than 60 °C. Fig. 7 shows the effect of insulating the pipe sections without thermal insulation.
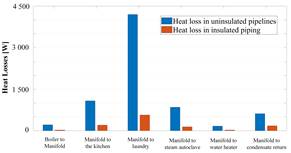
In the Boiler to Manifold section, there was a loss reduction of 0.19 kW. Next, for the Manifold to the kitchen section, a reduction of 0.88 kW was obtained, in the Manifold to laundry, 3.63 kW, in the Manifold to steam autoclave section, 0.71 kW, in the Manifold to water heater section, 0.14 kW, and in the Manifold to condensate return section, 0.44 W. All these savings produce a total reduction of 5.99 kW, and represent a total annual energy saving of 62.91 GJ per year, which corresponds to approximately USD 1 672, value that was calculated considering that the distribution system works 8 hours per day during 365 days of the year.
A financial analysis was conducted to assess the project, aiming to determine the necessary investment costs and the anticipated payback time. Hence, the estimated implementation cost for insulating the steam piping system amounts to USD 9.43 per meter. When taking into account the Net Present Value (NPV) and potential savings, the break-even point becomes achievable within 4 months. Beyond this timeframe, the initial investment proves worthwhile, generating additional income. This rapid payoff not only recoups the investment but also generates surplus funds that can be directed toward further investments in hospital machinery and infrastructure. Additionally, an analysis was conducted by implementing pipe diameter standardization. The examination revealed that the investment required to standardize the pipe diameter in the Manifold to kitchen section, covering a distance of 5 m and including the acquisition of necessary pipes and accessories, amounts to USD 47.40. According to NPV calculations, the break-even point for this investment could be realized after 9 months.
CONCLUSIONS
The efficiency of the boiler was obtained by calculating the six thermal losses present in the combustion, determining an efficiency of 80 %. The greatest loss is produced by the dry combustion gases, representing 10.41 %, attributed to the excess air that has a presence in the combustion of 15 %. To produce improvements, excess air can be reduced to 10 % by increasing the frequency of burner maintenance. By improving the excess air, the flue gas temperature is also reduced, which was 295 °C, data that were recorded using technological equipment, such as a thermographic camera and gas analyzer. The heat losses of the 6 sections of the system were 15.33 kW, of which 7.36 kW is lost in the uninsulated pipes, representing 48 % of the total thermal losses.
With the unification of the pipe section from the Manifold to the kitchen, a reduction of heat loss from 828 to 600 W is generated. It represents a total annual energy saving of 2.4 GJ per year, which corresponds to approximately USD 64. The thermal insulation of the pipes with glass wool represents a total annual energy saving of 62.91 GJ per year, related to USD 1 672, both scenarios were calculated considering that the system operates 8 hours per day during the 365 days of the year. The expenditure for insulating a 49-meter pipe is USD 462. This cost, factoring in the NPV of the investment and potential savings, leads to the break-even point being achieved after 4 months. Similarly, for the standardization of the pipe diameter in a 5-meter section, involving the purchase of necessary pipes and fittings at a cost of USD 47.40, the NPV analysis suggests the break-even point could be attained within 9 months. These findings underscore the economic benefits associated with implementing the proposed improvement options.

