


 Español (pdf)
 Articulo en XML
 Referencias del artículo
 Enviar articulo por email
 Citado por SciELO
  Similares en
SciELO
Similares en
SciELO 
 Permalink
INTRODUCTION
Currently there are a lot of industrial processes that demand a specific control method for its proper operation. Within this group of procedures requiring modernization and implementation of control systems, are processes related to water treatment, specifically drinking water treatment, which involves transforming raw water from natural sources into drinking water within the parameters established under specific standards for human consumption. A conventional drinking water treatment process consists of sequential steps and the most important one, is coagulation since it ensures that the dosed quantities of coagulating chemicals are in accordance with the properties of the raw water such as color, turbidity, pH and alkalinity [1]. Obtaining the doses of these chemicals reacts to a non-linear response done by experts. It is performed by jar testing, which is not adaptive to changes in real time and needs a considerable amount of time for its execution [1]. This is an issue since there is an immediate and constant dependence on qualified and experienced operators.
To ensure good quality of treated water, operators must adjust the amounts of coagulant chemicals at certain time intervals or climatic conditions where the water has parameters outside the usual range. Excessive amounts of coagulant chemicals correspond to increased treatment costs and public health problems. An under dosage corresponds to a failure in the flocculation of the water and increases the frequency of maintenance of DWTP increasing the cost of production. Moreover, an implementation of algorithms based on artificial intelligence and machine learning, which have been investigated and implemented in treatment plants around the world, is proposed.
For instance, [2] uses the potential provided by artificial neural networks, supporting vector machines, and gene expression programming to approximate the model of trihalomethane formation generated by chlorine water disinfection processes. They obtained as a result three models that capture the complex nonlinear behavior of the collected data. They also indicated excellent predictive and generalization capability. Furthermore, it demonstrated that these types of models, which commonly need a large amount of data, apply to a smaller amount of data. In another research, [3] artificial neural networks (ANN) are utilized to model the PAC dose. This method responds well when obtaining the appropriate dose in real-time when a storm brings high turbidity in raw water. In fact, they defined the input variables using Pearson’s correlation and validated their model using the mean square error obtained.
In addition, [4] developed a model where the type of coagulant to be used is set by decision trees and the dose was estimated by ANN, allowing to calculate from the raw water parameters (pH, turbidity, and temperature), the amount and type of coagulant to be used (PAC, PASS and PSO-M). Moreover, [5] developed a model to predict turbidity and color of treated water at the outlet of the Rossdale WTP located in Edmonton, Alberta in Canada. In 2009, [6] determined that the coagulant dose cannot be settled under traditional mathematical models, because it depends on several factors. Stating that the prediction of coagulant by neural network provides high accuracy and faster convergence speed and can be used to predict in real time online.
These types of neural models are seen as standard estimators of nonlinear relationships and their predictive and generalization capabilities let them have successful applications in different fields of knowledge [7].
On account of the above-mentioned research, the objective of this study is to build a neural model that adequately adapts to the relationship between raw water quality and the doses of chemicals needed for treatment. Initially, the data obtained involves a dosing history over a period of 14 months. The correlation between raw water quality and coagulant dosage was found. We will have to find a middle ground in the learning of our model in which we are not underfitting and not overfitting. For this problem, the input data set for training should be subdivided into two: one for training and one for the test that the model will not know beforehand. This division is usually made of 80% for training and 20%. The Test set should have diverse samples and enough samples to be able to check the results once the model has been trained. We proceeded with the training and validation process of the neural model by using the adaptive gradient algorithm and the analysis of the results using MAPE and RMSE. The results for the training set were an RMSE value below 2.82 and for the MAPE, a value of less than 0.045. On the other hand, for the test, set a RMSE value below 3.3 and 0.06 for the MAPE. It has been observed that the RMSE metric does not predict whether the estimation model is ideal or not. On the contrary, MAPE offers a better way to determine the accuracy of the model. The higher model accuracy is achieved when the value of MAPE is lower. Proving that the system had the ability to get information from dosing background and be able to estimate PAC doses for different raw water qualities.
The following paper is organized as follows: an overview of the water treatment process, determination of the variables, data analysis, construction and training of the neural model, analysis of results and conclusions.
METHODOLOGY
Determination of Process Variables
The conventional drinking water treatment process consists of 6 stages where the predominant process is dosing. This defines the success of the following stages. The process diagram of the drinking water treatment process is shown in Fig. 1.
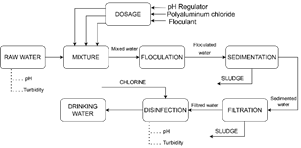
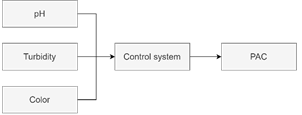
The measurement of organoleptic and physical-chemical parameters is performed on the raw water. These measured values help in acquiring the amount of chemicals to be dosed for water coagulation. The amounts of chemicals can be tested by a jar test in the DWTP laboratory before dosing. Based upon the dosing process carried out at the DWTP, from the studies previously mentioned and the experience, the minimum and necessary amount of input variables involved in the process was defined. The input variables of the control system are pH, turbidity, and color of the raw water. These were selected through expert knowledge and were determined to be the minimum necessary to estimate the doses of chemicals considering the limited instrumentation existing in the DWTP. These variables can be quantified by means of sensors located at the inlet of the DWTP. The output variables are directly related to the amount of chemicals to be dosed in parts per million (ppm). Therefore, the control system in a generic way was shaped by the mentioned process variables and is structured in Fig. 2.
Data Collection and Analysis
The data obtained correspond to a water source that supplies one of the DWTP in Ecuador. This database contains the input parameters of the control system, which are the quantifiable characteristics of the water that took one year and two months of data collection. It started on October 1, 2017 and ended on December 31, 2018 with a total of 438 data points available. The raw water parameters of the raw water source are shown in Fig. 3 - Fig. 5.
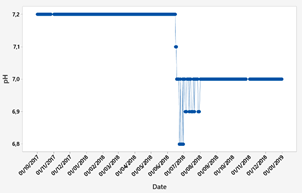
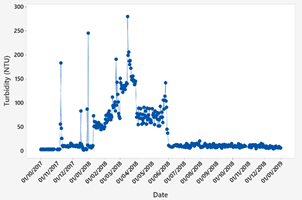
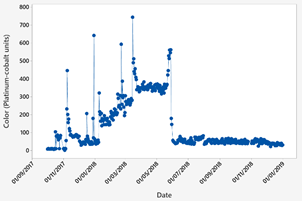
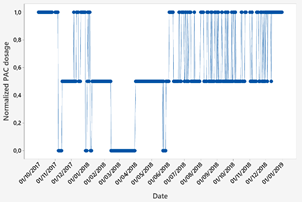
Fig. 6 shows the PAC dosages. The graph shows the dosage in normalized values. A linear scale between 0 and 1 was used to normalize the data using the following equation.

Where D is the PAC dose, Max is the maximum PAC dose value, and Min is the minimum PAC dose value.
Pearson's correlation was used to determine the statistical relationship between the process variables. This is shown in Table 1.
Table 1: Pearson's Correlation Between each Input and Output
| Pearson's correlation coefficient (r) | ||||
| PAC | Color | Turbidity | pH | |
| PAC | 1 | -0.63012 | -0.70006 | -0.32401 |
| Color | 1 | 0.89924 | 0.49197 | |
| Turbidity | 1 | 0.46451 | ||
| pH | 1 | |||
The relationship between the PAC output and the Color, Turbidity and pH inputs is a negative association, i.e. as the raw water parameters increase their value for the amount of PAC doses decreases. It can also be said that this correlation between PAC doses and the parameters: Color and Turbidity is higher compared to the association between PAC and water pH. The color and turbidity of the water have a relatively high positive correlation, that means that as the color of the raw water increases its value so does the turbidity. Additionally, color and turbidity are positively related to pH but their relationship value is low. Finally, the coefficient of determination between the variables was obtained, which is illustrated in the following table:
Table 2: Determination Between each Input and Output
| Pearson's correlation coefficient (r) | ||||
| PAC | Color | Turbidity | pH | |
| PAC | 1 | 0.39706 | 0.49009 | 0.10498 |
| Color | 1 | 0.80864 | 0.24204 | |
| Turbidity | 1 | 0.21577 | ||
| pH | 1 | |||
It is proved that the indicator of determination between the PAC, the variable to be predicted, and the Color, Turbidity and pH inputs is found to be less than 50% in each case. As a result, the model is a poor fit to its data. Consequently, the model belongs to a non-linear system and demands an intelligent control system that is suitable for the data.
Structure of the Neural Model
An Artificial Neural Network (ANN) represents a computer model based on the application of theoretical neurophysiology that replicates the way in which the human nervous system communicates and propagates. In [8] McCulloch & Pitts developed the first computer model that captures this work.
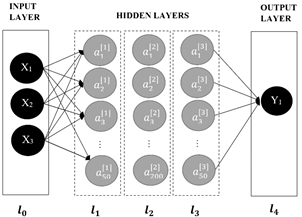
A Multilayer Perceptron (MLP) consists of a network architecture composed of one or several hidden layers, an interconnected system that examines information in a parallel but non-linear way, giving the ability to solve non-linear problems. The hidden layer makes a connection between each input and each output of the neural network, forming a fully connected or "dense" model. The information that reaches the input layer generates an activation pattern that in turn is an input signal applied to the neurons of the hidden layer [9]. If there is more than one hidden layer, the output signal of the first hidden layer is the input of the next hidden layer and so on until the output layer is accomplished. The matrix-expressed implementation of this algorithm called forward propagation is shown as follows:

Being l the number of layers of the MLP, f is the transfer activation function, 𝑾 𝒍 is the current synaptic weights, 𝑨 𝒍−𝟏 represents the output of the previous layer, 𝑩 is the bias vector and 𝑨 𝒍 represents the output of the current layer.
An MLP is regularly trained with stochastic gradient descent methods [10], a technique in which the ANN parameters are updated at each iteration and the error is propagated backwards, updating the synaptic weights and decreasing the error in prediction.
In the present case study, the inputs of the ANN are the physical-chemical characteristics of the raw water: Turbidity, Color and pH. The output is the amount in parts per million of PAC.
Recordings of data corresponding to 438 dosages of the chemical agent PAC, with their respective input parameters, were used. The outcomes suggest that 80% of the data should be used for the training set, and the remaining 20% for the test set. Through the training process of the neural network, the best hyperparameters suit the model and allow the best accuracy in the prediction of the output were determined. Which are shown in the following table:
Table 3: Hyperparameters of the neural model
| Dense Sequential Deep ANN | |||
| Layer | Number of neurons | Number of parameters | Activation function |
| Input | 3 | - | - |
| Hidden 1 | 50 20 | 200 | Sigmoid |
| Hidden 2 | 200 | 10200 | Sigmoid |
| Hidden 3 | 50 | 10050 | Sigmoid |
| Output | 1 | 51 | Linear |
| Total parameters: 20501 Trainable parameters: 20501 Untrainable parameters: 0 Learning rate: 0.1 Number of training epochs: 3000 Optimizer: Adaptative Gradient Algorithm (Adagrad) Root Mean Square Error (RMSE): 2.54 | |||
The design of the deep ANN for PAC dosing is illustrated in the Fig. 7.
RESULTS AND DISCUSSIONS
Once the artificial neural model has been trained, a validation was performed using real vs. predicted data. For this, the data from the training set was initially employed, later the data for the test set was used, which represented new data for the neural model. The trained model has the ability to predict the PAC dose with the test data and with new data in real time.
It should be noted that the neural model predicts decimal values due to the activation functions used in its neurons, which may be found in the database. The PAC dosage values are integer values (ppm). Hence, the next step has been used to approximate each datum to its immediate superior in order to get the predicted doses correctly. This does not affect the output results because the dosages are made through doses with specific steps (50, 60, 70). Therefore this approach helps us to stay in the practical range of dosages. However, for their representation, both results were considered as an illustration. The performance and precision of the neural model with respect to the real data of the dosages were through the Mean Absolute Percentage Error (MAPE) and the Root Mean Square Error (RMSE), metrics expressed by the following equations:

Where 𝑿 𝒊 is the measured value, 𝒀 𝒊 is the predicted value, and 𝑵 represents the number of samples. The results obtained in the training and testing phase are shown in the Table 4.
Table 4: Accuracy of the neuronal model
| RMSE | MAPE | |
| Training set (Not adjusted values) | 2.549 | 0.0425 |
| Training set (Adjusted values) | 2.816 | 0.0262 |
| Test set (Not adjusted values) | 3.141 | 0.057 |
| Test set (Adjusted values) | 3.254 | 0.0401 |
Fig. 8 and 9 show the performance of the Deep ANN through the comparative graphs of the real data vs. the data predicted by the neural network in the training set. In the same way, the performance of the Deep ANN with the test set is shown through the Fig. 10 and 11.
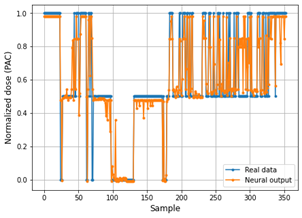
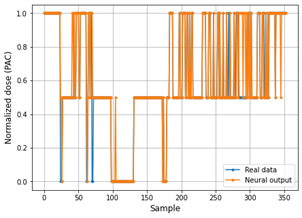

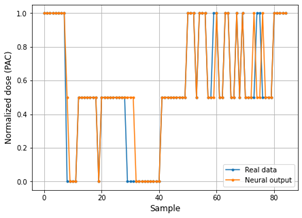
The main problem with the RMSE metric is that it does not predict whether the estimation model is good or not. MAPE offers a better way to determine model accuracy, while the value of MAPE is lower, then the model is more accurate.
As can be seen in Table 4, the PAC predictive model in the training phase achieves a MAPE value of 0.0425 for PAC values and 0.0262 for adjusted values. This demonstrates that the predictions delivered by the neural model are quite accurate. However, in the testing phase, the neural model reaches a MAPE of 0.057 for PAC values and 0.041 for adjusted, which still displays the reliability and accuracy of the system.
CONCLUSIONS
In conclusion, this deep ANN gives an efficient solution to solve dosing problems that may occur in any DWTP. Within the DWTP, pH Regulator, PAC and flocculant are dosed, due to the focus of this project, a model with 3 inputs (pH, Turbidity, Color) - 1 output (PAC) was studied. Only the PAC will be used as output because it represents the minimum model that can be developed. To verify that the dosage is correct, pH, turbidity and color are measured at the outlet of the DWTP (treated water) and check that the parameters are within norm. The system automatically defines the appropriate dosage regardless of the parameters that are presented without the need to call or have the immediate help of a specialist. The various implementations of these systems have been studied within the state of the art in DWTP in different parts of the world, and it has been possible to verify the success of this alternative in comparison to methods that do not use artificial intelligence.
This system could be well received by companies dedicated to the treatment of drinking water, responding the need of a possible booming market for the development of automatic and intelligent systems in our country.
According to the metrics used, in the evaluation of the unadjusted training set, an RMSE of 2.549 and MAPE of 0.0425 were obtained. For the adjusted training data, an RMSE of 2.816 and a MAPE of 0.0262 were also acquired. As demonstrated in both cases of the training test, the MAPE is below 0.045, which reveals that the model is quite accurate.
Furthermore, for the unadjusted test set an RMSE value of 3.141 and a MAPE of 0.057 was obtained. For the adjusted data set an RMSE of 3.254 and MAPE of 0.0401 were obtained. As can be seen in the testing phase, for both cases, MAPE of less than 0.06 is examined, which still shows the efficiency of the ANN.
According to the aforementioned values it is concluded that the Deep ANN model is correctly adapted to the nonlinear behavior describing the chemical dosing processes from the parameters of the raw water discharge and has the ability to gain knowledge from a dosing history. It is mentioned that in the proposed treatment process, only the PAC doses are predicted, the doses of pH regulator and flocculant are calculated in the field with the knowledge of the expert without affecting the operation of the DWTP.
A comparison of the different neural models for the prediction of coagulant chemicals can be proposed as a future study. In addition, another system can be implemented where the outputs are all the coagulating chemicals. In this case only one output (PAC) is used as a starting point for future projects.

