


 Español (pdf)
 Articulo en XML
 Referencias del artículo
 Enviar articulo por email
 Citado por SciELO
  Similares en
SciELO
Similares en
SciELO 
 Permalink
INTRODUCTION
The increase of electricity load as well as the existence of new economic and environmental constraints on generation dispatch and expansion of transmission systems have caused the Electrical Power System (EPS) to operate closer to its operating limits. In these new operating conditions, the static and dynamic security can be affected by voltage stability problems [1]. According to [2], voltage instability causes a progressive and uncontrolled decrease of bus voltages after a disturbance, a sudden increase in electrical load, a change in system operating conditions or a combination of all of them. Cepeda et al. established most of these events occur in stressed EPS, where generators fail to maintain normal voltage profiles at the busbars and transmission lines are congested [3].
Currently, in the technical literature, several approaches for voltage stability assessment have been proposed: active power-voltage (PV) and reactive power-voltage (Q-V) curves, modal analysis, sensitivity studies, application of voltage stability indices and continuous power flow (CPF), all of them for static analysis, as shown by Patidar and Sharma [4]. However, from a real-time perspective, such approaches require a large amount of time and computational effort for the execution of these methodologies. On the other hand, artificial intelligence-based algorithms are the most important tools to perform real-time static or dynamic security monitoring and assessment of EPS by predicting voltage, frequency and angle stability margins.
As demonstrated in [5], today, machine learning (ML) based techniques such as artificial neural networks (ANNs), decision trees (DTs), fuzzy logic (FL), adaptive neuro-fuzzy inference system (ANFIS) and support vector machines (SVMs) have become attractive tools for solving nonlinear problems with desired speed and accuracy. In particular, deep learning is used in [6], for short-term voltage stability assessment of power systems to learn the dependencies from post-disturbance system dynamic trajectories. In this connection, it is important to highlight that most of the current proposed methodologies, oriented to use artificial intelligence-based algorithms, have been applied to test power systems, but their implementation to actual power systems, together with proper contingencies consideration continues to be scarce.
Based on these facts, this paper presents a novel methodology based on artificial neural networks, specifically multi-layer perceptron (MLP), and support vector regression (SVR), to estimate the voltage stability margin (VSM) using a validated database generated by Monte Carlo simulations. The proposal is applied to the IEEE 14 bus test power system.
The rest of the paper is organized as follows. A theoretical review of voltage stability assessment methodologies is presented in Section 2. Section 3 describes the proposed methodology that considers the database generation, data processing and considerations for machine learning training and testing. Moreover, Section 4 shows the application example and obtained results. Finally, the main conclusions are stated in Section 5.
THEORETICAL REVIEW
Voltage Stability definition
According to IEEE (Institute of Electrical and Electronics Engineers) / CIGRE (International Council on Large Electric Systems), voltage stability refers to the ability of a power system to maintain steady voltages at all buses in the system after being subject to a disturbance [7]. The phenomenon that occurs when the electric system is unable to meet demand with steady voltages under stress conditions is known as voltage instability. According to [8], the factors contributing to voltage stability are the generators’ reactive power limits, outage of any equipment (transmission lines, generators or transformers), load characteristics, characteristics of reactive compensation devices and the action of voltage control devices.
PV curves
PV curves are essential to analyze the voltage stability of an EPS. They allow finding the critical voltage instability point by increasing the power load until the power flow does not converge (stability limit), as shown by Amroune [9]. As demonstrated in [10], a methodology is proposed to determine the voltage profile power transfer limits of the monitored transmission corridors using the Thevenin Equivalent method and the determination of the PV curve in real-time. This allows voltage stability assessment in real time and constitutes an important basis for early-warning indicators. However, this methodology assumes the availability of phasor measurement units (PMU) at both sending and receiving ends of the transmission corridor, which is not always possible, Reddy et al. [11] and Lee and Han [12].
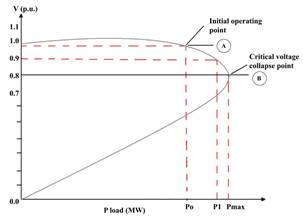
One of the most frequent terms related to voltage instability is the voltage stability margin (VSM), which corresponds to a measure of the distance from the initial operating point to the critical point, as illustrated in Fig.1. In the figure, voltages decay when there is an increase in the transmitted active power. The voltage stability limit is at the critical point (B), while the initial operating point (A) corresponds to a less loaded state. The curve above the critical point is known as the stable part, whereas the rest of the curve is known as the unstable part. In addition, if there is a change in the power factors of the loads, the curves also change because a new operating point of the system appears and thus a new voltage stability limit, as shown by Patiño and Limas [13].
According to Fig. 1, the VSM can be calculated using the initial operating point and critical point as:
Where:

Therefore, a high VSM value denotes a more stable EPS, since it can transfer more power until the stability limit is reached. On the other hand, according to [14], a low index value indicates the power transfer is limited because the system is more stressed, and therefore, the system is more prompt to voltage instability. A secure operation region definition, through the application of PV curves, is useful to operators when taking preventive or corrective measures in real time operation. In this sense, this range of limits is subjective because it is related to operating regulations, technical reports, operating experience, among others.
To give an example, the alert and alarm limits associated with voltage stability are determined by the approach adopted in [15], which shows how measurements from distributed PMUs can be combined with relevant transmission lines’ parameters, and be handled to detect forthcoming voltage stability problems in power systems at early stage.
In this paper, iterative power flow computations, based on the PowerFactory PV curve analysis module, is performed to create a VSM database [16].
Monte Carlo method as scenario generation tool
The Monte Carlo method allows, through successive deterministic power flows, to solve probabilistic power flows. The application of the Monte Carlo method for the analysis of probabilistic power flows allows considering the stochasticity of the system behavior with the purpose of performing a study closer to reality, as demonstrated in [17].
In stability studies, the Monte Carlo method has allowed the generation of multiple probable scenarios to determine system security indexes. In [18], a methodology is proposed to assess the load uncertainty impact on the transient stability of EPS based on probabilistic analysis of the Critical Clearing Time. Monte Carlo method has also been used to determine different operating conditions to establish voltage stability indexes of transmission lines.
In this paper, Monte Carlo simulation is applied to perform iterative simulations oriented to determine the VSM of several operating scenarios, including the n-1 security criterion. For this aim, the scripting capability of PowerFactory is used to iteratively control the PV curve analysis tool from Python.
Voltage stability assessment using machine learning techniques
There are different approaches for voltage stability analysis such as PV and QV curves, modal analysis, voltage stability indices (VSI) and continuation power flows (CPF). However, the application of these tools in real time to large SEPs is inconvenient due to the computational effort required by the high number of iterations related to the methods. That said, alternative approaches related to machine learning models (MLM) need to be explored to overcome this computational problem by interacting with technological tools, high-level programming languages and data mining. The ML includes many techniques such as artificial neural networks (ANNs), decision trees (DTs), fuzzy logic (FL), adaptive neuro-fuzzy inference system (ANFIS), support vector machines (SVMs), among others.
Machine learning is a branch of artificial intelligence that groups a set of methods for the creation of models that learn from data with the purpose of making a prediction or inference, as shown by Flach [19]. In this regard, an approach to estimate the VSM using artificial intelligence tools is presented in [20]. This methodology applies voltage stability indexes (VSI) calculated from synchrophasor measurements.
On the other hand, a new approach to estimate the voltage stability margin through the combination between a kernel extreme learning machine (KELM) and a mean-variance mapping optimization (MVMO) algorithm is presented in [21], where the Monte Carlo method is employed to build the database for model training and validation. A comprehensive review of the application of machine learning tools such as artificial neural networks (ANN), decision tree (DT), support vector machines (SVM), for power system studies, especially in cyber-attack detection, PQ perturbation studies and dynamic security assessment studies is presented in [22].
Machine learning algorithms are mainly split into two groups:
2.4.1 Supervised algorithms
These algorithms use labeled data sets to create a model that, using a vector of input and output features, predicts the label of the feature vector. Regression and classification are the two sub-groups associated with supervised learning. In this regard, artificial neural networks and support vector machines are used in this paper in their regression versions for predicting the VSM of the power system.
2.4.2 Unsupervised algorithms
These algorithms use an unlabeled dataset to find a final structure in the data, using only one set of inputs, as shown Echeverría [23]. The main purposes odd these algorithms are the data dimensionality reduction and clustering. In this connection, the principal component analysis (PCA) is used in this paper.
METODOLOGY
This technical work estimates the voltage stability margin of an EPS using machine learning tools and a database generated by Monte Carlo simulations. For this purpose, Python programming language and PowerFactory software are used. In the first stage, a validation of PowerFactory PV curves module using Matpower is performed. The stage two consists of database generation, data processing and machine learning algorithms application. Finally, VSM estimation and results analysis are performed in stage three. Fig. 2 schematizes the proposed methodology.

Stage 1: Matpower and PowerFactory
The validation of PowerFactory PV curves module using Matpower allows to establish the theoretical-technical support to implement the methodology of this study. This comparison is performed to verify how close to the nose of PV curves can be reached by the algorithm implemented in PowerFactory since it does not exactly accomplish CPF formal theory, whereas Matpower does. The standard IEEE 14 bus test system is used as a case study for this purpose.
Stage 2: Software development
The technical study aims to estimate the voltage stability margin from a validated database, considering machine learning algorithms. The following sections present the general procedure developed for database generation, data processing and considerations for the implemented algorithms.
Database generation
During the implementation of the simulation proposal, two processes are taken into account. The first process consists of generating the operational scenarios through communication between Python and PowerFactory. This process uses Monte Carlo method to generate multiple operating scenarios considering the variability of the load. For this purpose, optimal power flows (OPF) are first executed by PYPOWER. According to [24], PYPOWER is a power flow and OPF solver, which is a port of MATPOWER to the Python programming language.
On the one hand, the Monte Carlo method allows considering the uncertainty of the demand, while the optimal power flows are used to obtain a proper dispatch of the generation units. It should be noted that the use of OPF in the face of load variations allows solving the problem associated with congestion of transmission lines near the slack generator when only power flows are used.

Fig. 3 shows the procedure adopted for the generation of operating states, where the input data are: the operating states in DIgSILENT PowerFactory, the generating costs of each unit and the stochasticity of each system load represented by probability density functions (PDF).
On the other hand, the second process allows the calculation of the VSM from the PV curves obtained from each operating scenario, generated by Monte Carlo simulations. These stability margins are arranged in a large matrix relating the main system variables. In addition, a set of transmission lines is chosen for each system under study, and in this way, through programming, the "n-1" criterion is assessed at the time of executing a power flow or the PV curves module. In this connection, all the information, including the stability margin, is stored in pre-contingency and post-contingency data sets. The execution of this procedure developed in Python can be done directly in PowerFactory or through an external connection known as "engine mode", which allows the program to be controlled without the need for it to be open.
Data processing
The data processing is performed in the Python programming environment, due to its versatility when handling variables and the extensive documentation with respect to machine learning and data mining models. In this sense, the whole set of data obtained is structured and debugged to obtain the pre-contingency and post-contingency matrices, considering the individuals or samples by the number of rows, while, the features by the number of columns. The number of rows is set to 10,000 samples and the number of columns depends on the system or region of analysis (the features are the set of electrical variables that reflect the system steady-state of each operating scenario). After this, a reduction of the matrix dimensions is performed by means of PCA, considering that, in order to reduce the number of features.
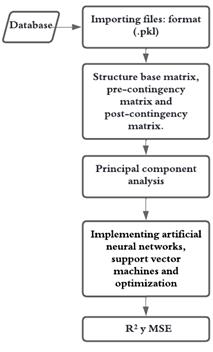
Once the files containing all the information from the base case, pre-contingency case and post-contingency case have been created, the data are processed so that they can be used by the machine learning algorithms and the models performance is evaluated, consequently. Fig. 4 shows the program flow chart for data structuring and processing.
Considerations
Artificial neural networks and support vector machines available in the "Scikit-learn" library (machine learning and data analysis library developed in Python programming language) are trained and implemented. The hyperparameters inside each model can be modified according to the specific documentation. It should be emphasized that, during the modeling of the regressors, the input variables are found in the pre-contingency matrix and the output variables are found in the post-contingency matrices, this approach will allow to properly perform the training and validation of the regressors. In addition, hyperparameters optimization of each model is performed using GridSearchCV, as shown Predregosa et al. [25].
Stage 3: Results
Finally, the obtained results are analyzed by calculating the mean square error (MSE) and the coefficient of determination (R2) for the purpose of assessing the performance of each regressor. According to [26], MSE shows the average squared difference between the obtained and predicted values. A value close to zero of MSE indicates that the model fits the data set properly. R2, on the other hand, quantifies the linear relationship between the obtained value and the predicted value. A value close to “one” indicates that the model presents an appropriate fit. The entire process is performed using cross-validation.
RESULTS - APPLICATION TO THE IEEE 14 BUS SYSTEM
The implemented algorithms are assessed through an optimization of the hyperparameters of each model, allowing to verify how well they fit the database. In addition, eight transmission lines are selected based on contingency analysis, to assess the “n-1” criterion. In this case, eight transmission lines were considered to calculate the VSM and to obtain the information of the pre and post-contingency system variables. For this reason, eight regressors were used. However, performance index results are only presented when transmission line “6-13” is out of service.
Fig. 5 shows the reduction of the voltage stability margin of the critical bus of the system, before and after the occurrence of the contingency. This demonstrates the capability of the system to adjust to the active and reactive power requirements.
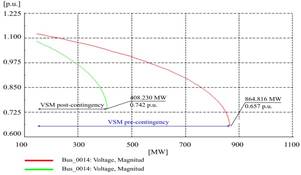
Table 1 shows the results for both the artificial neural network and the support vector machine. In this regard, for SVM, MSE gets worse when the optimization is applied since the error increases, while, R2 index, also gets worse due to the fact that it moves away from one. For these reasons it can be said that SVM does not correctly fit to the data set. Whereas, for ANN, MSE improves when the optimization is applied since the error is reduced, while, R2 index, also improves because it is closer to unity. As a conclusion, ANN approach fits better to the data set.
Table 1: Resultados de los índices de rendimiento - L/T 6-13
| Models \ Indexes | MSE | R2 |
| ANN | 0.07436 | 0.89741 |
| SVM | 0.07637 | 0.90199 |
| ANN - GridSearchCV | 0.06599 | 0.91531 |
| SVM - GridSearchCV | 0.13115 | 0.83171 |
The implemented models are adjusted depending on the established data set, i.e., the results obtained when the SVM is applied to the test system are not so efficient since it worsens the performance indexes. This can be justified by the outliers and the behavior of the system when calculating the stability margin by means of the PV curves. With this in mind, analyzing the case study, it is concluded that the best machine learning algorithm is the artificial neural network, since it presents a better prediction of the stability margin VSM post-contingency VSM pre-contingency before and after the optimizer. In addition, the proposed methodology was applied to the Ecuadorian National Interconnected System, demonstrating the robustness of the application and the improvement of performance indexes.
CONCLUSIONS
The machine learning model structuring requires to define the percentage of data to be used for training, validation and testing of the model. For the present case, 80% was for training and 20% for model evaluation. However, the use of validation data set causes a considerable loss of samples which affects machine learning, in that sense, cross-validation method was implemented to take advantage of the largest amount of data for the final assessment of the model.
The neural network and the support vector machine present adequate performance indexes to the voltage stability margin prediction. In particular, when the optimizer was used, R2 for ANN was 0.9153, and for SVM was 0.8317. Similar R2 results were obtained when the optimizer was not applied. However, when the optimizer was used, MSE for ANN was 0.0659, and for SVM was 0.1311. Therefore, the artificial neural network has the best prediction and therefore it is the regressor that best fits the data set of the tackled problem.
The load variability was performed through a percentage change in the loads, however, it is recommended to use daily load curves (industrial, commercial and residential) to know the real load behavior in a 24-hour time interval.

