


 Espanhol (pdf)
 Artigo em XML
 Referências do artigo
 Enviar este artigo por email
 Citado por SciELO
  Similares em
SciELO
Similares em
SciELO 
 Permalink
INTRODUCTION
Ecuador has great solar energy potential [1] [2], which is why the need arises to obtain the greatest amount of irradiance on an inclined surface, for this purpose, it is necessary to determine the optimal inclination and orientation of the photovoltaic panel. To obtain the inclination parameters as orientation, it is necessary to consider a solar model, for the document the Liu & Jordan solar model is presented, from which values very close to real ones are obtained.
There are authors who have seen the need to determine the highest irradiance uptake on the solar panel, mainly using the Liu & Jordan model, for this, it is of great importance to carry out the study of a certain place or region in order to determine the optimal conditions of inclination, for each geographic location of study [3].
In [4] the optimal search for the inclination and orientation of the photovoltaic panel is carried out using mathematical models and software such as ArcMap, IBM SPSS Statistics and Matlab. Additionally, once the angles have been defined, the validation of the Liu & Jordan solar model is performed by comparing it with other solar models, showing that this model and the compared models give very similar irradiance values.
In [5] the optimal orientation and inclination for Luján are presented by comparing three models: the diffuse isotropic of Liu & Jordan and the anisotropic of Klucher and Reindl, where the inclination of the panel was set at 45 ° towards the four cardinal points. After this, obtaining a comparison is made with the values measured at the University of Luján.
In [6], the research focuses on the study for the location of Salto, Uruguay. Where they are compared with several solar models to determine the incident irradiance values on an inclined surface, determining that the optimal orientation should be towards the equator to allow the greatest capture of incident irradiance on the panel.
As it can be seen in the documents analyzed, these works focus on the irradiance obtained specifically with the Liu & Jordan model, in this model, dirt is not taken into account, this being another factor that affects power. The amount of dirt depends on the climatic conditions of the site where it is located, that is if the place is desert, humid, cold, etc. [7] - [9] As there is variation in climatic conditions it can increase or decrease the level of dirt. The transmittance of the glass is determined with the relationship between the dirtier the usable irradiance will decrease in the photovoltaic panel, therefore the usable power to feed a certain load will decrease [10], [11].
This analysis of dirt [12] - [14] is carried out in desert conditions and how they affect the impact on the efficiency of the panel based on trial and error, showing that for desert situations such as Pakistan, Qatar and Rabat the losses become very high. Large dirt impacts on the panel occur in large urban areas [15].
Additionally, a natural effect of great importance based on the climatology of the place to be studied is dew, which is nothing more than the humidity of the atmosphere that condenses at night and early morning, causing small drops of water to be generated that settle on the panel. This climatic phenomenon can be unfavourable in desert conditions where when it joins the dust, it turns it into the mud, dirtying the panel even more [16], this does not happen in the urban environment (case study) where when it condenses, it will serve to clean the dirt deposited on the panel [15] [17].
Based on the foregoing, this document is based on the Liu & Jordan model and the variables previously described with the mathematical formulation to determine the optimal solar generation conditions [1] [18].
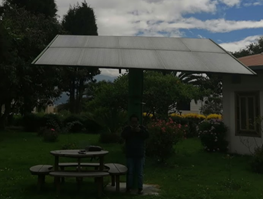
The study location is in Ecuador, Quito city, specifically in the Salesian Polytechnic University (South Campus), where it is necessary to determine all the aforementioned variables for greater use of the photovoltaic panels of the Simax brand (Suzhou) model SM572-190 with a power of 190 Wp since in the datasheet it can only be observed under standard conditions, which differs greatly from reality because the amount of radiation and temperature varies with the location, time and weather station. [19]
This analysis will be expanded by first calculating the inclination and orientation with Liu & Jordan, then the dirt, temperature and humidity factor is added. Finally, the results obtained are shown in comparison with the data measured in the Salesian Polytechnic University
PHOTOVOLTAIC ENERGY
The sun is the main source of generation of all types of energy [20] whose central axis lies in the use for conversion of electrical energy through the photoelectric effect which bases its operation on converting solar radiation into electrical energy by means of devices semiconductors (photovoltaic cells). These cells are built on the basis of silicon that must add impurities of chemical compounds such as phosphorus and boron [21].
The cells constitute the photovoltaic panel. The output current in the panel is given by the incident global radiation as already mentioned [20].
Solar Geometry
In our solar system, the earth describes the translational motion (it revolves around the sun) and the rotational motion that rotates on the axis of the sun. In the first movement the earth moves around the sun forming an ellipse, this movement lasts 365 days (one year), it is important to take this movement into account since the geometric shape formed between the sun and the earth is the same, having a variable distance [2] [10].
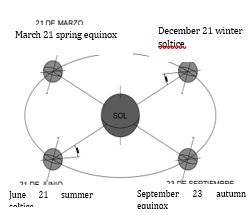
Declination angle (δ)
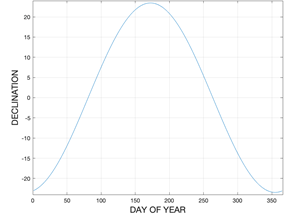
It is related to the rotational movement, it is the one that rotates on its polar axis, and is perpendicular to the equatorial plane. In this way, the deviation of the axis of rotation can be determined and it is given at an angle that can take values from -23.45º to 23.45º at what is known as the angle of declination at this angle, it is necessary to mention that it does not depend on the place of study if not the day of the year and hence its variation is given by the following equation [4] [22].
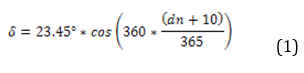
Where:
dn = number of the day of the year. δ = angle of solar declination. 360/365 = conversion factor of the day of the year in an orbit position. 23.45 ° = angle of inclination of the earth about its own axis of rotation. 10 = Value taken since the winter solstice begins before the beginning of the year.
Daylight angle (ω)
It is the displacement that the sun makes on the equatorial plane, it is characterized by being negative in the morning and positive in the afternoon, and its increase is 15º for each hour. To calculate this angle, we will use the equation: [10]
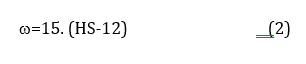
Where:
HS = Hour of the day
Latitude (ϕ)
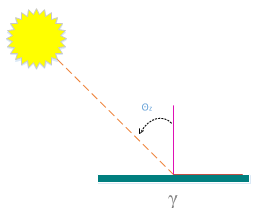
It is the angular measurement that originates from the equatorial line, that is, the measurement from this axis to any point on planet earth. It varies from 0 to 90 ° towards the north pole and from 0 to -90 ° towards the south pole [4] 2.1.4 Ángulo azimutal (γ)
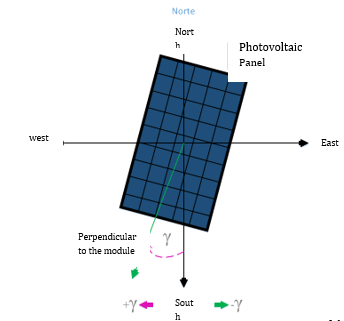
The azimuth angle is the orientation in which the photovoltaic panel is going to be directed, it is measured clockwise forming an imaginary circumference on our axis, this circumference will be represented by the four cardinal axes (north, east, south, west) taking values of 0º, 90º, 180º, 270º and 360º respectively. Its representation for this document will be the letter of the Greek alphabet γ [4]
Dirt in panels
One of the factors that negatively affect the efficiency of the panel is the accumulation of dust deposited on them [10]. There are several studies where it is evidenced that in desert places the losses caused by dust become too high, up to 40% of energy production [23] [24] unlike an urban environment that on average becomes 8% [10].
The accumulation of dust considerably affects the transmittance causing the irradiance that enters the panel to be lower, a practical way to calculate its efficiency is determined with experimental values that are given by the ratio of the irradiance of the dirty panel on the irradiance when the panel is clean [10].
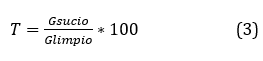
Where:
T = Transmittance.
Gsucio = Irradiance in dirty conditions.
Glimpio = Irradiance under clean conditions.
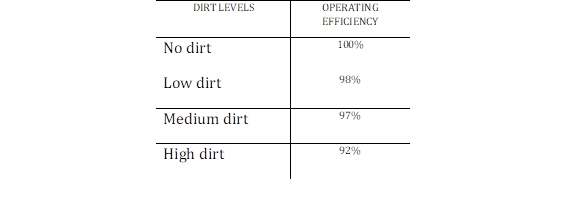
The quantification of the amount of dirt or dust deposited on the photovoltaic panel is very difficult to determine exactly because each geographic location has different climatic conditions [13]. For this case study, it is located in an urban area where the efficiency will be determined dividing it into four groups as detailed in table 1
Dew as a cleaning factor
Dew is the droplets produced by the condensation of moisture, in urban environments it helps to clean the panel, however, it is not enough for the cleaning in its entirety, these droplets that when drying leave a circular mark leaving the panel somewhat dirty, affecting it as we can see in Fig. 4.
Fuente: [15]
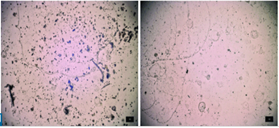
In places where there is not abundant dust, the dew provides the phenomenon of self-cleaning, but in desert places where the accumulation of dust is abundant is a detrimental factor since they join with the deposition of dust on the panel generating a layer of mud that when drying it solidifies preventing radiation from hitting the panel [16][25].
Irradiance
Solar irradiance is the power of radiation from the sun that hits the plane for each square meter (m2), its units of measurement in the international system are (W / m2), It is of utmost importance for photovoltaic systems in the stage of design since it is possible to estimate the power that a solar park can deliver [20] [26].
In several documents, irradiance is called by the letters It, which is the sum of direct irradiance (Iβb) plus diffuse irradiance (Iβd) and plus reflected irradiance (Iβρ), as shown in equation (3) [20] [26] [27].
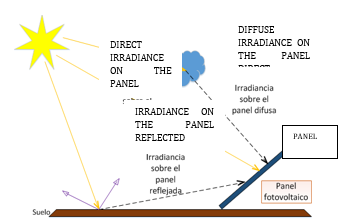
Direct irradiance (Iβb)
It is the amount of radiation that comes from the sun in a straight way, that is, it has no deviation or a solid body that prevents or deviates its path in this path [10].
Diffuse irradiance (Iβd)
Also known as indirect radiation, it represents the irradiance that does not arrive directly since after passing the atmosphere and clouds it causes the irradiance to disperse. According to [26] it determines that the indirect irradiance on days when there is no high amount of clouds represents 15% of the global irradiance but on days that are gloomy it increases considerably [27].
Reflected Irradiance (Iβp)
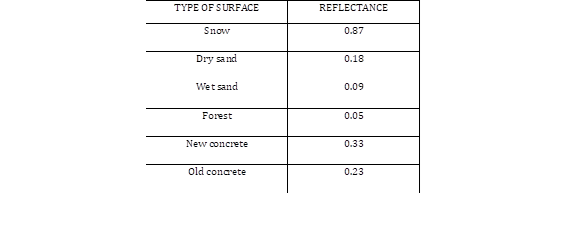
It is the amount of radiation that is reflected on the ground, this component is small, for some calculations, it is neglected. The reflection coefficient is called albedo, which varies depending on the reflective characteristics of the ground and the materials that surround it, taking a value of 1 for surfaces that are completely reflective, 0.8 for surfaces where there is snow, 0.1 for surfaces where the colour is opaque. u dark and 0.2 on surfaces that contain vegetation or grass, which is the case of study, so the photovoltaic panels of study are located in a place where there is vegetation [26].
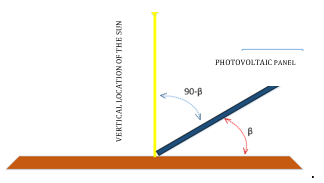
Photovoltaic panel inclination (β)
Ecuador has a large uptake of the solar resource, several documents have been dedicated to research on the optimal angle, all reaching the same conclusion that it does not need inclination, but for cleaning purposes, if it is convenient that it has a slope of fall like what says in [28]. In Ecuador, in the city of Ibarra, tests were carried out at 0º, 5º, 10º, and 15º concluding that the optimum angle of inclination should be the closest to 0º. [29]
The basis of this research is carried out in the city of Quito at the Salesian Polytechnic University, taking the recommendations of the studies carried out previously, avoiding generating unnecessary data, an appropriate value of the β angle will be taken considering the geographical location, which is why the following equation it is based on statistical data of annual radiation at different sites and different inclination angles. [30]
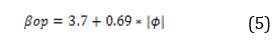
Where:
βop = suitable angle of inclination (degrees).
| ϕ | = latitude of the place, unsigned in degrees
LIU& JORDAN SOLAR MODEL
Solar energy has shown a considerable increase in recent years, with which it is a priority to be able to calculate the solar radiation that affects a photovoltaic panel and thus be able to determine the resulting power that the photovoltaic system will deliver, that is why several models have been studied solar systems in various documents, but for this case the Liu & Jordán model was considered the most appropriate because it allows a real approximation with few variables while maintaining a very small margin of error compared to the field measurement [31].
However, the correct angle of inclination must be known, here the variation necessary to determine it is presented, it should be noted that Ecuador has a great possibility of solar generation due to its geographical location, the panels can be placed with an inclination of 0º but it is unfavourable since Not having an angle of inclination lends itself so that dirt is deposited on them, requiring a more frequent maintenance plan, and if not, efficiency would be lost due to loss of transmittance due to the deposited dirt [28].
The inclination and orientation should be considered as one of the main parts since these determine the amount of radiation that the panel can capture, this solar model allows by means of correction coefficients to determine the global irradiance on an inclined surface since all the bases of Available data provide information on a horizontal surface [28].
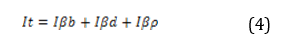
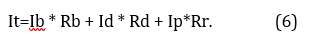
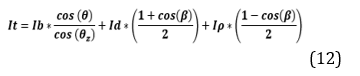
The sum of the three irradiances are for horizontal incidence surfaces, in this case, it is necessary to study correction factors for an inclined surface described in equation (4) based on the Liu & Jordan model. [4] [6]
Where:
It = It is the total irradiance on the photovoltaic panel
Ib = It is the horizontal direct irradiance
Id = It is the horizontal diffuse irradiance
Iρ = It is the horizontal reflected irradiance
Rd = Geometric component for diffuse irradiance.
Rb = Conversion component for direct radiation on a horizontal surface
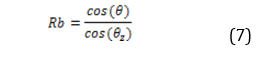
Geometric conversion factor of direct irradiance (Rb)
It is the relationship that exists between the irradiance on the inclined surface and the horizontal surface [32]. The geometric factor of direct irradiance on an inclined surface can be established as [5]
Where:
Rb = Geometric conversion factor of direct irradiance.
cos (θ) = Horizontal angle of incidence.
cos (θZ) = Zenith angle.
The angle of incidence on the surface depends on several factors as described in equation 8.
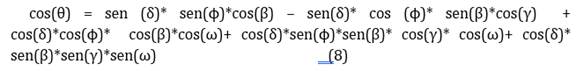
Where their components are as listed: δ the solar declination, ϕ latitude, β angle of inclination of the panel, γ angle of orientation or azimuth and ω is the hour angle. Under this assumption for the zenith angle, we will consider that the orientation (γ) and the inclination (β) is 0 °. [33]

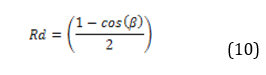
Diffuse irradiance geometric conversion factor (Rd)
This factor is a part of the diffuse radiation from the horizontal surface on the inclined panel [4].
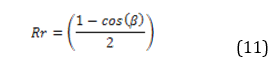
Reflected irradiance geometric conversion factor (Rr)
This factor assumes that direct and diffuse radiation are reflected in the ground in an isotropic way, that is to say, that the irradiance reflected in the ground will affect the photovoltaic panel and it can be determined with the following equation: [5] [22].
Once the geometric factors for correction of the inclined surface have been decomposed, our mathematical model by Liu & Jordan is as follows:
SOLAR MATH MODELING LIU& JORDAN
Optimization pseudocode
Step 1:
Begin
Variables: lat, long, idirec, idif, iref,alb
Step 2:
Print “Ingrese latitud (lat)”
Read lat
Print “Ingrese longitud (long)”
Read long
Print “Ingrese irradiancia directa (idirec)”
Read idirec
Print “Ingrese irradiancia difusa (idif)”
Read idif
Print “Ingrese irradiancia reflejada (iref)”
Read iref
Print “Ingrese albedo (alb)”
Read alb
Step 3:
Calculate Rb with [ δ=0:365;βop=0:90;γop=0:360;ω=-180:180 ]
Si βop>10°
Calculate Rd with [β=βop]
Calculate Rr with [β=βop]
Opposite Case
Calculate Rd with [β≥10°]
Calculate Rr with [β≥10°]
Calculate Itop=idirec*Rb+idif*Rd+iref*Rr*alb
Step 4:
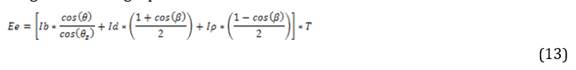
Calculate Ee=Itop* T
If β<10°; Teff=92%
Opposite Case
If 10°>β<25°; Teff=97%
Opposite case
If 25°>β≤90°; Teff=98%
Eeop if β≥10°
Step 5:
Isop=Isc,ref*Itop/1000*(1+αIsc(Tc-To))
Impop=Imp,ref*Isop/(Isc,ref)
Step 6:
Vocop=Voc,ref+s*∆Tc*ln(Eeop)+βoc(Tc-To)
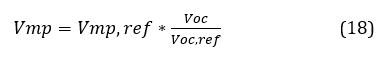
Vmpop=Vmp,ref*Vocop/(Voc,ref)
Step 7:
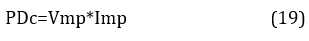
PDcop=Vmpop*Impop
Step 8:
End
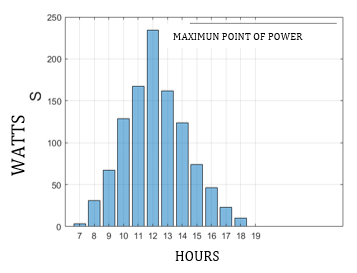
With this algorithm, the optimum power point of the photovoltaic panels understudy will be determined, a total of 10 panels as shown in Fig. 8.
The methodology starts with the amount of irradiance that affects the photovoltaic arrangement in which equations (12) and (3) are joined to obtain an effective irradiance value in which the accumulation of dust or dirt is related, leaving the following equation
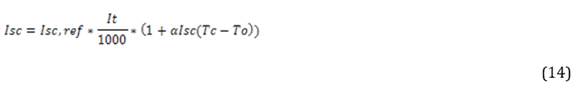
Once these irradiance values have been obtained, the temperature of the site is fundamental for determining the maximum power of electricity generation, this will vary in terms of the amount of solar radiation and temperature of the panel [27] for the above, it is necessary to use the following equations where, with the help of the panel technical sheet [19] and site conditions, the maximum power point is determined according to the climatic conditions at our study point.
Where:
Isc = Actual short-circuit current
Isc, ref = Short circuit current in datasheet
It = Irradiance on the inclined plane
αIsc = Short-circuit coefficient
Tc = Cell temperature.
To = Temperature under standard conditions
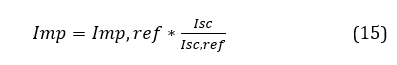
When the real short-circuit current is obtained, the maximum power current given by the following equation is calculated.
Where:
Imp, ref = Maximum reference power current
Afterwards, it is necessary to calculate the open circuit voltage value, it must be calculated as:
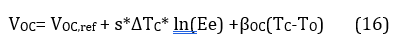
Where:
Voc, ref = Open circuit voltage for reference
s = Number of PV cells connected in series
∆Tc = Thermal Voltage
For the calculation of Voc it is necessary to calculate the thermal voltage that is given by the following equation:
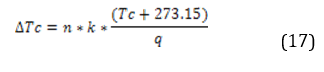
Where:
n = Diode factor
k = Boltzmann constant 1.38066E-23 (J / K)
q = Elemental charge 1.60218E-19
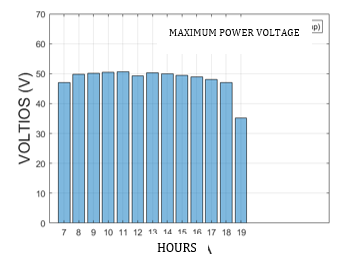
Like the current, it is necessary to calculate the maximum power voltage described by equation (18).
Based on equations 15 and 17, we proceed to calculate the power that will be delivered to the output of the photovoltaic cells defined as:
RESULTS
Equation (5) allows us to calculate the appropriate inclination of the panel according to our geographical location, however, a more in-depth study has to be carried out since this equation does not study orientation parameters, dirt, temperature, etc. Once this is mentioned, this equation is used to have a fairly good approximation to determine the appropriate angle of inclination.
Once calculated, it is ratified that, for Ecuador, the optimal inclination must be as close to 0. But the panel cannot be placed at 0 degrees, which would facilitate the deposition of dust, for the case study values of 0 ° are taken at 15 ° to determine the maximum power point considering all the variables mentioned above.
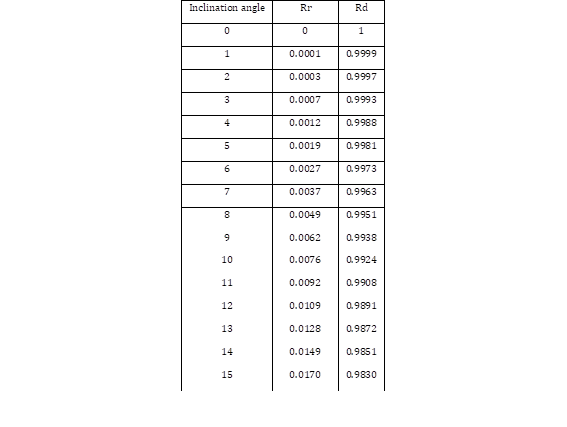
The geometric factors of diffuse and reflected irradiance depend directly on the angle of inclination, the values to be used are observed in the following table.
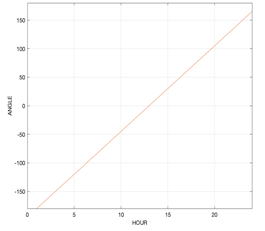
The solar hour angle (ω) reaches a minimum value hours before and after noon than in Ecuador, at this time the amount of usable radiation is greater, then the angles increase with a positive or negative sign as shown in Fig. 9, but for our modelling we are going to take values from 7:00 a.m. to 7:00 p.m., these values are taken by the solar databases of NASA and PvGis of Europe that indicate an average of hours that Ecuador receives solar radiation usable 12 hours.
Another necessary parameter for the calculation is the latitude and longitude, the South Campus Salesiana Polytechnic University is located at latitude -0.28339 and longitude -78.54959. Regarding the value of albedo, NASA provides monthly values, to determine the maximum power point, the average value of 0.19 is found.
Based on the mentioned values and data provided, the third geometric conversion factor necessary to proceed to estimate the amount of solar irradiation on the study site is obtained, after obtaining the value of the Rb factor, equation (12) is applied with the different variations to be able to estimate the appropriate orientation and inclination.
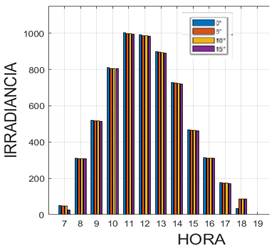
For our study site, we begin to notice a decrease in irradiance at 15 ° as shown in Fig. 10, however, it must be taken into account that the larger the photovoltaic park, the more notable the irradiance losses that will be seen. reflected in the delivered power, for which a 10 ° inclination is considered for the place, this eliminates the possibility of deposit of particles or water that reduce the efficiency of the panel.
Another study factor for maximum irradiance uptake is the orientation of the panel, the four cardinal points north, south, east and west are taken as a case study, showing that in Quito-Ecuador, specifically in the study place, losses are negligible. caused by the variation of the orientation (azimuth), as can be seen in Fig. 11. In this comparison, the variation of the inclination from 0 to 15 degrees in the 4 cardinal points was taken into account.
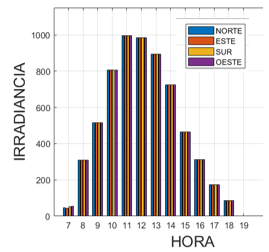
The angle and orientation for the case study have been determined at 10 ° and an orientation towards a north azimuth of 0 ° being the most optimal for our site, with these data we proceed to calculate the short-circuit current, shown in Fig. 12 that the greater the irradiance, the greater the short-circuit current and this, in turn, is reflected in the maximum power current (Imp), since in the datasheet voltage values, coefficients are tested under standard circumstances of 1000w / m2 and at a temperature of 25 ° Celsius, which varies for each geographic location and weather station.
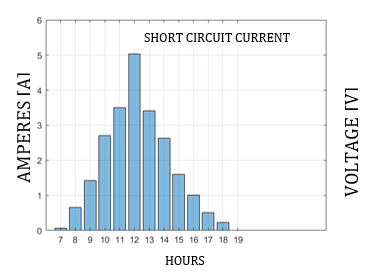
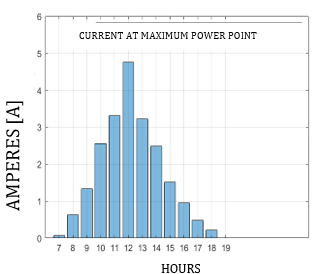
The short-circuit current (Isc) and the current of the maximum power point (Imp) are similar as seen in Figs. 12 and 13, but for the calculation of the optimum powerpoint, the Imp is taken. It is necessary to calculate the maximum power voltage, for which the real open circuit voltage is calculated, which depends on variables such as temperature and dirt (Fig. 14), for Quito the average temperature is maintained in a range of standard conditions which is favourable Due to the higher temperature its voltage decreases and due to the proposed inclination of 10 °, natural gravity allows any dust or dirt particle to fall to the floor, in addition to this, the spray factor that occurs in the early morning helps cleaning while they fall. water droplets due to inclination, the location under these considerations has a low dirt efficiency of 98%.
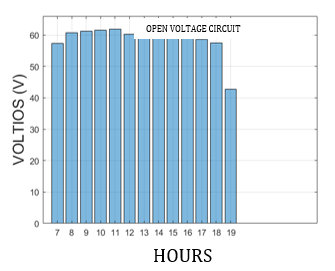
In Fig. 14 the variation of the voltage in open circuit in real conditions is observed, equation 16 is used which depends on temperature, irradiance and dirt deposited on the panel.
Once the Imp and Vmp have been obtained, the maximum power point can be obtained, which is nothing more than the multiplication of the two factors mentioned as indicated in equation 19.
Once all the required values have been obtained for both the Liu & Jordan model and the calculation of power with all the variables that considerably influence the efficiency of the panel, the comparison of energy supplied with the panels installed at the Salesian Polytechnic University is carried out. The irradiance data are taken from the aforementioned solar databases which are for horizontal surfaces, hence the importance of the Liu & Jordan model with the geometric correction factors for different orientation and inclination angles, additionally energy data is taken supplied from the energy meter located on campus, orientation and inclination data using a compass and inclinometer, temperature values provided by the university from its meteorological base. Once the simulation and data collection has been carried out, the current installation is compared with the optimal requirements.
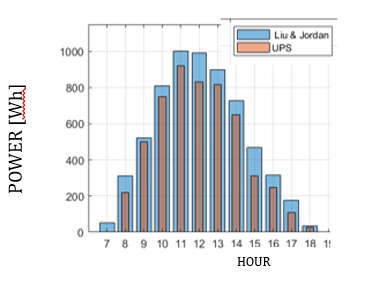
In Fig. 17, it can be seen the comparison of energy supplied by the photovoltaic panels currently installed in the Universidad Politécnica Salesiana and the energy after the calculation of optimal conditions based on the proposed solar model, that is, the amount of energy capable of delivering the photovoltaic panel would increase after making the necessary adjustments in the study photovoltaic park.
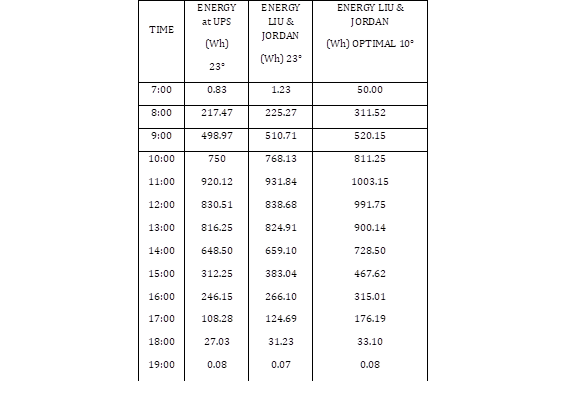
Finally, based on Fig. 17, the importance of carrying out an investigation with an appropriate solar model can be determined, it is considered that Liu & Jordan is a model that is quite approximate to real values as shown in table 4, where the values obtained are detailed. with mathematical modelling and physical installation, being quite similar. Finally, the installation is then compared in optimal conditions, allowing us to observe that a greater amount of power can be used. For optimal conditions, several degrees of inclination were taken as indicated in Fig. 10, additionally, all these degrees of inclination in different orientations are considered as indicated in Fig. 11.
CONCLUSIONS
Based on the results, an adequate study of the inclination and orientation of the panel is necessary to capture the maximum possible irradiance, for which in the case of study an optimal orientation value is obtained as close to 0 °, in [29] and [4] also suggest it this way, but it is also necessary to take into account the dirt and accumulation of dust, for this reason, it is concluded that the appropriate inclination should not be less than 10 °.
Based on the irradiance calculations it is shown that for the geographical location of Ecuador the most usable hour of solar irradiation is at noon, this is because the solar rays fall perpendicularly on the solar collector allowing it to receive the greatest amount of radiation solar and does not spread around the site.
The solar hour angle (ω) for our model goes from 7:00 a.m. to 7:00 p.m., which is the approximate time that it receives usable solar radiation, so it could be observed that at noon this angle tends to zero, but it is the moment in which the global irradiance on the panel is greater, determining that the smaller the angle of the solar hour, the greater the incident irradiance will be.
In works such as [16] and [13] they are desert places with great solar potential, however, the dew is an unfavourable aspect for desert places in which said condensation generates that with the high amount of dust it mixes and ends up making mud. which dirties the panel reducing the output power capacity, in the study [15] it is an urban location similar to the one studied in this it can be observed that, like Ecuador, they generate a self-cleaning effect when they are at an optimal inclination that allows by gravity the drops of waterfall with the dust particles, however, it is necessary to have a maintenance plan for cleaning them.
FUTURE WORK
Based on the research developed, it is suggested that the investigation can be expanded by geometrically determining the effective hours of the site, for our case study we take it from NASA, but calculating it mathematically will be able to obtain a more realistic approximation. It is also suggested to expand the investigation with the amount of pollution produced by vehicles that run on fossil fuels.

