


 Spanish (pdf)
 Article in xml format
 Article references
 Send this article by e-mail
 Cited by SciELO
  Similars in
SciELO
Similars in
SciELO 
 Permalink
Introduction
In general, companies have two great strategic alternatives to differentiate themselves from the competition and occupy a preferential position for the selection of customers: minimize costs or increase quality. Quality management according to associated management models must have a group of variables that consolidate it or ensure it relative to: senior management, resource management, human resource management and document management and process management (Escrig & de Menezes, 2016; Sfakianaki & Kakouris, 2020; Aguilera-García et al., 2022).
According to Krishnan et al. (2020), micro and small enterprises (MSMEs) have a significant representation in relation to the percentage of total companies in most countries. In the USA, they represent 52 % of total employment and are approximately 99 % of commercial companies, in the European Union about 66 % of jobs are provided by MSMEs. Similar behavior, although to a lesser extent (between 30 and 50 percent) is shown by the Asia Pacific region.
The criteria established for classifying a company as SMEs vary from country to country. In the USA, companies with up to 500 workers can be considered SMEs, in Europe up to 250, while in Ecuador they are limited to 49 workers. In Ecuador, in addition, these are classified according to the volume of sales they generate, which can be confusing given that both criteria can be met and not (Krishnan & Scullion, 2017; Golla, 2018).
Due to its dimensions, it is obvious that the forms of management of MSMEs must be modified and made adjustments. Therefore, several investigations (Sfakianaki & Kakouris, 2020; Sternad et al., 2019) are oriented to the analysis of these particularities. Not everyone recognizes that the tools and methods designed for large companies do not work in the same way in the conditions of SMEs, which by their nature are different.
This research aims to characterize in what measures the quality management practices of MSMEs in Ecuador differ or resemble the practices of this discipline in medium and large enterprises.
Literature Review
Quality management is approached from three main perspectives: (1) that of the quality theorists, supported by the proposals of its founders such as Juran, Deming, Ishikawa, Feigembaun and that was evolving until what is now known as the Total Quality or Total Quality Management (Tejaningrum, 2019; Toke & Kalpande, 2020). (2) That of quality awards, a mechanism adopted by countries, regions or organizations that have sought to promote quality. Among these awards, the Deming Award stands out (Breja et al., 2016; Titu & Bucur, 2016), which is considered one of the forerunners of the rest and others of long existence over time such as the EFQM Excellence Award (Escrig & de Menezes, 2016) and the Malcom Baldrige Award (Sutapa et al., 2016). And (3) that of quality standards, where the ISO 9 000 family of Standards stands out due to its scope and geographical extension (Klute-Wenig & Refflinghaus, 2020).
Taking into account the literature reviewed, it was possible to identify the variables that ensure quality. The variables identified, from the positions of various authors, were evaluated by experts (11 PhDs with more than seven years of experience in research related to quality and tourism, and more than two high visibility publications), to verify the relevance of the same in the context of this research ( Table 1 ).
Table 1 Variables addressed for quality management.
| Varia-bles | Analysis perspectives | Expert acceptance percentage | ||||
| TQM | EFQM Award | Deming Award | Baldrige Award | ISO 9001:2015 | ||
| Management | Shewart Cycle (PDCA). Policies and objectives. Road map. | Leadership and coherence | Policies | Leadership | Leadership principle. Policies. Responsibility and authority. Improvement. | 100 |
| Human resources | Training and motivation. Responsibility for errors. Organization for quality. Education and training. | Development and involvement of people. | Organization. | Organization and people learning. Employee participation and development. | Principle of commitment of people. Competencies. Awareness raising. | 100 |
| Documentary system | Product and process design. Quality records. | Management by facts. | Future plans. | Fact-based management. | Fact-based decision principle. Documentary information. | 90.9 |
| Resource management | Relationship with suppliers. Supplier Evaluation. | Development of alliances and resources. | Improvement activity. | Innovation management. | Relationship management principle. Resources. | 90.9 |
| Process management | Quality tie or life cycle of products. Total control. | Process management. | Development of human resources. | Orientation to results and generation of value. | Process approach principle. Operation (quality loop processes). | 90.9 |
| Quality improvement | Market research. After-sales service. | Orientation to result and customers | - | Customer focus. | Customer focus principle. | 90.9 |
| Authors that ddress it: | (); () | () | (); (); Bucur (2017); () | Mohammad and Oduoza (2019) | (); () | |
Source: Own elaboration.
Srinivas et al. (2019) carried out a confirmatory factor analysis to identify the factors that condition the success of quality management in SMEs in which they identified as key factors the following: commitment and leadership of senior management, training of workers, supplier management, focus on customer satisfaction, process management.
Although research on quality management in micro and small companies is abundant, they are complex to generalize considering that the definition of Micro and small enterprises is varied and, according to the criteria of Sahoo and Yadav (2017), they vary from according to the behavior of variables such as: location, size, age, structure, organization, number of employees, volume of sales, value of assets, ownership through innovation and technology.
Specifically, in the context of India, multiple investigations are reported (Aich et al., 2018; Basu et al., 2020; Czajkowski, 2017; Gopinath et al., 2018) that seek to characterize the variables that influence the quality management of SMEs and, for the most part, the variables addressed correspond to the dimensions presented in Table 1. However, the results obtained by these are not possible to generalize since the definition of SMEs in India does not correspond to the context of this investigation. Similarly, other investigations developed in SMEs in Pakistan reported (Imran et al., 2018a; ) that address the same identified variables and incorporate others such as: innovation, proactivity and assume the risk by identifying a positive correlation between their behavior and the export level of the companies studied. An important and recent conclusion that was found in research aimed at characterizing quality practices in SMEs is that formulated by Toke and Kalpande (2020), which is associated with the need to develop a quality management model of its own to the SMEs.
A study with a similar purpose to that of this research was developed in Namibia (Mutingi & Chakraborty, 2018), considering variables related to the direction and management of human resources and the variables of measurement, control and improvement (Garro, 2020). This research found that the application of quality management practices is generally low. Similarly, Yang (2020) affirms that SMEs tend to possess several characteristics that constitute causes of resistance to the implementation of quality activities. Among them: low degree of standardization, lack of qualified personnel, Senior managers are results-oriented with little awareness of quality and limited financial resources.
Some researches (Kakouris & Sfakianaki, 2019) have delved into the factors that serve as stimuli for SMEs to implement quality management systems in accordance with ISO 900 1 standards, identifying as a fundamental factor that encourages certifications: the export orientation of the SMEs. Similarly, Majumdar et al. (2019) analyze the variables that limit quality management in SMEs, among which stand out: the number of workers, their attitudes and skills, financial availability and commitment to the quality from top management. Similar results were reported by Sternad et al. (2019) in research carried out in Austria.
Chiarini (2019) reports the results of a study in Italian companies where he sought to delve into the causes of abandonment of the intention to certify quality systems in accordance with ISO 900 1 in SMEs, in which he found that among the causes that affect the most are: the lack of commitment from senior management and systems for measuring the quality of services. A similar investigation was carried out in Greece (Sfakianaki & Kakouris, 2020) according to which the main obstacles are associated with bureaucracy, lack of guidance from senior management, demands on time and resources and the ability to the employees.
A study developed by Georgiev and Ohtaki (2019) on the application of quality variables in Japanese companies is highly related to the variables summarized in Table 1, and found that there are no significant differences in quality management among SMEs and large companies with regard to variables associated with senior management and human resources. However, differences were observed in variables associated with financial availability and technology availability. Furthermore, it should be noted that in the context of that investigation an SME could have up to 200 workers.
Materials and Methods
In conducting the study, the following steps were followed.
Design of research instruments
To characterize the degree of development of quality management in the organizations under study, a group of items were established to evaluate the degree of presence of these in the organizations. The items were established in correspondence with the dimensions and variables observed in the referential framework (Table 1), as well as some requirements expressing the degree of development of the activity.
Table 2 shows a summary of each of the items defined by functions. The degree of presence of each of these items and variables was evaluated by applying a questionnaire to each of the entities selected for the study.
Table 2 Set of variables to evaluate.
| Perspective | Variables | Perspective | Variables |
| Management responsibility | Leadership recognition for quality | Human resources management | Definition of the qualitative requirements of the personnel |
| Existence of a quality strategy | Workers are selected considering the impact on quality | ||
| Existence of a cost strategy | There is a staff training system | ||
| Definition of quality policies | Existence of a reward mechanism associated with quality | ||
| Definition of quality responsibilities | Performance Evaluation considers quality results | ||
| Definition of quality objectives | |||
| Resource management | Contracts with: Quality specifications Forms of quality assessment Resolution of discrepancies | Process management | They study the market to know the expectations and needs of customers |
| Product design is formalized | |||
| Supplier Evaluation | They apply corrective measures of the process | ||
| Selection of suppliers | The design and use of the documentation is reviewed and updated | ||
| Documentary system | There is a quality manual | Measurement, analysis and improvement | There is a quality inspection system |
| There are procedures | Customer satisfaction is measured | ||
| There are quality records | Quality improvement programs are applied |
Source: own elaboration.
Definition of the population and the sample
To establish the sample size, the typology of companies as different populations was taken into account since each one has different characteristics from each other, in determining the sample size, Equation 1 was applied.
 Equation 1:
Where:
N: population size
p: probability of success (0.5)
q: probability of failure (0.5)
e: investigator error (5 %)
z: constant of the normal distribution: 1.96 for the 95.5 % confidence level.
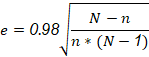
It was not possible to carry out the study in all the companies foreseen for the size of the product sample to which many companies did not facilitate access to the information, which is why the real value of the researcher’s error (e) was calculated from of equation 2. As can be seen in Table 3 , in all cases an investigator error of less than 10 % is ensured, which is considered admissible.
 Equation 2:
Table 3 Composition of the population and the research sample.
| Type of enterprise | Population | Sample | Real value of e | |
| Plan | Real | |||
| Micro | 773 772 | 384 | 380 | 0.05 |
| Small | 41 647 | 381 | 327 | 0.05 |
| Medium | 6 344 | 363 | 194 | 0.07 |
| Large | 1 242 | 294 | 91 | 0.10 |
| Total | 823 005 | 1422 | 992 | |
Source: Own elaboration.
Table 4 characterizes the composition of the general sample by productive sectors of the economy. As can be seen, there is a predominance of the services and commerce sectors, which corresponds to the general structure of companies in Ecuador and other countries.
Table 4 Composition of the sample by productive sector.
| Productive sector | Micro | Small | Medium | Large | Total | Percentage |
| Agriculture | 4 | 32 | 22 | 11 | 69 | 7 |
| Production | 3 | 21 | 37 | 28 | 89 | 9 |
| Commerce | 139 | 79 | 38 | 22 | 278 | 28 |
| Construction | 0 | 4 | 9 | 7 | 20 | 2 |
| Services | 234 | 191 | 88 | 23 | 536 | 54 |
| Total | 380 | 327 | 194 | 91 | 992 | 100 |
Source: Own elaboration.
Processing form design
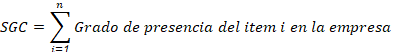
The information analysis started from analyzing the relationship between the level of development of the activity and the company’s life time (age). For this analysis, the activity development value was determined from the degree of presence or not of each of the variables evaluated for this Equation 3 was used.
To analyze the relationship between the variables, the Pearson R2 correlation coefficient was used. Subsequently, we proceed to characterize the degree of presence of each of the perspectives of Quality management in organizations and assess whether there are significant differences in this according to the type of company or the sector to which it belongs. Finally, a discriminant analysis is carried out that allows evaluating the possible grouping of the companies according to their size based on the fact that the evaluated variables show a similar behavior in each of the groups that the discriminant yields, the validity of the test is established through of Wilk’s Lambda statistician and the assessment of statistical significance.
Analysis and Results
According to the results obtained ( Table 5 ), the conscious application of quality management by company managers tends to grow in representativeness as the size of the companies increases, that is, in companies large and medium-sized companies there is a higher percentage of executives who bet on quality management as a strategy, and in this sense other variables analyzed show the same trend, such as the existence of quality policies and objectives, as well as the definition of functions regarding management of quality. However, most companies, regardless of their size, prefer to apply a cost strategy and many of the organizations do not perceive both strategies as antagonistic.
Table 5 Behavior of variables related to management responsibility and quality management by type of enterprise.
| Type of enterprise | Leadership | Quality strategy | Cost strategy | Quality politics | Responsibilities | Quality objectives |
| Micro | 0.134 | 0.134 | 1.000 | 0.000 | 0.000 | 0.000 |
| Small | 0.239 | 0.239 | 1.000 | 0.000 | 0.000 | 0.000 |
| Medium | 0.392 | 0.392 | 0.835 | 0.093 | 0.093 | 0.093 |
| Large | 0.505 | 0.505 | 0.571 | 0.374 | 0.374 | 0.374 |
Source: Own elaboration.
As a manifestation and in line with the results of the orientation of senior management towards quality, it was observed ( Table 6 ) that micro and small enterprises do not use documentary tools for quality management, that is, they do not have quality manuals and procedures to establish the standards of products or processes and they do not have quality records that allow the collection of evidence on the performance of the quality of products and processes from which to undertake future improvement programs. On the other hand, medium and large enterprises have introduced these tools proportionally, although not in the desired percentages. In general, the companies that apply these tools respond to some type of external requirement, that is, they seek to create the bases to accredit the quality offered. It was also observed a tendency to have more procedures than manuals and more records than procedures, which is interpreted as the result of an effort that does not end up in the results.
Table 6 Behavior of variables related to the documentary system and quality management.
| Type of enterprise | Quality Manual | Procedures | Quality Records |
| Micro | 0.000 | 0.000 | 0.000 |
| Small | 0.000 | 0.000 | 0.000 |
| Medium | 0.134 | 0.184 | 0.582 |
| Large | 0.418 | 0.478 | 0.659 |
Source: Own elaboration.
With regard to resource management ( Table 7 ), micro and small companies show a slight representation in the use of tools to guarantee having quality inputs, so that, although in a low proportion, some apply tools for the evaluation and selection of suppliers as well as the use of contracts as legal tools that formalize this relationship.
Contracts sometimes observe the establishment of quality specifications for purchases, as well as purchase evaluation methods and ways to resolve possible discrepancies. Although it is noteworthy that the use of these tools occurs in low percentages in smaller companies and to a much greater extent in other organizations.
Table 7 Behavior of variables related to resource management and quality management.
| Type of enterprise | Supplier evaluation | Supplier selection | Quality specifications in contracts | Supplier evaluation methods in contracts | Dispute resolution for contracts |
| Micro | 0.134 | 0.134 | 0.192 | 0.192 | 0.192 |
| Small | 0.318 | 0.318 | 0.214 | 0.214 | 0.214 |
| Medium | 0.670 | 0.670 | 0.696 | 0.696 | 0.696 |
| Large | 0.868 | 0.868 | 0.912 | 0.912 | 0.912 |
Source: Own elaboration.
Among the human resources management tools that are directly related to quality ( Table 8 ) the least favored in organizations is performance evaluation, where aspects related to quality are generally not considered. Unless critical incidents whose impact on quality is very notable are identified and, consequently, they are considered in the performance evaluation. Although with regard to performance evaluation there is a tendency not to be applied in many of the organizations. Similarly, it is observed that the reward systems that are applied are not given to consider quality results, which is logical from the recognition that it is not considered in the performance evaluation. The human resource management activities, that are related to quality management and that are most favored by organizations, are the selection and training of personnel. This perspective in general tends to improve its application as the size of the organization grows.
Table 8 Behavior of variables related to human resources and quality management.
| Type of enterprise | Job Design | Selection | Training | Reward | Performance evaluation |
| Micro | 0.100 | 0.195 | 0.311 | 0.147 | 0.000 |
| Small | 0.260 | 0.321 | 0.419 | 0.208 | 0.046 |
| Medium | 0.433 | 0.479 | 0.763 | 0.351 | 0.211 |
| Large | 0.791 | 0.934 | 0.934 | 0.484 | 0.319 |
Source: Own elaboration.
Process management turned out to be the most difficult to delimit of the perspectives established for the research, since many of the representative variables of this perspective are considered in others, which is understandable from internalizing that in a system all the dimensions or perspectives are interrelated and are not totally isolated parts. For this reason, the analysis was oriented to the first phases of the quality tie: the study of the market and the formalization, review and improvement of the product design and processes. As can be seen in Table 9 , the most frequent use is the application of corrective actions as a manifestation of control. The remainder tend to be rare in most companies, although as their size increases, the frequency of their manifestation increases.
Table 9 Behavior of variables related to process management and quality management.
| Type of enterprise | Market research | Design formalization | Design review | Control actions |
| Micro | 0.050 | 0.100 | 0.100 | 0.774 |
| Small | 0.150 | 0.208 | 0.208 | 0.872 |
| Medium | 0.258 | 0.299 | 0.299 | 0.871 |
| Large | 0.407 | 0.484 | 0.484 | 0.923 |
Source: Own elaboration.
Inspection actions ( Table 10 ) showed to be the most applied by organizations. However, as it has already been analyzed, on many occasions they are limited to applying the corrective action that may be derived from these, but a registration system is not applied that favors subsequent analyzes.
Table 10 Behavior of the variables related to the measurement, analysis and improvement and quality management.
| Type of enterprise | Inspection | Satisfaction | Improvement |
| Micro | 0.361 | 0.192 | 0.137 |
| Small | 0.535 | 0.214 | 0.168 |
| Medium | 0.789 | 0.521 | 0.381 |
| Large | 0.912 | 0.747 | 0.516 |
Source: Own elaboration.
To a lesser extent, some way of evaluating customer satisfaction levels is used either through interviews or surveys. Regarding the implementation of improvement programs, this is the least favored even in large companies. In general, it is observed that the frequency of application of these actions is directly related to the size of the organizations.
The integration of the previous analyzes can be seen in Figure 1, where, as can be seen, in all dimensions there is still potential for improvement, that the size of the company is closely related to the degree of development of each dimension of quality management. In general, it can also be observed that the degree of development of quality management in micro and small companies is very insignificant.
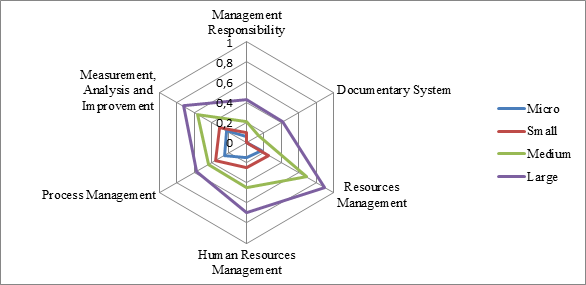
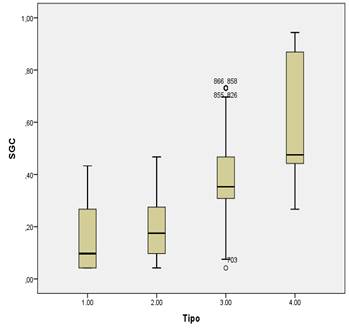
Figure 2 and 3 shows the result of the application of Equation 3 established in the methodology, which constitutes a way to evaluate the degree of application of quality management system. As can be seen, the degree of application of the postulates and tools of quality management in micro and small enterprises is very low, while in medium and large enterprises it tends to reach higher values.

To verify the conformation of groups, according to the behavior of the variables, a discriminant analysis was performed. Establishing the type of company as the grouping variable, depending on the size, and the rest of the variables under study as independent variables. The equality test of the group means through Wilk’s Lambda statistic was highly significant for all variables. The behavior of the canonical discriminant function is shown in Figure 4, where it can be observed how three fundamental groups are formed that are closely related to the size of the company. Group 1 forming the micro and small companies and the other two groups by medium and large companies, independently.

Source: Own elaboration.
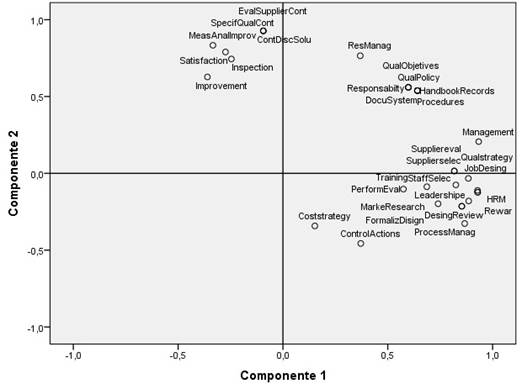
In order to deepen and graphically represent how the behavior of the variables influences the conformation of these groups, a principal component analysis was carried out for two factors, where the Kaiser Meyer Olkin coefficient reached the value of 0.72 and the sphericity test of Bartlett was highly significant.
Figure 5 shows the component chart of rotated spaces, where it can be seen that the variables are grouped into three groups. The group of variables that pay the most to the first component can be assumed as the variables whose behavior shows the greatest variation between the groups formed. On the other hand, the variables that tend to be associated with component two are the variables that show the least variation between groups. The third group of variables that occupy an intermediate position between both components presents an average behavior between the two previous groups.
Discussion and Conclusions
The results found in this research corroborate the proposals of previous research (Mutingi & Chakraborty, 2018; Yang, 2020), regarding the variables considered, as well as the basic conclusion that smaller companies do not present a broad level of development of the variables related to quality management. Similarly, indirectly, information is provided that validates the approach of Majumdar et al. (2019) and Sternad et al. (2019) regarding the proportionality relationship between variables of the number of workers and financial availability and the degree of development of quality management.
Considering also the behavior of the variables associated with senior management (leadership, definition of responsibilities, policies and objectives), as well as those associated with the level of formalization of quality standards, contributes to reinforcing the findings of Chiarini (2019) and Sfakianaki and Kakouris (2020), who link the low level of presence of these variables as fundamental causes of the low level of quality management (Arjona-Granados et al., 2022).
On the other hand, the results found do not coincide with those reported by Georgiev and Ohtaki (2019), who did not find significant differences between SMEs and larger organizations despite the fact that the same variables were evaluated in general.
The authors consider the approach of Imran et al. () and Imran et al. () valid, regarding the recognition of export activity as an external stimulus that activates the need to develop quality management in SMEs, but it was not possible to evaluate this hypothesis due to the fact that in the sample taken and in the general population. The representation of SMEs oriented to export activity was very low. In accordance with all the previous results, the authors of this research support the proposal of Toke and Kalpande (2020), who recognize the need to develop a quality management model of their own for SMEs.
The limitations of the present research and in turn the lines of development of future research, are mainly associated with the limited nature of the population and the study sample, so although the previous results constitute additional evidence that supports the approaches of previous research, the results should not be generalized without evaluating them in other contexts. Similarly, the need to carry out studies that determine the existence of differences or not between SMEs that carry out export activities and those that do not, as a way of evaluating how the export activity can stimulate the development of the management of the quality.
The authors consider that the main limitation of the research and the interpretation of the results is given by the existence of a great diversity of definitions and classification criteria that exist on SMEs according to the country or region, which makes it difficult to generalize the results and constitutes a risk in the process of analysis and interpretation of the results.
The implications that can be derived from the present investigation can be formulated from two different angles. From one perspective, the need for SMEs entrepreneurs to apply measures that seek to achieve higher levels of quality can be considered by assuming as valid the theory validated in practice that quality strategies are infinite and are one way proven successful and competitive advantage. From the other side, and perhaps more important, it is the exhortation to academics and researchers related to business management to develop research that, on the one hand, seeks to respond to the need to develop a quality management model in accordance with this type of organization and on the other, they seek to establish criteria that allow establishing a uniform and universal classification rule for companies according to their size, so that the results reported from them can be generalized regardless of one context or another.
The most important conclusion of this research, and that is supported in the different parts of this document, is associated with the impossibility of assuming SMEs as a single object of study, since the requirements to define them are highly variable depending on of the country where it is analyzed, which makes it difficult to generalize the research results developed on this type of enterprises.
On the other hand, despite the differences in criteria to classify SMEs in various contexts, the results corroborate the findings of previous research regarding the existence of important differences in the level of development of Quality Management between companies based on the size of these. This is why the idea is supported that it is still a research topic to develop the need to develop quality management models in accordance with the particularities of SMEs that do not correspond to the basic premises that support the general management models of quality and widely validated in larger companies.
Finally, the authors consider it pertinent to recognize the need to carry out research aimed at establishing a universal criterion for classifying companies according to their size, based on which it is possible to generalize the results of research on smaller companies, regardless of their size context in which they are located.

