


 Inglés (pdf)
 Articulo en XML
 Referencias del artículo
 Enviar articulo por email
 Citado por SciELO
  Similares en
SciELO
Similares en
SciELO 
 Permalink
Introduction
Most countries around the world have put in place several measures to contain the spread of COVID-19 (Bherwani et al., 2021). Some of these interventions have promoted policies to reduce human-to-human interactions, for example by halting non-essential activities and prohibiting large gatherings (Parino et al., 2021). The introduction of social distancing and other actions to cope with the pandemic had environmental, health and economic impact (Sarkodie & Owusu, 2021). Businesses were shuttered, schools were closed and many workers were forced to work from home (Lemieux et al., 2020). Hundreds of thousands of workers have been put on government-supported job retention schemes, which has given some relief to many vulnerable families and communities (Mueller et al., 2021). However, some of the interventions from governments to suppress the pandemic had led to economic recession and higher unemployment (Rosén & Stenbeck, 2020).
In the wake of the COVID-19 outbreak, it is undeniable that most of the economic crisis countries have experienced can be attributed to the pandemic (Goel et al., 2021). Ecuador was no exception, and COVID-19 had a tremendous impact on the country´s economy (McBurney et al., 2021). Before the pandemic, the economic situation of the country experienced a significant improvement during the last decade (Wolff, 2018), however, in the last few years some events such as a powerful earthquake that took place in April 2016, a less favorable external context and most recently the COVID-19 crisis caused a deep recession that amplified macroeconomic imbalances (Sánchez et al., 2020). In this scenario, the COVID-19 worsened the situation by forcing the government to restructure its debt with bondholders at the beginning of the pandemic, which was highly criticized. The COVID-19 exacerbated and revealed structural weaknesses of the country such as the lack of macroeconomic buffers, widespread informality, a deficient healthcare system and inequality in public service access (World Bank, 2021).
The purpose of this study is to model and forecast the behavior of four indicators of the Ecuadorian labor system to establish their natural tendency by isolating the COVID-19 variable and determine the quantitative impact of the pandemic. For this, two scenarios have been considered: indicators with the natural trend, this is to say, what would have happened if COVID-19 had not occurred. The second scenario: indicators taking into account the effects of the COVID-19.
Four indicators were chosen for the analysis: unemployment, full employment, underemployment and what the National Institute of Statistics and Census (INEC) has called: “other non-full employment.” The statistical analysis model applied for this study was the X-13ARIMA, that is an automatization of the classic Autoregressive Integrated Moving Average (ARIMA) model prediction (Kim et al., 2021). To conduct seasonal adjustment of official statistics, the members of the European Statistical System (ESS) officially recommended the JDemetra+ v. 2.2.3 software (European Union, 2017) which has been used for this study.
In general, ARIMA models use time series data to understand the data set or to predict future trends (Sowell, 1992). A statistical model is autoregressive if it predicts future values based on past values (Fattah et al., 2018; Newbold, 1983). The use of an autoregressive model was suitable for this study since it can provide some tools to accurately evaluate a wide range of what/if scenarios and to predict the evolution of some of the macroeconomic indicators for different policies and government interventions (Parino et al., 2021).
This paper has been divided into six sections. The first section introduces the study, the second section presents the literature review. The third section focuses on the methodology employed, the fourth section explores the results of the study, and the fifth section discusses the results. Finally, the sixth section presents the conclusion of the study.
Literature review
Traditional statistical models including moving average, exponential smoothing, and ARIMA are being used to model time series (Tseng & Tzeng, 2002). Exponential smoothing and ARIMA models are the most commonly used approaches to time series forecasting (Aditya Satrio et al., 2021; Alsharif et al., 2019). Whilst ARIMA models are being used to describe the autocorrelations in the data, exponential smoothing models describe the trend and seasonality in the data (Sagaert et al., 2018). Statistical models for seasonal adjustment are commonly used by bureaus of statistics around the world. These models are linear since the future values are cramped to be linear functions of past data (Bógalo et al., 2022). Autoregressive integrated moving average models are also known as a Box-Jenkins method (Makridakis & Hibon, 1997) named after the statisticians George Box and Gwilym Jenkins. Box-Jenkins models have been described as an alternative to econometrics models since during the 1960s some econometricians expressed some concern about the reliability of and predictive capabilities of large-scale models (Naylor et al., 1972).
To perform a Box-Jenkins model, there are some steps that need to be followed (Siami-Namini et al., 2019; Taneja et al., 2016). The first step is to establish whether the time series is stationary and whether there is any significant seasonality that could be modeled (Bógalo et al., 2022). Economic indicators are seasonal, which means they are predictable over one year period (Nadal Rosselló et al., 2004). Seasonality and the availability of past economic data makes possible to compare and contrast predicted and actual economic impact due to the COVID-19 outbreak (Lim & Wai-Ming, 2022).
In the last few years most of the attention has been focusing on linear models since they had proved simplicity in comprehension and application (Fattah et al., 2018). Under an autoregressive moving average hypothesis. Sagaert et al (2018) forecasted a number of macroeconomic indicators by using historical data and validated the models by examining the forecast performance. Bialowolski et al. (2013) developed a methodology for forecasting key macroeconomic indicators, based on business survey data. They estimated a large set of models, using an autoregressive specification, with regressors selected from business and household survey data.
When using the ARIMA approach, sometimes it is impossible to determine a model, especially when seasonal adjustment order is high or its diagnostics fail to indicate that time series is stationary after seasonal adjustment (Fattah et al., 2018). One very important issue of the ARIMA model is that it requires a large number of observations to determine the best fit model for a data series (Gómez et al., 1999).
The application of ARIMA models for forecasting different types of indicators and predict results is widely known in the academic world (Bherwani et al., 2021). ARIMA models have a long history of reliability in forecasting and analysis of data sets since this time series technique makes very few assumptions and is very flexible (Ho & Xie, 1998).
Guleryuz (2021) developed a forecasting model to predict an outbreak of COVID-19 based on Box-Jenkins methods (ARIMA) using statistical data for Turkey and comparing the method with Brown’s exponential smoothing and long short-term memory models. The study concluded that ARIMA models with different parameters can be employed to observe the spread of different epidemics and predict future outbreaks.
In Ethiopia, a study was conducted to analyze the trend and forecast the spread of COVID-19. For this, a statistical forecast model was developed using Box-Jenkins modeling procedure, which successfully predicted the increase of COVID-19 cases on daily basis allowing the government to implement health interventions to reduce the spread of the virus (Asmelash Gebretensae & Asmelash, 2021). The success reported in the Ethiopia study was previously reported by another work, in which an analysis of COVID-19 using an algorithm to perform and evaluate the ARIMA model and polynomial functions for 145 countries. The results of the study showed that models can predict the COVID-19 behavior using variables as humidity, climate, culture, among others (Hernandez-Matamoros et al., 2020).
Regarding the prediction and modeling of labor indicators, there are several studies in which authors have performed different types of approaches. Macroeconomic forecasts are normally obtained from time series data (Wilke, 2018). However, some studies have used rolling regressions to conduct a simulated out-of-sample forecasting exercise to forecast employment (Sakutukwa & Yang, 2018).
Claveria (2019) forecasted unemployment rates in eight European countries by incorporating the degree of consensus in consumers’ expectations and using the step-wise algorithm developed by Hyndman & Khandakar (2008). Then ARIMA models were used to generate out-of-sample recursive forecasts of the unemployment rates.
Most recently, the effect of the COVID-19 on the labor market in developing countries was assessed by Khamis et al (2021) in a study that used high-frequency phone survey (HFPS) in thirty-nine countries. This study was reported in the 2021 year; however, the data were collected at the very beginning of the COVID-19 outbreak.
Methodology
Most governments assess their policies based on real time monitoring of the economy using seasonally adjusted time series (Bógalo et al., 2022). The use of mathematical models to predict the evolution and consequences of COVID-19 has become widespread in the academic world. These mathematical models based on various factors and analyses could lead to potential bias (Benvenuto et al., 2020). For this study, a simple econometric model was proposed to predict the behavior of four indicators of the Ecuadorian labor system and establish their natural tendency by isolating the COVID-19 variable and determine the quantitative impact of the pandemic.
The X-13ARIMA model was chosen since it has demonstrated its outperformance in precision and accuracy of predicting the next lag of time series (Siami-Namini & Namin, 2018). In addition, multivariate transfer function models, dynamic models and generalized autoregressive conditional heteroscedasticity (GARCH) models were also considered. ARCH and GARCH models are becoming more popular among scholars especially for financial applications (Fattah et al., 2018). However, those models are more focused on the analysis and forecasting of volatility such as the cryptocurrency market (Alshater et al., 2021).
It should be pointed out that, the use of a time-series intervention analysis was considered for this study. However, we decided not to used it since, an intervention model is traditionally applied when an external shock to the series has been identified and could potentially affect the prediction (Chung et al., 2009). This study used 2007-2019 data, which means before the external shock (COVID-19), to predict the 2020 behavior of the labor indicators and then compare the data with the official figures published by INEC. For the prediction of the 2021 trend of the Ecuadorian labor system the use of an intervention model would be appropriated and could be a potential new study.
This study faced two important methodological challenges. First, data collection that was planned for March 2020 was cancelled due to the beginning of the pandemic. Second, the INEC adopted a telephone survey during the second term of 2020, which represented a significant impact on data collection methodology. To overcome those two challenges, we only used data from September to December 2020, in this way the data was collected using the traditional methodology and not the telephone survey. Finally, we did not perform a test of significance since at the time of this research, INEC had not yet published sample designs, hence exact confidence intervals could not be calculated without a design sample.
X-13ARIMA was performed by the JDemetra+ v. 2.2.3 software, which has been officially recommended to members of the European Statistical System (ESS) and the European System of Central Banks as software for seasonal and calendar adjustment of official statistics. This algorithm is an automation of traditional seasonal time series modeling using ARIMA models developed by Box and Jenkins (Guleryuz, 2021). Automation seeks to avoid subjective criteria that could be given by the researcher when determining the order of the parameters, which also makes it difficult to replicate results.
The traditional way to get rid of seasonal path of a time series Xt using ARIMA models, also called SARIMA of order (p, d, q) (P, D, Q), follows this equation:
Where (i is the difference operator xt - xt-i, p is the number of autoregressive lags (xt-l), d is the order of integration of the series, q is the number of moving average lags (at-k ), S is the number of intra-annual periods of a series; and P, D, and Q are analogous to p, d, and q but are the periodic frequency orders to correct for seasonal effects. In the manual adjustment of this model, the researcher determines the order of the model by observing the autocorrelations and partial autocorrelations using his own criteria, which could vary according to the objective and the user's own subjectivity.
The X13-ARIMA algorithm determines the orders automatically. For this it decomposes the Xt series into three components which are assumed to be independent of each other 1.- trend and cycle (TCt), 2.- seasonality (St) and 3.- irregular component (It)- This decomposition can be additive (Xt = TCt + St + It) or multiplicative (Xt = TCt x St x It), which is determined by the algorithm (UNECE, 2020).
Additional details of the algorithm will be described later in this document. The analysis strategy included modeling the time series of the main variables of the Ecuadorian labor system for the pre-pandemic period (December 2007 to December 2019) and predict the year 2020. This allowed us to understand how the behavior of this year would have been expected without pandemic, and compare these predictions with the official 2020 data published by the INEC.
The three indicators that are widely used to follow the evolution of the Ecuadorian labor system are: unemployment, full employment and underemployment. In relation to underemployment, this becomes relevant in economies with high levels of informality and that do not have broad or universal coverage of unemployment insurance. However, in Ecuador this measurement has undergone methodological changes that make it difficult to understand this phenomenon, such as the separation of the underemployment category into underemployment and other non-full employment using the subjective indicator of desire and availability. This can be evidenced in the labor transition matrices in which the main movements of people occur between underemployment and other non-full employment, showing the volatility of the dimension of desire and availability.
Regarding the information collection periods, the Underemployment, Unemployment and Employment National Survey (ENEMDU) with its current methodology has been executed since December 2007, the data published by the INEC are biannual (June and December) from 2007 to 2013, and quarterly from 2014 to 2019, which ensures a complete six-year quarterly series so that the model can "understand" seasonality.
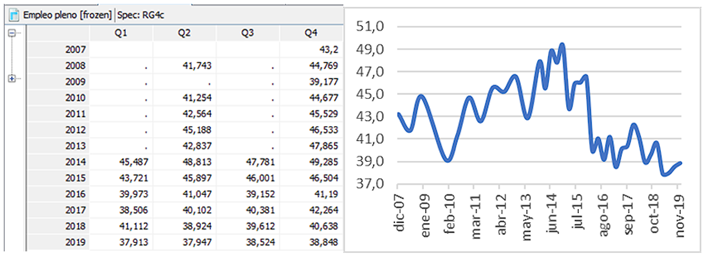
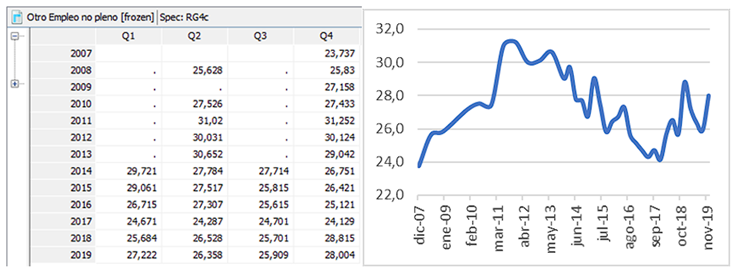
In accordance with the aforementioned, the series of: unemployment (See Figure 1), full employment (See Figure 2), underemployment (See Figure 3) and other non-full employment (See Figure 4), published by the INEC between December 2007 and December 2019 was analyzed.


Analysis
Before modeling the series using JDemetra+, graphic exploration indicated that the labor system had a different behavior from 2016 to 2019. There are series such as full employment, underemployment and other non-full employment that have a marked trend and seasonality. Series such as those for unemployment do not show a trend, although a weak seasonality is observed. This however is a graphical exploration, which will have to be statistically proven.
Table 1: Summary of automatic modeling using the X13-ARIMA model
| Indicator | SARIMA Model | Seasonality | Out-of-sample test (p value) |
| Unemployment | (1,0,0) (0,0,0) | No | 0,4645 |
| Full employment | (0,1,0) (0,1,1) | Yes | 0,638 |
| Underemployment | (0,1,0) (0,1,1) | No | 0,4548 |
| Other non-full employment | (2,1,1) (0,1,0) | No | 0,1798 |
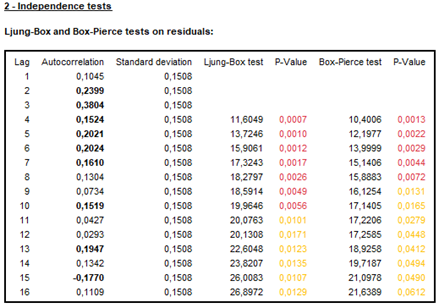
Table 1 shows that the only series demonstrating seasonality is full employment, while the other three series do not. The tests for the average out-of-sample forecast errors are significant beyond the 0.10 significance level. Thus, it can be assumed that the average of the prediction errors is statistically equal to zero in all the series, and that the predictions made with these models are acceptable. It should be clarified that these tests are valid as long as the assumptions of normality, independence, randomness and linearity of the residuals are met. When reviewing the statistical tests on residuals, some of them are not fulfilled in the indicators of underemployment and other non-full employment (See Figure 5 and Figure 6).
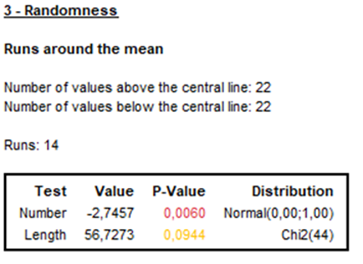
This may be due to the fact that underemployment and other non-full employment are actually part of the same labor phenomenon that was separated in 2014 based on a subjective criterion: desire and availability, better indicators. To measure underemployment, it can be the sum of these dimensions, as it was before 2014. For the purposes of this investigation, we called this indicator “expanded underemployment” (See Figure 7).

Table 2: Seasonality of labor indicators
| Indicator | SARIMA Model | Seasonality | Out-of-sample test (p value) |
| Unemployment | (1,0,0) (0,0,0) | No | 0,4645 |
| Full employment | (0,1,0) (0,1,1) | Yes | 0,638 |
| Expanded underemployment | (0,1,1) (0,1,1) | Yes | 0,8827 |
This extended underemployment indicator complies with all the assumptions of normality, independence, randomness and linearity of the residuals. Thus, projections obtained will be more consistent and precise for the three indicators.
Table 3: Residue analysis
| Residue analysis | |||
| Dimension | Indicator | ||
| Unemployment | Full employment | Expanded underemployment | |
| p value | p value | p value | |
| 1. Residual normality | |||
| Mean | 0,9009 | 0,4008 | 0,3101 |
| Skewness | 0,9582 | 0,3558 | 0,8468 |
| Kurtosis | 0,9897 | 0,9687 | 0,7051 |
| Normality | 0,7397 | 0,5431 | 0,9458 |
| 2. independence of the residuals | |||
| Ljung-Box (16) | 0,9064 | 0,1023 | 0,2005 |
| Box-Pierce (16) | 0,9631 | 0,3655 | 0,4878 |
| Ljung-Box on seasonality (2) | 0,9726 | 1 | 0,733 |
| Box-Pierce on seasonality (2) | 0,9758 | 1 | 1 |
| Durbin-Watson statistic: 1,6922 | |||
| 3. Randomness of the residuals | |||
| Runs around the mean: number | 0,1258 | 0,0672 | 0,5418 |
| Runs around the mean: length | 0,0003 | 0,9999 | 1 |
| Up and Down runs: number | 0,818 | 0,0679 | 0,2733 |
| Up and Down runs: length | 1 | 1 | 1 |
| 4. Linearity of the residuals | |||
| Ljung-Box on squared residuals (16) | 0,3747 | 0,6044 | 0,5302 |
| Box-Pierce on squared residuals (16) | 0,6863 | 0,8156 | 0,7229 |
Results
In order to have the definitive results of the influence of the COVID-19 pandemic, it is proposed to predict the year 2020 using the modeling of the series until December 2019, which was the last data before the COVID-19 outbreak in February 2020. This is plausible given that the X13-ARIMA algorithm found a model with acceptable predictive power that meets the statistical assumptions and compares these predictions with the official data published in 2020.
Several challenges arose during the analysis of the results due to the delay of the publication of labor indicators, which did not occur until the end of the first semester of 2020. The data for this period was generated with a telephone survey carried out between May and June 2020 and published in July of the same year. The use of a telephone survey to collect data of the labor indicators represented a change in methodology, which made it impossible to compare the information with previous data.
In September 2020, a new run of the ENEMDU was carried out almost entirely in person. With changes in sample design, specifically in the size, distribution, representativeness of the sample, and the calculation of the factors of expansion, made it incomparable with the previous series until December 2019.
In December 2020, a new run of the ENEMDU was carried out in person. This time, with a new change in the calculation of the expansion factors. This made it incomparable with the September 2020 survey and with the December 2007 - December 2019 series. Three months later, a new series of the Ecuadorian labor system began again. This series remained running until May 2021.
In July 2021, the ENEMDU corresponding to the June 2021 period was published. In this publication, the INEC recognized the issues that the survey experienced, and announced that the telephone ENEMDU was discarded as part of the employment series. The expansion factors were recalculated, and the indicators from September 2020 to May 2021 made them comparable with the December 2007 - December 2019 series.
Although true that this was a statement by the national statistical office, the published databases do not allow verification of comparability of the new series from September 2020 onwards with the previous series. However, as they are official databases published by the official Ecuadorian bureau of statistics, it was accepted that the data for September and December 2020 are comparable with the previous series. These series carry out the comparison exercise proposed in this article.
With these clarifications, the results of the prediction y_f for the three series proposed are shown graphically including the standard errors of prediction y_ef (See Figures 8, 9 and 10).
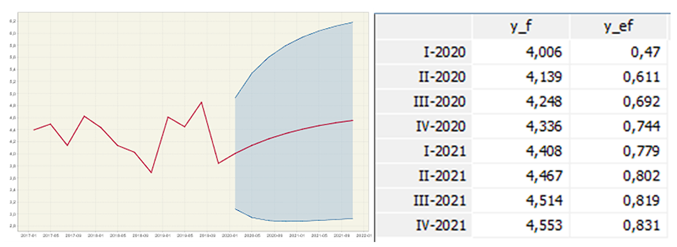
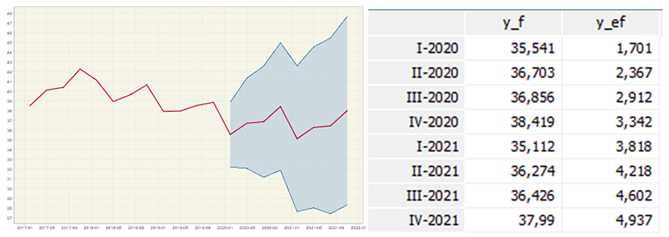
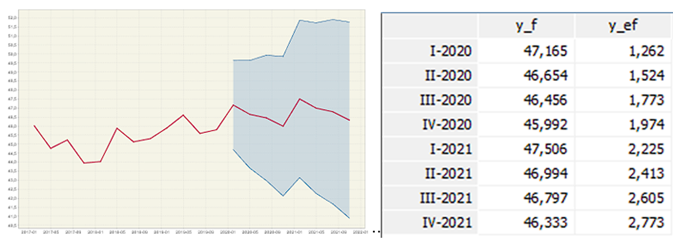
Unemployment is the worst predicted series since the model fails to capture the seasonal effect. Considering that the model determined by the algorithm was an AR (1) without a seasonal component, it does capture a slight growing trend. In the series of full employment and extended underemployment, the model manages to replicate the seasonal and trend components quite well. It is observed that before the pandemic, full employment already showed a decreasing trend and extended underemployment an increasing one. This contradicts the official discourse that all the deterioration in the conditions of the labor system was exclusively due to the pandemic.
Table 4: Predictions versus official INEC data for 2020
| Dates | Unemployment - original series | Unemployment - prediction | Full employment - original series | Full employment - prediction | Extended underemployment - original series | Extended underemployment - prediction |
|---|---|---|---|---|---|---|
| sep-19 | 4,9 | 38,5 | 45,6 | |||
| dic-19 | 3,8 | 38,8 | 45,8 | |||
| sep-20 | 6,2 | 4,25 | 30,8 | 36,86 | 50,6 | 46,46 |
| dic-20 | 4,9 | 4,34 | 30,4 | 38,42 | 51,1 | 45,99 |
The model predicted that between 2019 and 2020 unemployment would have a slight increase between the two years. However, in the first data collected for 2020, the pandemic had an increase of a little more than 1 point comparing September 2019 and September 2020.
The consequences on unemployment are not as strong because as was mentioned at the beginning, within economies with high levels of informality, the buffer mechanism in case of crisis is the decrease in full employment and the growth of expanded underemployment (Benanav, 2019). When comparing full employment between September 2019 and September 2010, the trend was maintained before the pandemic. A reduction of almost 2 points was expected, but with the pandemic the reduction was almost 8 points. In other words, 21.5% of the reduction in full employment is explained by the trend and seasonality of the indicator, and 78.5% could be explained by the effect of the pandemic.
When analyzing the December 2019 and December 2020 of the same indicator, the prediction indicates that full employment between September and December should recover two points due to the seasonal effect. In the original series it remains the same, which leads us to think that the pandemic also altered the structural seasonality which had the full employment indicator until 2019.
The same behavior was observed in extended underemployment. An increase of almost one point was expected between September 2019 and September 2020. However, an increase of almost five points occurred. In this indicator the 17.4% growth of underemployment is due to the trend and seasonality, while the 82.6% may be due to the pandemic. The same thing that happens with full employment between December 2019 and December 2020. A recovery of extended underemployment was expected, but there is a slight increase. Thus, the pandemic may have altered the seasonality of the indicator this year.
Conclusions
By looking at the Ecuadorian labor system, it was evident that a great impact of COVID-19 was observed in the four indicators selected for this study. However, the natural tendency is that the indicators full employment and underemployment, had already been deteriorating since the end of 2016. This indicated a problem was already observed before the pandemic began. In countries with a high level of informality and without universal coverage of unemployment insurance, as in the case of Ecuador, the adjustment variables in the face of a crisis are full employment and underemployment.
This study has been greatly impacted by some methodological changes made by the National Institute of Statistics and Census (INEC). The implications of these methodological changes make it difficult, if not impossible for any researcher to know how the pandemic affected the Ecuadorian labor system in the first eight months of 2020. During this period, the greatest number of infected people occurred. Regarding the proposed model for this article, it is important to take into consideration the fact that the prediction error increases as the prediction horizon increases. Since it is a quarterly series, the data that was predicted for 2020 is March, June, September and December of that year. The comparison can only be made for September and December 2020, which is the prediction horizon 3 and 4.
This paper developed a comprehensive framework to model and forecast the Ecuadorian labor system using a quantitative approach based on the X-13ARIMA model. Four labor indicators were chosen for the study: unemployment, full employment, underemployment and what the National Institute of Statistics and Census (INEC) has called, “other non-full employment.” The results showed that the labor system was greatly affected by the COVID-19 outbreak. However, a deterioration of full employment and expanded underemployment was already observed before the pandemic began in February 2020.
The official Ecuadorian bureau of statistics, made constant methodological changes during the first months of the pandemic. This made it extremely difficult to compare data collected before the pandemic to data collected during the pandemic. In addition, political decisions made by the government made it impossible to measure the real effect of the pandemic in the first eight months of 2020. This was the most critical time period in terms of health conditions and isolation, and therefore the labor system.
The indicators that best explain the structural condition of the Ecuadorian labor system are full employment and widespread underemployment. Considering the events between September 2019 (pre-pandemic) and September 2020 (during the pandemic), on average 20% of the deterioration in the labor system is due to the trend and seasonality that the indicators had already presented, and 80% remaining could be due to the pandemic. The pandemic additionally altered the seasonal behavior of the indicators for 2020 year and possibly 2021.
Addressing limitations of this research such as methodological changes made by the INEC, and the impact on labor indicators, observed during the pandemic, it would be possible to develop a new model which could forecast with a high degree of accuracy the impact of a crisis in the Ecuadorian Labor System in potential new crisis.
Contribución de autores
J.E.A.F. Revisión de literatura, metodología, análisis de datos, discusión y conclusiones.
D.G.V.A. Metodología y análisis de datos.
L.B.T.O. Revisión de literatura, análisis de datos, y conclusiones.

