


 Inglês (pdf)
 Artigo em XML
 Referências do artigo
 Enviar este artigo por email
 Citado por SciELO
  Similares em
SciELO
Similares em
SciELO 
 Permalink
Introduction
The role of innovation has been highlighted as a crucial policy for the economic development of nations and the producitivity of firms (OECD/IDRC, 2010; Lundvall, 1992 and Kaplinsky, 2006). The technological change is one of the main sources of the differences in the economic performance across countries (Romer, 1990 and Lucas, 1988, 1992). In fact, according to the UNESCO, there are high disparities among countries in terms of investment in research and development (R&D). In 2015, the five main R&D actors in relative terms (expenditure on R&D as a proportion of GDP) are: Israel (4.3%), the Republic of Korea (4.2%), Switzerland (3.4%), Japan (3.3%) and Sweden (3.3%). By contrast, Latin America and Caribbean’s countries have a low level of R&D investment of 0.7% on average. If this last region would invest more in R&D, the resulting innovation might constitute an important catching-up driver. However, it seems that in developing countries the level of innovation does not reach an optimal level due to its nature of public good for which the private provision is not engouh. Among the reasons for the low level of innovation are the insufficient appropriation of benefits, information asymmetry, uncertainty and coordination problems (Guaipatín & Schwartz, 2014). In addition, the innovation costs due to institutions and public policies (innovation tax) are higher in developing countries. In particular, Ecuador is a pertinent study case as this country is far from its technological frontier and the implementation of innovation policies would improve the productivity and economic growth levels (Maloney y Rodríguez-Clare, 2007). Maloney and Rodríguez-Clare (2007) show that Ecuador is one of the countries with many difficulties to innovate. These circumstances have affected the performance of firms both in the local market and in the international market. Facing this, the government has conducted an ambitious innovation program in 2007. Thus, the investment in human capital through scolarships in the period 2007-2013 was 50 times the investment in the period 1993-2006. In spite of those innovation efforts, the R&D/GDP ratio in Ecuador was 0.44% in 2014. Given this context, the relevant questions are: how does innovation emerge? and how can it be reinforced, especially in developing economies?
The aim of this study is then to identify the determinants of innovation in different types, namely, product, process, organization and marketing innovation, with special emphasis on the external factors related to the geographical configuration of regions where firms are located.
The model of the knowledge production function developed by Griliches (1979) is a basic tool to analyze the determinants of innovation. In such a framework, the new knowledge is a function of Research and Development investment and human capital. Firms that undertake R&D are very likely to improve the quality of their goods and services or transform them and create new ones. Likewise, firms that account for a pool of qualified labor force are able to generate new knowledge. Skilled workers are able to assimilate knowledge from external sources to the firm and are more capable to adapt and create new knowledge. However, not only internal characteristics of firms affect their level of innovation, the conditions of the economies where they are located also matter. For this reason, the knowledge production function has been extended including agglomeration forces that are external to firms (Carlino and Kerr, 2015).
The spatial agglomeration can influence on the innovative performance of firms. In the early phase of the industry’s product life cycle, firms can benefit from a large availability of labor force and a wider variety of inputs of different suppliers (Markusen, 1985). In this seetting, an increment in agglomeration economies would increase more than proportionally the level of innovation. Empirically, several approaches have been considered to measure the agglomeration economies: i. population density or the level of urbanization and ii. agglomeration economies based on especialization and diversity (Claver-Cortes et al., 2016). Positive results of the employment density on patenting are obtained (Carlino et al., 2007) whereas mixed evidence is obtained for especialization and diversity agglomeration externalities.
As part of the structure of agglomeration, specialization and diversity-based agglomeration economies have been conceive as the main drivers of innovation. On the one hand, Marsall-Romer-Arrow (MAR) based externalities of especialization indicates that the concentration of firms of the same industry is convenient for the exchange of information and ideas across firms, and therefore, facilitates the innovation activity. On the other hand, Jacobs externalities of diversity suggest that the concentration of firms from different industries is more convenient for knowledge spillovers. The complementarity of different sectors can lead to a process of cross-fertilization of ideas that can end in innovation. An additional innovation force is the level of competition across firms. Contrasted postures exist around the effect of competition on innovation. Meanwhile, Jacobs (1969) and Porter (1990) state that more competitive markets lead to more innovation, MAR-based externalities consider that a monopoly allows firms to be more innovative as they can appropriate the economic value of their investment in R&D. In the economic geography literature, a large number of studies has been devoted to analyze the agglomeration externalities in response variables other than the innovation itself. In those works, the variables of impact are the employment growth or the productivity (Glaeser et al. 1992; Combes, 2000; Da Silva Catela et al., 2010; Saito and Gopinath, 2009) and it is implicitly assumed that agglomeration economies lead to innovation without measuring such an effect. This study tries to identify the explicit effect of agglomeration externalities on innovation that in other studies is simply implicit. Regarding internal firm characteristics, the expected effect of firm size on innovation is ambiguous. Cohen and Klepper (1996) and Akcigit and Kerr (2010) show that large firms are more prone to involve in innovation as they are capital intensive and can afford high fixed costs of innovation (Crowley and Jordan, 2017).
For medium and small companies innovation might be a complex aspect (Acosta and Coronado, 1999; Autant-Bernard et al., 2010; López-Mielgo et al., 2012). Nevertheless, the evidence has demonstrated that the bureocracy of large firms may hinder the innovative process. By using employment-standardized measures, Acs and Audretsch (1988) found that small firms are more innovative in certain industries. New small firms in a given industry face to a highly competitive market and, then, have the necessity of innovating. Such necessity would be lower as the firm consolidates in the market (Benito-Hernandez et al., 2012). Similarly, the effect of experience is ambiguous. On the one side, Autant-Bernard et al. (2010) states that firms with many years of operation build efficient knowledge routines and have a greater experience that facilitates innovation. On the other side, Benito-Hernandez et al. (2012) states that firms with vast experience achieve an important market position and lose interest in increasing the innovative capacity.
A large concensus exists about the positive effect of R&D expenditure as firms that engage in R&D have determined goals pointing to achieve innovation. Skilled labor is another positive expected factor of the innovation since human capital increases the absorptive capacity and the capacity of generation of new knowledge of firms (González et al., 2016). Autant-Bernard et al. (2010) in their study show that the value of exports encourages innovations, because, if the goods or services are devoted to the international market, companies will have a greater demand to increase their competitiveness. Companies as part of international markets are forced to generate innovative ideas on a global scale (Grossman and Helpman, 1993) to meet the quality requirements from international customers (López-Mielgo et al., 2012). For the promotion of innovation, the public investment might play an important role. The public aid has a decisive role in the early stages of firms as it helps to overcome the barriers it encounters to innovate such as lack of resources (Antolin-Lopez et al., 2016).
In this context, it is necessary to determine the factors that affect the probability of innovating for Ecuadorian firms. For this purpose, a discrete choice model is employed using data from Ecuador for 2011 and 2014. The database contains information of 8025 firms. The estimated models correspond to the different types of innovation, namely, innovation of products (goods and services), innovation of process, organizational innovation and marketing innovation. Extended innovation models are estimated including measures of the agglomeration economies at the province level. Important policy implications to improve the innovation capacities of firms by considering the conditions of the Ecuadorian regions can be derived from this investigation.
The results of this investigation evidence that in fact the spatial configuration of regions where firms are located are important for their innovation performance. For instance, while the firms’ density has a negative general effect on innovation, the percentage of innovative firms in a province positively affects the probability of innovating. What matters for innovation is not the density of firms in general but the presence of innovative firms. In general, diversity agglomeration externalities predominate over the specialization agglomeration externalities. Diversity better promotes innovation due to the interaction between complementary activities conducted by firms which are not rival. The specialization-based agglomeration economies are positive for product innovation but not significant for process, organizational and marketing innovations. It seems that the knowledge is protected in the latter types of innovation that need more deep interactions than just being close to similar firms. Thus, the distinction of the effects of agglomeration economies by types of innovation, considered here, is not trivial. As for the competition, opposite effects are in work for different types of innovation. On the one hand, a positive effect is obtaine for process innovation, as firms have to improve their processes to be more efficient in the competitive market. On the other hand, competition negatively affects the organizational innovation as firms that generate new knowledge intend to protect it, impeding other firms to benefit from it. It is worth noting that significant effects are obtained even with a high level of aggregation of the agglomeration economies.
This paper is organized as follows. The next section describes the data and the methodology. Section 3 discusses the results and Section 4 concludes.
Data and Methodology
Data
The data comes from the National Survey of Innovation Activities (AI), corresponding to 2011 and 2014. This survey is conducted every 3 years and accounts for information regarding the scientific research, technological development and innovation in Ecuador, as well as human talent and resources for these activities. The coverage of the AI is national, it is representative at the province and the sector levels.
Information on public investment in higher education and R&D is collected from the Technical Secretary Planifica Ecuador. Based on all this information, a pooled data of 8,025 firms was constructed: 1,750 firms belong to 2011 and 6,275 to 2014. This dataset was weighted using the sampling weight provided by the INEC, in order to improve the estimation of coefficients and obtain consistent results (Solon et al., 2013).
Description of Variables
Dependent Variables
According to the Oslo Manual, innovation could be defined as a new or improved product, process, marketing method or organizational method, that differ significantly from the unit’s previous products, processes or methods, that have been made available to potential users or brought into use by the unit”.
To analyze the determinants of innovation, all types of innovation are considered. Five dichotomous dependent variables are retained and take the value 1 if a firm: 1) innovates in any type of innovation, 2) innovates in products, 3) innovates in process, 4) innovates in organizational activities and 5) innovates in marketing. Formally:
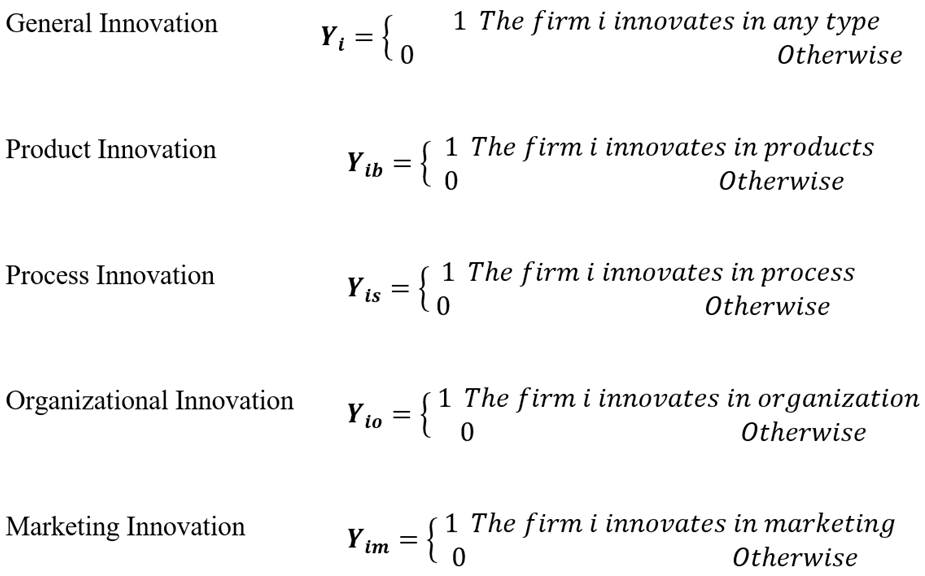
Table 1 shows that 56.79% of firms innovate in any type of innovation. In addition, it is observed that firms mainly focus on process innovations (32.21%)1.
Independent Variables
Based on the literaure review presented in Table 2, two set of variables are considered: those related to individual characteristics of firms and those related to the external characteristics. The individual characteristics encompass the firm’s size approximated by the amount of sales, the number of workers and the experience; the R&D expenditure, the expenditure on innovation activities2, number of skilled workers (i.e. persons who have higher education), exports, whether the firm belongs to a corporative group and whether the firm is publico or private.
Table 2. Independent Variables
| Variable | Description | Expected Sign | Literature |
|---|---|---|---|
| Internal Factors | |||
| ln sales | average sales during the last three years | Ambiguous | (+) Cohen and Klepper (1996) and Akcigit and Kerr (2010), Crowley and Jordan, 2017, Acosta and Coronado (1999); Autant-Bernard et al., (2010); López-Mielgo et al., (2012). (-) Acs and Audretsch (1988), Benito-Hernandez et al., (2012) |
| Export (log) | average exports during the last 3 years. | (+) | Autant-Bernard et al. (2010), Grossman and Helpman, (1993), López-Mielgo et al., (2012) |
| ln R&D expenditure | average expenditure in internal and external R&D during the last 3 years. | (+) | Carvalho et al., (2013); López-Mielgo et al., (2012) and González et al. (2016) |
| ln Innov. activities | average expenditure in acquisition of hardware, software and technology, consulting and technical assistance, engineering and industrial design activities, personnel training and market studies during the last 3 years. | (+) | Carvalho et al. (2013) |
| Group | dichotomous variable that takes value 1 if a firm belongs to a network or a corporative group. | (+) | Autant et al. (2010) Montoro-Sanchez et al. (2012) |
| Public | dichotomous variable that takes value 1 if a firm is public. The category of reference is private. | n/a | Montoro et al. (2012) |
| ln workers | average number of employees during the last three years | Ambiguous | Acosta & Coronado (1999) Astudillo & Briozzo (2016) González et al., (2016) |
| ln skilled workers | average of the last 3 years of the number of employees with higher education. | (+) | González et al. (2016), Autant-Bernard et al. (2010) |
| ln experience | the years that the firm is operating in the market. | Ambiguous | Autant et al. (2010) López et al. (2012) Benito. et al., (2012) |
| Markets | the destination markets of exports are included as dichotomous variables: i. Latin America and the Caribbean, ii. United States and Canada, iii. Europe, iv. Asia, v. Africa and vi. Oceania. | López et al. (2012) Crowley & Jordan (2016) | |
| External Factors | |||
| Sector | n/a | Montoro et al. (2012), López et al. (2012), González et al. (2016) | |
| Specialization | (+) | Feldman & Audretsch (1999), Quigley et al. (2005), Claver et al. (2017) | |
| Diversification | (+) | Feldman & Audretsch (1999), Quigley et al. (2005) Claver et al. (2017) | |
| Competition | ambiguous | Feldman & Audretsch (1999) Crowley & Jordan (2017) | |
| Percentage of innovative firms | (+) | Quigley et al., (2005) | |
| Firms’ Density | Ambiguous | Quigley et al., (2005) | |
| Higher education investment growth | Annual growth rate of public investment in higher education projects and higher education institutions. Three growth rates are included: between t and t-1, t-1 and t-2, t-2 and t-3. | (+) | Zambon & Monciardini (2015), Berrutti and Bianchi, 2019 |
| R&D investment growth | Annual growth rate of public investment in R&D projects. Three growth rates are included: between t and t-1, t-1 and t-2, t-2 and t-3. | Ambiguous | (+)Antolin-Lopez et al., (2016) (-) Kim & Lee (2011) |
| Ln population | Number of inhabitants in each province. | Ambiguous | Quigley et al., (2005) |
Elaboration: Authors
Variables of interest
It has been shown that firm agglomeration positively affects innovation, due to the multiple benefits of the geographical proximity. In the present investigation, five agglomeration indexes are considered: the firms’ density, the percentage of innovative firms in the region, the specialization index, the diversification index and the competition index. All these indexes are estimated at the province level, which is the most dissagregated geographical information available in the Innovation Survey.
Firms’ density (Firms’ density) is the number of firms per km2 located in each province. The effect of these variables on innovation probability is expected to be positive. While many authors use the employment density as a measure of agglomeration (Carlino et al. 2007), the firms’ density is a more adequate measure to reflect the agglomeration of the economic activity3. The geographical concentration of firms can have a pronounced effect on the level of innovation of a given firm due to knowledge externalities (Quigley et al., 2005).
Percentage of innovative firms (% of innovative firms) is the number of innovative firms divided by the total number of firms located in the province. The intuition to include this variable is that in an environment with existent innovation activity in a given region, firms would be more encouraged to innovate than in a region with escarse innovation activity (Feldman, 1994).
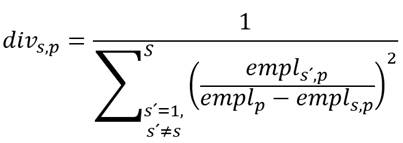
The specialization index (specialization) is defined as the ratio between the proportion of employment of a specific sector within a province, and the proportion of employment of this sector at national level. This index is calculated as follows:

where  is the employment of the sector s in the province p;
  is the employment in the province p, and empl is the total national employment.
This index can take values less than or greater than one. If the index is less than one, the province does not present a relevant level of specialization, if the index is greater than one, the province specializes in the sector concerned. Firms located in a region with high industrial specialization have similar production processes or offer similar products, so when a firm innovates, it generates new knowledge that not only benefits the firm itself, but also generates externalities that promote innovation for other firms located close to it (Claver-Cortes et al. 2017).
The diversity index (diversity) is defined as the inverse of the Herfindahl index of employment for a specific sector and province. This index is calculated as follows:
This index takes higher values when a large number of firms from different sectors are in the province. A positive relationship between this variable and the innovation is expected, since the concentration of different industries promotes the inter-sectoral relations and combined new knowledge that can end in innovation (Feldman and Audretsch, 1999). In addition, it is worth noting that the specialization and the diversity indices are not exactly opposed. Thus, a region can have a large share of a sector and at the same time many other sectors.
The competition index (competition) measures the firms size distribution in terms of employment for a specific sector and province. This index is calculated as follows:
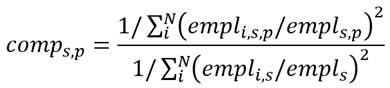
where  is the employment of the firm i that belongs to the sector s in the province p,
  is the employment of the firm i that belong to the sector s.
A high level of competition in a given region works as an incentive for innovation. Firms will decide to innovate in order to improve their productivity and market position, in relation to their competitors (Crowley and Jordan, 2017). However, a negative effect might emerge from a fierce competition that encourage firms to relocate in less agglomerated regions, reducing the level of innovation of the initial region.
According to the descriptive statistics of these variables presented in Tables 3 and 4, the provinces have an average specialization index of 1.11, an industrial diversification index of 1.99 and a competition index of 0.33. The firms’ density on average is 0.27 firms per squared kilometer and the percentage of innovative firms is 42%. In addition, Ecuadorian firms have been operating in the market for around 23 years. The majority of firms belong to the services sector. Firms that develop their activities without cooperation represent the 83.94% of the total number of firms. And most part of the firms focus on the national market.
Table 3 Descriptive statistics of continuous variables
| Variable | Obs | Mean | Std. Dev. | Min | Max |
|---|---|---|---|---|---|
| Sales (log) | 8025 | 14,26 | 2,09 | 0 | 23,31 |
| Export (log) | 8025 | 1,66 | 4,56 | 0 | 22,96 |
| R&D Expenses (log) | 8025 | 1,60 | 3,50 | 0 | 17,22 |
| Inno Activities (log) | 8025 | 3,98 | 5,00 | 0 | 18,17 |
| Employees (log) | 8025 | 3,50 | 1,27 | 0 | 9,21 |
| Qualified (log) | 8025 | 2,11 | 1,36 | 0 | 8,29 |
| Experience (log) | 8025 | 2,95 | 0,57 | 1,79 | 5,30 |
| Specialization | 8025 | 1,11 | 0,87 | 0,03 | 50,62 |
| Diversification | 8025 | 1,99 | 0,42 | 0 | 2,99 |
| Competition | 8025 | 0,30 | 0,20 | 0,00023 | 0,94 |
| Innovative | 8025 | 0,57 | 0,12 | 0 | 1 |
| Firms Density | 8025 | 0,27 | 0,25 | 0,000055 | 0,71 |
| Public inv. education (log) | 8025 | 17,14 | 1,19 | 12,92 | 18,32 |
| Public inv R&D (log) | 8025 | 14,66 | 1,22 | 10,10 | 16,06 |
Elaboration: Authors
Table 4 Frequency of dichotomous variables
| Variables | Yes | Percentage | No | Percentage |
|---|---|---|---|---|
| Group | 1.289 | 16,06% | 6.736 | 83,94% |
| Public | 121 | 1,51% | 7.904 | 98,48% |
| Markets | ||||
| Ecuador | 7.908 | 98,54% | 117 | 1,46% |
| Latin America | 644 | 8,02% | 7.381 | 91,98% |
| USA and Canada | 373 | 4,65% | 7.652 | 95,35% |
| Europe | 299 | 3,73% | 7.726 | 96,27% |
| Asia | 143 | 1,78% | 7.882 | 98,22% |
| Africa | 15 | 0,19% | 8.010 | 99,81% |
| Oceania | 14 | 0,17% | 8.011 | 99,83% |
| Sector | ||||
| Mining | 261 | 3,25% | 7.764 | 96,75% |
| Manufacturing | 2.330 | 29,03% | 5.695 | 70,97% |
| Services | 3.407 | 42,45% | 4.618 | 57,55% |
| Wholesale and retail trade | 2.027 | 25,26% | 5.998 | 74,74% |
Elaboration: Authors
Methodology
According to the literature review, the study about the determinants of firm innovation mainly use choice discrete models, also known as probability models. In these models, the dependent variable explains the decision made by an economic agent based on the individual’s characteristics (Greene, 2003).
This investigation uses a probit model for analyses the innovation probability of Ecuadorians firms. This model has the following specification:
 (1)
(1)
Where 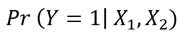 is the probability that a firm innovates, F is the normal standard cumulative density function, are the coefficients of the model, and are the vectors of independent variables
On the one side,  is a vector that contains the internal characteristics of firms. It includes sales, exports, R&D expenditures, expenditures in innovative activities, corporation group, number of workers, number of workers with higher education, years of experience, whether the market is local and whether the firm is public
On the other side,  is a vector that contains the external characteristics of firms. It includes the firms’ density, the specialization index, the diversity index, thecompetition index, the percentage of innovative firms, the growth rate of public investment in R&D, the growth rate of public investment in higher education and the economic sector.
The influence of all these variables on the innovation probability are determined by their corresponding marginal effects. These effects are usually measured in percentage points (i.e. pp) and are calculated around the average of the independent variables.
It should be noted that the model (1) is estimated using robust estimators. The multicollinearity and goodness of fit are analyzed in order to validate the model. The percentage of correct classification measures show that for the general innovation, 82.74% of the observations are correctly predicted. The estimations for the different types of innovation correctly classified at least 74% of the sample.
As a robustness check, the model (1) is also estimated using the logistic method (see Appendix 1). The results are very similar in terms of signs and significance of the coefficients. This fact confirms that the results are robust regardless the applied methodology
Results and Discussion
Table 5. presents the results of the marginal effects of the probit models corresponding to the general innovation in column (1), the innovation of products in column (2), the innovation in process in column (3), the organizational innovation in column (4) and innovation in marketing in column (5).
Table 5. Marginal effects of the estimations of the probit models
| Innovation Type | |||||||
|---|---|---|---|---|---|---|---|
| (6) | (7) | (8) | (9) | (10) | |||
| Innovation | Product | Process | Organizational | Marketing | |||
| External Factors | |||||||
| Specialization | 0.0116 | 0.0190*** | -0.00352 | 0.00663 | 0.00204 | ||
| Diversity | 0.0776*** | 0.0223 | 0.0591** | 0.0322 | 0.0167 | ||
| Competition | -0.0268 | 0.0218 | 0.0790 | -0.0923 | -0.000205 | ||
| % of innovative firms | 0.841*** | 0.420*** | 0.165** | 0.299*** | 0.375*** | ||
| Firms’ Density | -0.243*** | -0.112** | -0.0827 | 0.0512 | 0.0296 | ||
| Growth of public inv higher educ t,t-1 | 0.000948 | -0.00225 | 0.00841*** | 0.000255 | -0.000219 | ||
| Growth of public inv higher educ t-1,t-2 | 0.000539 | -0.00274 | 0.00639* | 0.0112*** | 0.0000808 | ||
| Growth of public inv higher educ t-2,t-3 | -0.00159 | -0.00279 | 0.00174 | -0.000649 | 0.000206 | ||
| Growth of public inv R&D t,t-1 | 0.00344 | -0.0421* | -0.0182 | 0.0547** | -0.0248 | ||
| Growth of public inv R&D t-1,t-2 | 0.0382 | -0.0968*** | -0.00915 | 0.0832*** | -0.0120 | ||
| Growth of public inv R&D t-2,t-3 | 0.0131 | -0.0122 | -0.00552 | 0.0439*** | -0.0106 | ||
| Reference: Services Mining | -0.965* | -0.275*** | -0.0945 | -0.0507 | -0.194*** | ||
| Manufacturing | 0.0620*** | 0.0190 | 0.0890*** | -0.0334* | 0.0503*** | ||
| Wholesale and retail trade | 0.0217 | -0.158*** | 0.00133 | 0.0257 | 0.0534*** | ||
| Population (log) | -0.00570 | 0.0327** | -0.0102 | -0.0442*** | -0.0320*** | ||
| Internal factors | |||||||
| Sales (log) | -0.00385 | -0.0138** | -0.0197*** | -0.00545 | -0.00155 | ||
| Export (log) | 0.00314 | -0.00114 | 0.00637 | 0.00434 | 0.00164 | ||
| R&D exp. (log) | 0.0504*** | 0.0193*** | 0.0140*** | 0.00818*** | 0.00852*** | ||
| Inno Activities (log) | 0.0866*** | 0.0494*** | 0.0685*** | 0.0173*** | 0.0144*** | ||
| Group | 0.0291 | 0.0393* | -0.0153 | 0.00824 | -0.00412 | ||
| Public | 0.0674 | 0.0141 | -0.0448 | 0.0159 | 0.0351 | ||
| Employees (log) | -0.00716 | -0.0282*** | 0.00403 | 0.00741 | -0.0251*** | ||
| Qualified (log) | 0.0404*** | 0.0160 | -0.00172 | 0.0286*** | 0.0276*** | ||
| Experience (log) | -0.0250 | 0.00748 | -0.00342 | -0.0303** | -0.0206 | ||
| Ecuador | 0.154** | 0.159 | 0.0997 | 0.0674 | 0.0980 | ||
| Latin America | -0.00362 | 0.0251 | -0.0905 | -0.0468 | -0.0851* | ||
| USA and Canada | 0.0151 | 0.0273 | 0.0119 | 0.0384 | 0.0814* | ||
| Europe | -0.0196 | -0.0135 | 0.111 | -0.0914 | -0.0471 | ||
| Asia | 0.0151 | -0.0521 | -0.0797 | -0.00951 | -0.008228 | ||
| Africa | -0.741*** | 0.0226 | 0.147 | -0.0552 | -0.168 | ||
| Oceania | 0.890*** | 0.169 | -0.124 | 0.338** | -0.0196 | ||
| Tests of Statistical Significance | |||||||
| LR chi2 (26) | 14601.466 (0.0000) | 11666.412 (0.0000) | 14714.939 (0.0000) | 2834.980 (0.0000) | 2173.345 (0.0000) | ||
| R2 McFadden | 0.4651 | 0.4295 | 0.5197 | 0.1115 | 0.0935 | ||
| Correct Specification | 82.74% | 83.63% | 87.65% | 74.11% | 78.17% | ||
| Sensitivity | 73.23% | 71.02% | 87.43% | 15.99% | 4.76% | ||
| Specificity | 95.24% | 88.53% | 87.76% | 94.97% | 98.52% | ||
| ROC curve | 0.8893 | 0.9045 | 0.9271 | 0.7075 | 0.7071 | ||
| N | 8025 | 8025 | 8025 | 8025 | 8025 | ||
Note: Standard errors in parentheses
*** p<0.01, ** p<0.05, * p<0.1
Elaboration: Authors
Regarding our variables of interest, the agglomeration economies taking place at the province level have an important role for the innovation of firms. First, the firms’ density has a negative general effect on innovation. Despite the fact that firms are concentrated, the probability to innovate decreases4. Contrary to the positive result of employment density obtained by Carlino et al. (2007) for patenting, our negative surprising result might be related to congestion effects. However, as this indicator is measured at the province level which is an aggregate spatial unit where congestion is barely visible, such an explanation could be discarded. An alternative explanation is the resulting significant and positive effect of the percentage of innovative firms. It implies that what matters for innovation is not the density of firms in general but the presence of innovative firms. By looking at the statistics, in 2014, the provinces with low density of firms were Cotopaxi, Orellana and Sucumbíos with 0.028, 0.004 and 00.5 firms/km2, respectively. Yet, these provinces recorded relatively high percentages of innovative firms with 63%, 54% and 53%, respectively. Big provinces such as Pichincha, Guayas and Azuay recorded high fims’ density (0.706, 0.337 and 0.132 firms/km2, respectively) but relatively low percentage of innovative firms (52%, 30.1% and 36.7%, respectively) with respect to small provinces. An increase of 1p.p. in the percentage of innovative firms in a province increases the probability to innovate in 0.841 p.p. The positive effect remains for any type of innovation with a higher effect for organizational and marketing innovation.
While these measures of density and percentage of innovative firms give interesting insights, the specific mechanisms by which the agglomeration leads to innovation is still in question. To tackle this issue, the specialization and diversity agglomeration economies are analyzed. The diversity derived externalities drives general innovation, increasing the probability of innovating in 0.077 p.p. by 0.01 additional units in the diversity index. This result is in line with the argument of Jacobs (1969) explaining that the interactions across firms from different and complementary industries (Feldman and Audresch. 1999) facilitate knowledge spillovers and cross-fertilization of ideas that end in innovation. Specifically, this mechanism takes place for the organizational innovation.
As firms from different industries are not rivals, the knowledge spills over more easily (Claver-Cortes et al. 2016). Thus, when one firm in a given industry innovates in process, other related firms from other industries can adapt such a new practice to their own firms. This effect derived from diveristy is not significant for the other types of innovation, perhaps due to the aggregation of the measure. Importantly, the externalities derived from specialization are not rival with respect to diversity externalities. An increase of 0.01 units in the specialization index of a province leads to a higher probability to innovate in products of 0.019 p.p., which is lower than the effect of diversity.
The geographical proximity to other firms of the same industry favors the knowledge spillovers (Marshall, 1980 and Carlino and Kerr, 2015). Nevertheless, specialization-based agglomeration economies are not significant for other types of innovation. This could be explained by the fact that even though firms of the same sector are close to each other, the knowledge is protected by a certain cluster of firms. Then, the new knowledge constitutes an asset for the cluster that is not easily shared (Breschi and Lissoni, 2001 and Morrison, 2008). Such protection of knowledge is more plausible for process, organizational and marketing innovations as these types of innovation need more deep interactions than just being close to similar firms.
For product innovation, knowledge can be more easily disseminated to other firms through market commercialization. These could be the reasons why the externalities derived from specialization are significant for product innovation but not for process, organizational and marketing innovations. In general, there exists evidence about the predominance of diversity agglomeration externalities over specialization, not only for promoting innovation (Feldman and Audresch, 1999) but also for employment and productivity (Glaeser et al. 1992), as shown by Melo et al. (2009) in their vast literature review.
Regarding the effect of competition, it is not significant for any type of innovation. This could indicate that contrary effects are overcompensated to each other. The positive effect related to efficiency (Gonçalves and Almeida, 2009 and Crowley and Jordan, 2017) might be offset by a negative effect related to strong competition and prevention to access to new knowledge (Claver-Cortes et al. 2016). Moreover, when the level of urbanization is high enough, the competition is fairly strong so that firms instead of innovating to stay in the market, relocate in other places (Guevara-Rosero et al. 2018).
As for the economic sector, a company in the mining sector is less likely to innovate in general innovation compared to the services industry. The probability decreases by 9.7 p.p. By contrast, a firm in the manufacturing sector is 6.2 p.p. more likely to innovate in general innovation, 8.9 p.p more likely to innovate in process and 5.03 p.p. more likely to innovate in marketing in relation to the services industry. In the manufacturing industry, a greater intensity of knowledge predominates, facilitating innovation with respect to the other sectors. Firms in this sector can be adapt more easily to the changes that arise in the market, by developing new products using their current technology (Nicolau, Expósito, and Tomás, 2015). A firm belonging to the wholesale and retail industry has a higher probability to innovate in marketing of 5.34 p.p. and a lower probability of innovating in products by 15.8 p.p. compared to the services industry. The positive effect of marketing innovation is in accordance with the advertising nature of these sectors related to sales.
The annual growth of public investment in R&D and higher education in each of the provinces does not affect the general innovation. However, a 1% increase in the public investment growth in higher education encourages the innovation in process and in organization, increasing the probabilites by 0.0084 p.p and 0.0112 p.p, respectively. This result evidences that public funding of projects aimed to improve the education can change the patterns of innovation in the medium and the long term (Berrutti and Bianchi, 2019). The investment in higher education helps to increase the qualified human capital and in turn the capacity for development and absorption of knowledge (Zambon & Monciardini, 2015). Likewise, the public investmnet growth in R&D is only signifcant for organizational innovation and product innovation. For the former, the effect is positive and consistent through time. For the latter, the effect is negative.
Even though, public R&D investment exists, the government's coordination failures in funding and executing R&D projects make the investment inefficient to achieve the development of new products and processes at the firm level (Kim and Lee, 2011). Therefore, Kim and Lee (2011) and Antolin et al. (2016), suggest developing policy instruments that focus on cooperation, technology commercialization, loans to finance innovation projects, grants to acquire assets, tax cuts, grants for the creation of research centers, among others. It is worth noting that the effects of public investment in either higher education or R&D are not immediate, time is required to observe effects. The population that reflects the size of the market has contrary results. It positively impacts on the probability of innovating in products but negatively impacts the probability of innovating in organization and marketing. The first result can be related to the fact that as the demand increases, firms are required to increase the level of innovation. The negative effect is in line with the negative effect of density of firms.
Regarding the internal factors, while the size of firms, proxied by the turnover and the number of employees, is not significant for the general innovation, it is significant and negative for innovation in products and in process. A 1% increase in the turnover reduces the probability to innovate in products and process in 0.0138 p.p. and 0.0197 p.p., respectively. The larger negative effect in the innovation of process might be because changing processes in big firms is costly. When considering the number of employees, an increase of 1% of employees reduces the probability to innovate in products and marketing in 0.0282 p.p. and 0.0251 p.p, respectively. Generally, these results are in line with many studies arguing that small firms tend to innovate more than big ones due to a better flow of information and less bureocracy (Acs and Audresch, 1988 and López-Mielgo et al., 2012). These firms engage in innovation to stay in the market and achieve a long term growth (Dolińska, 2015). Similarly, the years of operation of a firm in the market exhibit a negative relationship with organizational and marketing innovation. A 1% increase in experience (which corresponds to 2 additional months) decreases the probability of organizational innovation by 0.03 p.p. This result is in line with Benito-Hernandez et al. (2012) who proves that new companies have better ideas to innovate so they can success in the market.
With respect to the R&D expenditure and innovation activities, they have a positive effect for all types of innovation with a higher effect on the product and process innovations. These expenditures very likely lead to the generation of new knowledge that can be incorporated in the development of new products and processes (Carvalho et al., 2013; López-Mielgo et al., 2012 and González et al., 2016). In fact, innovation is the purpose of investing in R&D. A 1% increase in R&D and innovation activities expenditure augments the probability of innovating by 0.0504 p.p. and 0.0866 p.p, respectively. It is worth noting that the positive effect of R&D might contradicts the negative effect of the firm size. One could expect that large firms would innovate more because they spend more in R&D. However, Audresch and Feldman (2004) explain that this might not hold true as small firms can be more innovative due to research conducted at universities while large firms trust in their own laboratorios which need high levels of investment in R&D.
The skilled employees are one important factor to develop innovations because they are those who carry out the R&D activities and can operate new machinery or software that the company acquires (González et al., 2016). The knowledge, skills and abilities of qualified human capital can be used by the firm in order to identify and absorb knowledge to conduct innovation activities more efficiently (Autant-Bernard et al., 2010; González et al., 2016). Therefore, the 1% increase in the number of skilled workers in a firm increases the probability of innovating by 0.0404 p.p. This effect is significant for the organizational and the marketing innovation which is striking since product and process innovations also need to be conducted by these qualified workers.
While the amount of exports do not affect the probability of innovating, the destination market of those exports does matter for innovation. For the interpretation of these results, it is worth noting that as one firm can export to several markets at the same time, the isolate effect of a given market cannot be estimated, so the value of the coefficients cannot be interpreted but the sign and the significance can. If one of the exports destination is Oceania, the probabilities of innovating in general innovation, in product innovation and in organizational innovation increase. Having U.S and Canada as exports markets increases the probability of innovating in marketing. These positive effects are explained by the fact that the presence of a firm in foreign markets requires more innovations to be internationally competitive (Autant-Bernard et al., 2010). By contrast, when one of the exports destination is the African market, the probability of general innovation decreases by 74 p.p. If the Latin American market is one of the exports destination, the probability of innovating in marketing reduces in 8.51 p.p. Those negative effects can be related to the nature of exports to Africa and Latin America which might be agricultural goods or agricultural-based manufactures that do not require much innovation5. Moreover, the non-significant effect of Europe could be explained by the international division of labor where countries like Ecuador have a comparative advantage in primary goods and export them, leaving aside the efforts to innovate in other goods with more valued added. Finally, when a firm focus on the national market, the probability of innovating is increased by 15.4 p.p. This increment is lower than that of the Oceania market, implying that international markets demand more innovation than the national market.
Belonging to a corporate group increases the probability of innovating in products by 3.93 p.p. The cooperation facilitates access to new learning that leads to the implementation of innovations (Montoro-Sanchez et al., 2012 and Dolińska, 2015). In addition, collaborations with other firms reduces costs and risks, so firms can expand their strategic options of innovation in more differentiated products (Antolin-Lopez et al., 2013).
Conclusions
Estimating a probit model, empirical evidence is provided about the determinants of innovation considering individual characteristics of firms as well as external conditions of the regions where they are located. The effects of the determinants vary depending on the nature of the innovation, namely, product, process, organizational and marketing innovations. Regarding the external factors, what further promotes innovation is the presence of innovative firms in a region, rather than the geographical concentration of firms. Firms innovate in environments where the accumulation of knowledge due to past innovations is facilitated (Feldman, 1994). Thus, a policy recommendation could be the promotion of an environment of innovation such that firms have the resources and conditions to engage in innovation. The diversity agglomeration externalities predominate in promoting the general innovation through inter-sectoral interactions of firms that encounter complementary activities. The agglomeration economies derived from specialization are significantly positive only for product innovation while not significant for process, organizational and marketing innovation. The differentiated effect of specialization across types of innovation might be related to the level of protection of knowledge in each type of innovation, being the least protected, the innovation of products, as its diffusion of knowledge can take place through the commercialization of products in the market. This allows the positive and significant effect of specialization externalities for product innovation. Besides, the non significant effect in some types of innovation might be explained by the level of aggregation of the agglomeration economies measures that can be calculated with the available information. The mechanisms of agglomeration might play more deeply at the local level. The innovation benefits of competition have to be fostered and the negative effect likely derived from excessive competition in big cities have to be controlled.
Regarding the individual characteristics of firms, it is the engagement in R&D that yields better results in increasing the probability of innovating in any type of innovation, rather than the size or the experience of firms. An interesting result is obtained from the distinction of the destination markets of exports. Not all the international markets promote innovation, specially those to which local firms export primary goods. As firms are already specialized in producing and exporting those goods, they do not need to innovate to be competitive.
Important policy implications might be drawn from this investigation. First, as the main driver of innovation is the R&D expenditure, firms have to develop R&D projects with specific objectives such that innovations can emerge. Therefore, the role of government is crucial in the R&D promotion not only by direct investment but also by establishing policies of tax incentives, grants for the creation of research centers, among others. As the public investment in higher education and R&D takes time to produce a significant effect, medium-term policies have to be proposed to increase the level of innovation of firms. As the diffusion of knowledge is required to benefit from the agglomeration externalities of diversity, specialization and competition, policies of cooperation and research collaboration across industries and between them and the academy are necessary. Moreover, as firms lie on the capacities of qualified workers to increase their level of innovation, the government is required to devote resources on the accumulation of human capital in the different regions without neglecting the smaller ones.
It is recommended to extend the results presented here by estimating econometric models for different firm segments, for instance economic sectors, provinces, public or private firms, firms that exports or produce locally, etc, since the innovation in each segment could be motivated by different reasons. While the results of this study shed light about the relationship between innovation and the agglomeration economies, a further research step is to determine the causal relationship between them by considering the endogeneity issues.

