


 Inglês (pdf)
 Artigo em XML
 Referências do artigo
 Enviar este artigo por email
 Citado por SciELO
  Similares em
SciELO
Similares em
SciELO 
 Permalink
Introduction
The analysis of similarities between business cycles of different countries is important, at least for a couple of reasons. Firstly, economies with similar business cycle characteristics may apply common macroeconomic policies, thus coordinating actions, efforts and initiatives to successfully cope adverse shocks. Secondly, if demand spillovers arise, we might expect trade integration to increase cycles’ correlations, and a consumption boom in one country can generate demand for imports, boosting economies abroad. From this perspective, free trade agreements will surely augment bilateral trade flows.
The interest in the analysis of the symmetries and asymmetries of business cycles emerged in the nineties when several regions of the world were involved in economic integration processes. For these regions, the existence of similarities in the business cycles of their countries has been considered a necessary condition for the harmonization of policies and institutions (see for example Christodoulakis et al., 1995; Mejía-Reyes, 1999; Arnaudo and Jacobo 1997).
Despite its importance, the analysis of a common business cycle has not been a significant element in the economic research agenda in developing countries. As to Latin America in particular, the existing studies have suggested that there has not been a past common economic cycle. Nevertheless, it is possible to find a common one for some subsets of countries, as suggested by Engel and Issler (1993), Arnaudo and Jacobo (1997), Mejía-Reyes (1999), Jacobo (2002), Gutierrez and Gomes (2006), and Aiolfi et al. (2006). However, due to the lack of interest in deepening the integration process, the analysis of common business cycles has disappeared from the regional literature. Moreover, to our knowledge, the studies about business cycles synchronization between Latin American and European Union (EU) countries have been non-existent.
In this paper, we summarize the co-movements of Argentina and Brazil, two of the most representative economies in the region in terms of production, population and trade. Additionally, we explore the evidence of business cycle synchronization between these economies and their main EU trading partners. We perform the analysis for the period 1995-2018 because the nineties marked an era of globalization with deliberative efforts to achieve a higher degree of trade and financial liberalization and the interdependence has increased. Hence, our interest is to study whether their economic fluctuations follow a similar pattern.
We contribute to the literature in the following ways. First, we briefly highlight previous studies on the topic. Second, we report Argentina and Brazil’s macroeconomic co-movements with the EU partners. Third, while Hodrick and Prescott filter is applied to decompose the series into a trend and a cyclical component as usual, a novelty in our study is the use of a more reliable estimation procedure than the data-modification method in the X-11 to seasonally adjust the series called Seasonal and Trend (STL is its acronym) decomposition using LOESS.
The rest of the paper is organized as follows. Section 2 briefly outlines the literature. Section 3 presents the estimations and results. Section 4 concludes.
Literature review
There is an enormous literature trying to document some evidence about cyclical fluctuations after Kydland and Prescott’s (1990) reports if the U.S. business cycle facts. This reactivation (with a different methodology) of the research agenda of Burns and Mitchell in the 40s generated worldwide country-specific works with the same structure as that of Kydland and Prescott’s. Although there are some studies about individual economies, Latin American countries were left aside from this line of research mainly for their instability and lack of data (Mena, 1995).
A related literature reports the extent to which the countries appear to be symmetric or asymmetric with respect to the nature of shocks underlying their economies. 1 The argument is that if the shocks that are impinging upon a particular economy and the rest of the countries do so differently, then the monetary and fiscal policies cannot be carried out efficiently. In this framework, the incidence of disturbances across regions is a critical determinant of the design of a currency area, and countries would find it optimal whenever the nominal exchange rate is not necessary to adjust real one at every time that these economies face asymmetric shocks. Again, and not surprisingly, while numerous empirical studies have been developed for the case of the EU, only marginal attention has been given to Latin America.
As to the studies of this region, several authors focus on the presence of past symmetries and asymmetries of Latin American business cycles. These include the works of Engel ad Issler (1993), Arnaudo and Jacobo (1997), Mejía-Reyes (1999), Agénor, McDermott and Prasad (2000), Cerro and Pineda (2002), Jacobo (2002), Gutierrez y Gómez (2009), Aiolfi et al. (2006), and González et al. (2012). Most of these studies not only analyze the correlations but also the underlying mechanism provoking business fluctuations through time.2
Engel and Issler (1993) analyze the short and the long-run co-movements of the GDP for Argentina, Brazil and Mexico. These authors suggest that these three countries share the same growth trend and economic cycle, among other findings.
However, according to Arnaudo and Jacobo (1997) this seems not to be the case for the Southern Common Market (MERCOSUR) countries. They deal with the macroeconomic behavior of these economies (Argentina, Brazil, Paraguay and Uruguay) during twenty-five years. Even if it is a lot of discretion in obtaining the business fluctuations, when expansions and contractions are compared within countries their duration is variable and the degree of persistence is small. Furthermore, the relationship between GDP and each of its components (with the exception of consumption) seems to be poor. According to the authors, the simultaneous relationships are different in time and size, although they find a significant correlation of those for Argentina and Brazil.
As to Mejía-Reyes (1999), he also finds a strong coincidence between the business cycles of Argentina and Brazil, and between the ones of Brazil and Peru, although he does not find any for the entire block. Precisely, he provides further evidence on the synchronization between business cycle regimes in seven American countries by using a classical business cycles approach. Despite the increase of international economic transactions within the continent, his results suggest that national business cycles are largely idiosyncratic (except for the United States and Canada). Thus, international macroeconomic policy coordination may not be effective, not at least in the short-run. Also, as a byproduct, he finds evidence of asymmetries between expansions and recessions in mean, volatility and duration of the business cycles in most of the countries.
Agénor, McDermott and Prasad (2000) document cross-correlations between macroeconomic fluctuations and other macroeconomic variables (such as fiscal variables, wages, inflation, money, credit, exchange rate and trade) for twelve developing economies, with a different scope. They conclude that there are similar relationships with those observed in developed countries (counter-cyclical government expenditures, for example), as well as other results.3
Cerro and Pineda (2002) measure and explain to what extent Latin American countries’ growth cycles experienced co-movement in the last forty years, using different methodologies. In a motivating paper, they find that short-lasting cycles showed a great dispersion among cyclical correlation, while long-lasting ones displayed considerable co-movement. From the Structural Vector Autoregression approach, the results imply a very low degree of co-movement among the shocks affecting these economies. There exist important differences regarding to the speed of adjustment and to the volatility of demand shocks. According to the authors, Latin-American countries needs more policy coordination prior to any attempt to go further into an economic integration process.
According to Jacobo (2002), who deals with the macroeconomic behavior of Argentina, Bolivia, Brazil, Chile, Paraguay and Uruguay for twenty-seven years, the arrhythmical beat among these economies in the past reveals there is little point in trying to align macroeconomic policies, thus concluding that the economies behave different.
Aiolfi et al. (2006) conducted a study for the most important Latin American economies in terms of GDP (Argentina, Brazil, Chile and Mexico). Throughout the results, they conclude that international economic interdependence and similar economic policies make the business cycles less volatile at the same time that these countries have started a commercial and financial openness. These expectable results tend to be in line with those suggested by Frenkel and Rose (1998).
It worth to mention the work of Gutierrez and Gómes (2009) who analyze the business cycles of the MERCOSUR’s members. Once the authors estimate the business cycles, they proceed to analyze them in order to see if there is some degree of synchronization. Despite the evidence of common features, the results suggest that the business cycles are not synchronized. This may generate an enormous difficulty to intensify the agreements in the MERCOSUR.
Likewise, González et al. (2012) analyze the synchronization of economic fluctuations in Latin America and present new evidence regarding the cyclical behavior of real GDP. Despite some important relations observed, the existence of a common cycle that invites us to think that full synchronization is not detected.
As we have previously said, it must be mentioned that the process of creating the EU has triggered a substantial amount of research to better understand the preconditions for a monetary union. If coincidences in business fluctuations exist, policies to cope with the cycle can be effectively design. However, as far as we know, studies on the business cycles synchronization between Latin American and EU countries as we shall pretend to do seem to be inexistent.
Materials and Methods
To define the business fluctuations, we need to previously extract GDP trend by some procedure. As proposed by Kydland and Prescott (1990), we use the Hodrick-Prescott (H-P) filter. This filter is one of the most popular statistical methods for time series to obtain the cycle.
It is a mathematical tool used in macroeconomics to remove the cyclical component of a time series from raw data. The H-P filter is used to obtain a smoothed-curve representation of a time series, one that is more sensitive to long-term than to short-term fluctuations. The adjustment of the sensitivity of the trend to short-term fluctuations is achieved through a minimization problem by modifying a multiplier λ. The choice of the value of 𝜆 depends on the frequency of the data. For quarterly data, Hodrick and Prescott propose to adopt the value of 1,600.4
Notwithstanding the H-P filter has some critics, as described by Ahumada and Garegnani (1999), as well as detractors (Hamilton, 2017), Ravn and Uhlig (2001) suggest that none of the undesirable properties of the filter are particularly convincing and that the H-P filter has stood the test of time. Besides, it is important to emphasize the fact that H-P filter allows the researchers to easily compare the results with those of other works that have adopted the same methodology.
To use this procedure, the series must be previously adjusted to remove its seasonally A common technique to decompose a time series is the X-11 procedure, which was developed in the 1950s and 1960s and includes (at that time) modern statistical ideas, like the backing-fitting algorithm (iterative estimation of the trend, seasonal and regression components) or robust estimation. As a minor novelty, we use a more reliable estimation procedure than the data-modification method in the X-11 to seasonally adjust the series called Seasonal and Trend (STL is its acronym) decomposition using LOESS.
The STL method incorporates some new knowledge about backing-fitting which allows it to prevent the seasonal and trend components from competing for the same variation in the series. Locally weighted regression, or LOESS, is a way of estimating a regression surface through a multivariate smoothing procedure, fitting a function of the independent variables locally and in a moving fashion analogous to how a moving average is computed for a time series. In other words, it is a method for fitting a smooth curve between two variables. The procedure originated as LOWESS (LOcally WEighted Scatter-plot Smoother). It has been extended as a modelling tool because it has some useful statistical properties.
The biggest advantage LOESS is the fact that it does not require the specification of a function to fit a model to all of the data in the sample. In addition, LOESS is very flexible, making it ideal for modeling complex processes for which no theoretical models exist.
With respect to statistical information, we use GDP quarterly data from 1995 (1995.1) to the 2018 (2018.4). The series have been obtained from the International Financial Statistics database of the International Monetary Fund.5 All the series are expressed in logarithms. Those variables that are not plausible to be transformed into their logarithmic form are expressed as a percentage of GDP.
As to the indicators, we use the standard deviation to perceive the variability of each series. We also estimate the correlation coefficients ρ j for 𝑗=0;±1;±2;±3;±4. Based on these estimates, the degree and direction of the movement of each variable is compared with GDP. When the contemporary values of the variable change in the same direction as those of the cycle’s indicator 𝜌 𝑗 >0 , that variable is said to be pro-cyclical; when the change occurs in the opposite direction 𝜌 𝑗 <0 , it is said to be counter-cyclical; and when the correlation coefficient is close to zero, it is said to be a-cyclical. We also determine if a variable precedes, follows or coincides with the actual GDP fluctuation. If 𝜌 𝑗 reaches its maximum value for a 𝑗<0, the variable precedes the product. Similarly, if 𝜌 𝑗 reaches its maximum value for a 𝑗>0, the variable changes after the cycle indicator and follows the cycle. Finally, if 𝜌 𝑗 reaches its maximum value for 𝑗=0, the variable coincides with the GDP cycle.
Estimation and results
In this section, we present the results and try to observe whether or not a certain degree of homogeneity exists between Argentina and Brazil and we also examine the business cycles synchronization with their main EU trading partners.
Co-movements between Argentina and Brazil
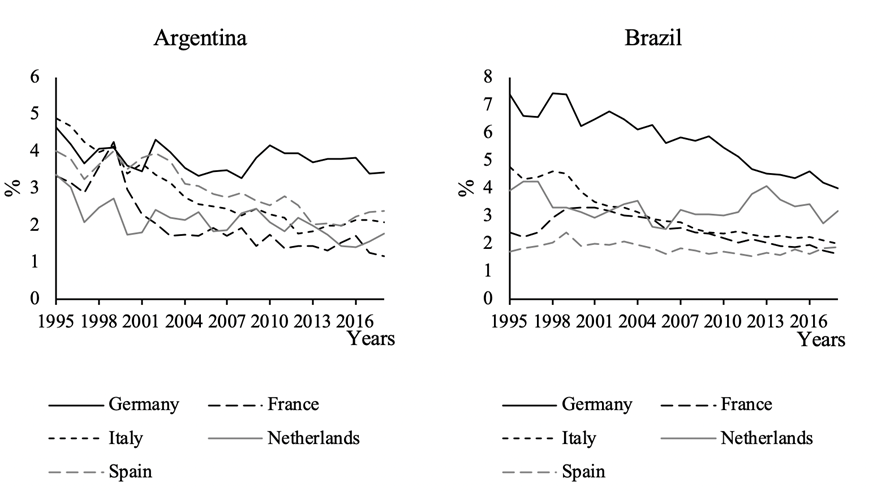
The purpose of this subsection is to illustrate the relation between the business cycles of Argentina and Brazil and to show the correlation between both cycles and their cyclical components. Figure 1 presents the evolution of the business cycle of Argentina and Brazil, and Table 1 summarizes some of our findings.

Source: Own estimates based on International Financial Statistics (IMF)
Figure 1. Business Cycles of Argentina and Brazil
At a glance, Argentina’s GDP recessions are sharper and longer than those of Brazil. The average length of Argentinean recessions is roughly 2 years, while in Brazil they last year and a quarter, and this is not an unexpected result. In fact, disregarding specific shocks that may have affected each country, Brazil has implemented better policies than Argentina.6 Moreover, this volatility of Argentina’s GDP (2.36 times of Brazil’s GDP) is extended to all GDP components: private consumption is almost three times more instable (2.98), public consumption and investment are nearly twice (1.98 and 2.00 respectively), and exports (1.37) and imports (2.27) also reflect more variability.7
If we consider the percentage of quarters over the total quarters analyzed in the sample when both cycles have the same sign (both positive or both negative), the highest coincidence is observed in GDP (72% of our observations of both variables are at the same side of the zero line). This means that whenever one country is undergoing a negative (or positive phase), the same is happening in the other country. However, there is no deterministic order of this coincidences. A randomness test cannot gather enough evidence against the null hypothesis of randomly ordered observations (i.e. there is no guarantee that periods of coincidence should alternate at high frequencies or remain stable for long periods of time). As to the rest of the variables, the coincidences drop to nearly 50% (with the exception of net exports, for which the coincidence is close to 40%).8
Table 1. Argentina and Brazil: Business cycles features (1995.1 - 2018.4)

Source: Own estimates based on Internacional Financial Statistics (IFM)
The only Argentinian variables that seem to have a significant correlation with its Brazilian counterpart are GDP, private consumption and imports, but these correlations are rather moderate. Brazil leads Argentina’s GDP cycle (it is one quarter ahead) with a coefficient of about 0.29, and it leads Argentina’s private consumption cycle (again, Brazil is one quarter ahead) with a coefficient of roughly 0.21. That is, Brazil’s GDP and private consumption acts pro-cyclically. As to imports, their cycle is lagged 4 quarters (-0.36) with the highest and statistically significant coefficient.9
Argentina, Brazil and the EU: Are they better together?
The EU trade with Latin America is particularly significant. As to Argentina and Brazil, according to the last information available, their total trade with the EU has reached 117 billion US dollars and has represented nearly 21% of the total trade.10 The most important EU trading partners of Argentina are Germany (with nearly 3.4% of total trade) and Spain (2.4%), while the main trading partners of Brazil are Germany (4%) and the Netherlands (3.2%). Figure 2 shows the shares of the five EU main partners over the total trade for 1993-2018.11 The shares with the EU countries are quite stable throughout the period, despite the increasing presence of China in total trade.12
Source: Own estimates based on World Integrated Trade Solution (World Bank)
Figure 2. Argentina and Brazil main EU trading partners: 1995-2018 (in % over total exports and imports with the EU)
As to Argentina, exports with its main EU trading partners consist mainly of raw materials, intermediate goods and food products, while imports include capital goods, machinery and electricity and consumer goods. As to Brazil, exports consist of intermediate goods, capital goods and raw materials, while Brazilian imports involve capital goods, intermediate goods and chemicals.13
To obtain the EU business fluctuations, we employ the STL decomposition procedure to raw data and we use the H-P filter as we have previously done with Argentina and Brazil. Table 2 shows the main features of the GDP business fluctuations of Argentina and its EU trade partners, while Table 3 presents this information for Brazil.
Table 2. GDP Business cycle features of Argentina and its main EU trading partners (1995.1 - 2018.4)

Source: Own estimates based of International Financial Statistics (IMF)
Notwithstanding its relative macroeconomic instability, Argentina has significant pro-cyclical correlations with all its EU trading partners. In fact, not only its business fluctuations are correlated with those of Germany (0.26) and Spain (0.25) but also they are correlated with France (0.35), Italy (0.44) and the Netherlands (0.44). Business fluctuations clearly coincide in the cases of Germany and Italy, and are lagged in the rest of the cases.14
As to Brazil, there is not any significant correlation with its main EU trading partners (i.e. Germany and The Netherlands), and there exists a negative correlation with the rest of the countries. The correlation with Spain (-0.30) is lagged two quarters and with Italy (-0.26) is lagged four.15
Thus, the EU countries seem to have a business cycle that is more closely related to the cycle of Argentina, since Brazil fails to have a significant correlation with two of its main trading partners and it has a counter-cyclical co-movement with the remaining countries of the set.
Table 3. GDP Business cycle features of Brazil and its main EU trading partners (1995.1 - 2018.4)

Source: Own estimates based of International Financial Statistics (IMF)
As known, economic theory does not provide definitive guidance regarding the impact of trade on business cycle synchronization, and the international trade linkages may cause different spillovers across countries. A consumption boom in one country can generate demand for imports for example, boosting economies abroad. Through this type of spillovers effects, strongest international trade linkages will result in more highly correlated business cycles. This also can occur if trade is mainly of intra-industry type (or vertical specialization is present in the various stages of production). However, if trade is à la Heckscher-Ohlin, greater specialization would provoke the industrial structures of the trading countries to diverge, resulting in less synchronized movements. A complete analysis of the underlying causes of these results goes beyond the scope of this paper. Nevertheless, we try to go a little step further.
To this respect, Table 4 disentangles the correlations between the cyclical behavior of trade variables for Argentina with respect to the business fluctuations of the EU trading partners. Table 5 presents the same information for Brazil.16
We can timidly infer that the Argentinian export linkages with France, Germany, Italy and Spain generate demand-side spillovers (a boom in these economies certainly generate movements on trade), or that the relationships produce supply-side spillovers (trade is mainly of intra-industry type or vertical specialization in various stages of production). A similar conclusion arises when analyzing import linkages, with the exception of Spain. Since Argentinian production appears to be poorly integrated with the EU, an explanation rather than vertical specialization is more likely to be appropriate. As a consequence, greater trade integration with these economies is expected to lead to a higher synchronization.
Table 4. Argentinean trade cycles and EU main partners business cycles (1995.1 - 2018.4)
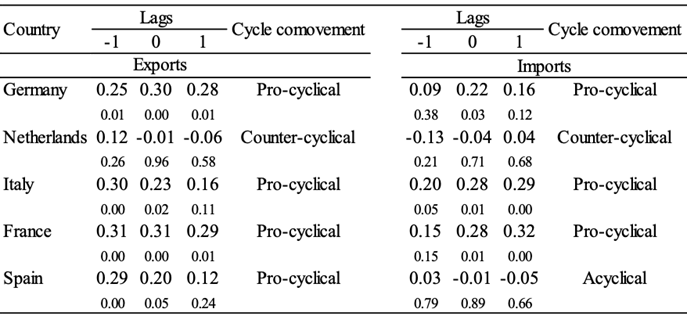
Note: Correlation coefficients are estimated between Argentinean supply (demand) for exports (imports) in period t and the partners GDP in period t + k.
Source: Own estimates based on International financial Statistics (IMF) and National Institute of Statistics and Censuses (INDEC).
Table 5. Brazilian trade cycles and EU main partners business cycles (1997.1 - 2018.4)
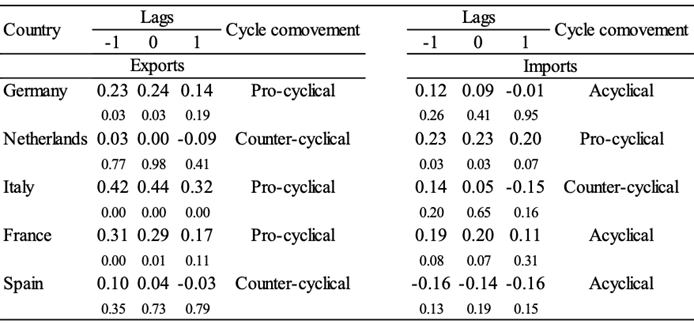
Note: Correlation coefficients are estimated between Brazilian supply (demand) for exports (imports) in period t and the partners GDP in period t + k.
Source: Own estimates based on International financial Statistics (IMF) and Brazilian Institute of Geography and Statistics.
As to Brazil, its export linkages with France, Germany and Italy tend to generate demand-side spillovers. When analyzing import linkages, the correlations with the Netherlands and France seem to be the relevant ones. However, due to the different productive profile of Brazil, the spillovers are probably closer to vertical specialization. However, future research agenda will surely shed further light on this topic.
5. Concluding remarks
This paper explores whether the economic fluctuations of Argentina, Brazil and their main European Union (EU) trading partners followed a similar pattern for the period 1995.1-2018.4.
When both South American economies are analyzed together, the highest coincidence is observed in Gross Domestic Product (GDP) fluctuations (almost 75% of the observations lie on the same side of the zero line). However, as to the rest of GDP components, a drop is observed in the coincidences (the observations are close to 50%). While Argentinian GDP, private consumption and imports have a significant correlation with their Brazilian counterparts, this association is rather modest.
As to the business cycles synchronization with the main EU partners, the EU countries (Germany, Spain, France, Italy and the Netherlands) seem to have a business cycle that is more closely related to the cycle of Argentina. However, Brazil fails to have a significant correlation with two of its main trading partners (Germany and the Netherlands) and it has a counter-cyclical co-movement with the remaining countries (Italy, France and Spain). As a consequence, trade integration is likely to lead to a higher business cycles synchronization for Argentina. In other words, with regards to free trade agreement of these countries with the EU, it seems to be positive for Argentina, but it does not at all for Brazil.
Despite these remarks, however, only time will definitively tell whether or not these economies will be better together. We hope they will surely be.


