


 Español (pdf)
 Articulo en XML
 Referencias del artículo
 Enviar articulo por email
 Citado por SciELO
  Similares en
SciELO
Similares en
SciELO 
 Permalink
Introducción
Located at the intersection of Europe and Asia, Istanbul is one of the fastest-growing cities in the world. Although the population of the city was less than one million in the early 20th century (Turan, 2011), today it stands at approximately 16 million people. In addition to the rapid changes that have occurred over the last century, Istanbul also has historical roots that can be traced back almost 5000 years (Müller-Wiener, 2001). This long history has provided the city with a multilayered palimpsest (Turgut, 2021) containing unique building typologies (Çınaryılmaz & Ar, 2020) and urban textures. Over time, both the physical layers of the city and the maps representing the city at different scales have changed and diversified, however, there are three accepted basic historical layers: Byzantion, Constantinople, and Istanbul (Müller-Wiener, 2001). These layers include a wide variety of building typologies that range from baths to monumental columns, from ports to hippodromes and churches, from palaces to squares, streets, and water structures, from madrasas to mosques, and from fortresses to tombs and civil structures. This study focuses on the Istanbul of the first half of 20th century and its maps.
The fires that devastated major areas of Istanbul, especially those that occurred during the late 19th century, played a major role in the preparation of risk maps for the insurance companies of the period. The most well-known Istanbul maps from the early 20th century can be listed as the Goad Series (1904-1906), the German Blues (1913-1914), and the Pervititch Maps (1922-1945). The Goad Series gives building footprint, function, and material information (Archnet, 2021) (Figure 1a). The German Blues maps contain street, boulevard, and buildingblock information; as well as that of essential buildings such as palaces, embassies, and fire stations (Dağdelen, 2006). However, the German Blues maps do not contain individual building contours or building materials (Figure 1b). The Istanbul Pervititch Maps (IPMs) produced by Jacques Pervititch cover the construction types of buildings as well as data regarding protuberances and roofs, walls and openings, and the number and height of floors. These maps also include streets and their numbering systems as well as green areas, and use legends with abbreviations and other symbols (Pervititch, 2000) (Figure 1c).
In total, there are 243 Istanbul Pervititch Maps, and these are considered to be an important historical data source for the architectural settlement and urban texture of the city between 1922 and 1945. The web portal of the Istanbul Metropolitan Municipality Atatürk Library Digital Archive and E-Sources (2021) provides online access to all of the IPMs. However, the maps were drawn at various scales (1:250, 1:375, 1:500, 1:600, 1:750, and 1:1000), and there are also index maps drawn at scales of 1:2000, 1:2400, 1:4000, and 1:5000. Therefore, when they are put together, the maps do not constitute a regular grid and overlapping parts emerge. In addition, each map has its own unique orientation (Figure 2). Since these maps were generated over a period of 23 years, there is also differentiation with regard to the urban texture (Figure 3) they represent. Apart from the aforementioned differences within the maps themselves, there are also the challenges that arise when attempting to compare historical maps with those of today. The graphical and textual representation techniques are completely different, as are the layers and the conveyed information. To date, there have been very few studies that have attempted to bring the IPMs and current maps of Istanbul together (Istanbul Urban Database, 2021; Sen, 2020).
Matching a historical map with its current counterpart is a very laborious and time-consuming task. Therefore, this study aims to provide a framework for research that will combine and compare the IPMs with the maps of today. Moreover, this study is also aimed to provide input for further research on the semantic segmentation of maps. Semantic segmentation, or image segmentation, is the process of clustering similar parts of an image together. However, using this technique to compare two maps requires their having the same visual (pixel-level) data. The visual outputs of this study are intended to form a base for this pixel-level prediction.
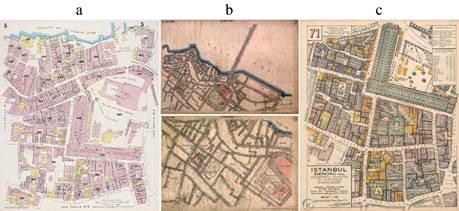
Source: (a) Archnet (2021), (b) Dağdelen (2006), (c) Pervititch (2000)
Figure 1: Maps of Yeni Mosque and its surroundings (a) Goad Series; (b) German Blues; (c) Istanbul Pervititch Maps
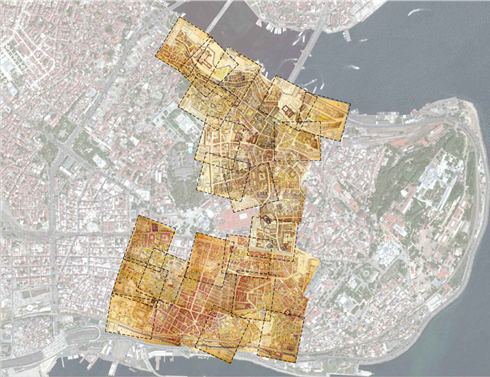
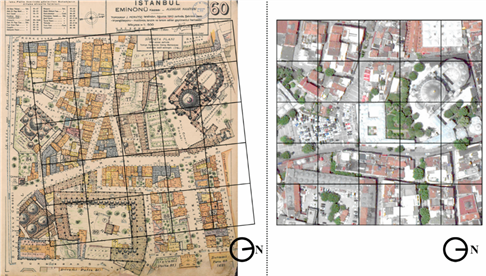
Source: Own elaboration (2022)
Figure 2: Warping IPMs on the SV of the Historic Peninsula of Istanbul
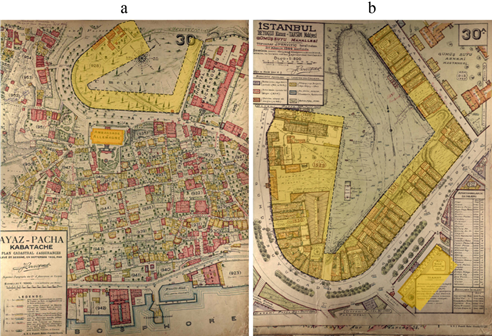
Source: Own elaboration (2022)
Figure 3: Surroundings of the German Consulate in Istanbul (a) IPM from 1926; (b) IPM from 1944
With these aims in mind, this study proposes a machine learning-based framework to transform any of the given IPMs to a target representation format, and vice versa. In other words, the study focuses on a style and information transfer between a given and a target domain. The proposed framework employs CycleGAN algorithms
(Zhu et al., 2017). To achieve this, satellite views (SVs) from the Istanbul Metropolitan Municipality (Istanbul Metropolitan Municipality - Directorate of Geographic Information Systems, 2021) were taken as a basis for the implementation of the framework. Specifically, untagged satellite images taken in 2021 were used as the target domain. The initial results of the implementation show that the proposed model can transfer attributes such as green areas, construction techniques/materials, and labels/tags from the IPMs to the SVs, and vice versa. The outcomes of the study are expected to be useful for the non-expert users who will be able to compare the 20th-century IPMs and 2021 satellite images as well as for experts in the fields of architecture, design, urban studies, and geomatics.
2. Background
The reconstruction of new maps by using historical data is not a new topic (Chiang et al., 2020). Historical maps are a crucial data repository that has the potential to allow new understandings of changes to specific features such as loss of habitat (Bromberg & Bertness, 2005), landscape development (Haase et al., 2007), land use (Fuchs et al., 2015), cost line (Ciski & Ogryzek, 2018), human settlement pattern (Uhl et al., 2019), style transfer (Kang et al., 2019; Li, 2019), building footprint (Heitzler & Hurni, 2020), railroads, water lines (Duan et al., 2020), roads (Duan et al., 2020; Wang et al., 2020), and urban texture (Sen, 2020).
Bromberg and Bertness (2005) compared historical maps and current GIS data with a specific focus on the loss of salt marshes. In their study, both materials contained the same type of data, which enabled a proportional comparison of the losses in the habitat (Bromberg & Bertness, 2005). Haase et al. (2007) presented four case studies in which they investigated landscape use in rural areas, the development of urban areas, the functionality of outskirts, and multifunctional areas through the comparison of historical and current maps. The information taken from the historical maps was first transferred to the GIS platform before any comparisons were made (Haase et al., 2007).
Fuchs et al. (2015) proposed a three-fold approach that includes historic maps, historic statistics, and historic reconstruction. The focus of their study was the classification of forested and non-forested areas while fusing different types of data within the same map reconstruction. They also suggested a ratio formula for the evaluation of the reconstructed maps through a pixel-based comparison of forested areas. In their study, Ciski and Ogryzek (2018) examined a coastline over a period of 350 years through the use of 10 selected maps. By digitalizing these historical maps, they were then able to offer a chronological comparison of the study area and an examination of the similarities between time-periods.
When it comes to automatic data extraction and processing methods beyond an analog examination of the historical maps, machine learning techniques have become part of the agenda. Uhl et al. (2019) presented a generalizable machine-learning-based approach for automatic data extraction from a given visual content. They utilized convolutional neural networks (CNN) for the extraction of features such as buildings, urban areas, and other features from historical topographic maps made between 1893 and 1954. Another popular ML-based method for information and style transfer from historical maps is the use of generative adversarial networks (GAN). Kang et al. (2019) focused on style transfers from Google Maps, OpenStreetMap (OSM), and painted artwork to unstylized GIS vector data by using GAN and Pix2Pix. Li (2019) presented a workflow in which a conditional generative adversarial network (cGAN) was utilized to convert recent maps taken from OSM to historical maps. This used a dataset covering 75000 images generated from 7482 base images, with each base image converted into 10 image-text (label) pair images (Li, 2019).
Duan et al. (2020) introduced a vector-to-raster image conversion algorithm based on reinforced learning methods. They tested this algorithm in an experiment that used three historical maps from different periods and three selected features (railroads, water lines, and roads). Similarly, Wang et al. (2020) proposed a machine-learning-based method for the extraction of a particular feature, namely a cross-domain road, from optical images and evaluated the results of the proposed method, CycleGAN, and ground truth.
To date, there have been limited attempts to implement digital methods in the particular case of the Istanbul Pervititch Maps. In a recent study, Sen (2020) introduced a case study that compared the IPMs to modern maps. The IPMs covering the Eminönü District were reconstructed using the graphical representation techniques of present maps by using ArcGIS 10.1. The reconstruction included the manual segmentation of building materials (reinforced concrete, vault, wooden, mixed, unclassified, etc.) and building types (factory, khan, mansion, fountain) (Sen, 2020).
Unlike the examples given above, this study is believed to represent the first attempt to introduce a ML-based framework to automate the transfer of style and information between the Istanbul Pervititch Maps and present-day satellite imagery.
3. Method
This section presents the architecture of the ML-based framework, and the implementation of that framework in the data collection, data preparation, and training phases. With regard to studies into the implementation of ML-based models in the conversion of maps, Balci et al. (2020) presented a case study in which satellite images of Istanbul were automatically converted to fictional maps for digital games through the use of CycleGAN, a subset of generative adversarial networks (GAN). In another study, Andrade and Fernandes (2020) demonstrated a method by which conditional GAN could be used to transform historical maps into images
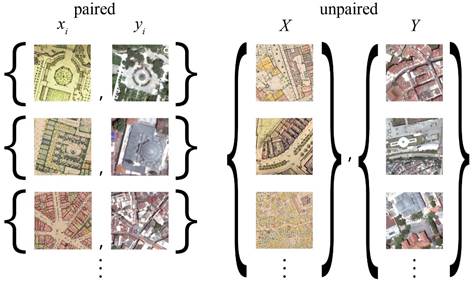
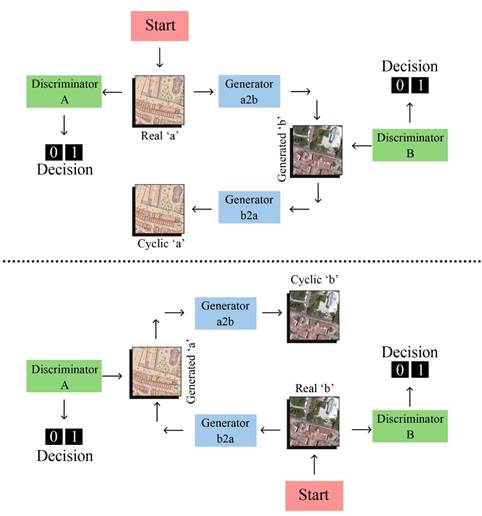
that resemble satellite data. Furthermore, Crommelinck To operate, CycleGAN requires two sets of images at a size et al. (2016) presented a review of a vast number of of 256x256 pixels. This means that existing images must studies that focused on automatic feature extraction be converted to the correct image format during the data from high-resolution satellite images for use in cadastral preparation process. In this study, the initial maps (IPMs) mapping. Automatic feature extraction does not fall are larger than the CycleGAN requirement and have an within the scope of this study, instead, the outcomes of edge length of 2500-3500 pixels. Before CycleGAN was the proposed ML-based model manifest a potential to be applied, the Pix2Pix (Isola et al., 2017) algorithm was used in future semantic segmentation studies. used to test the applicability of the framework. However, the results from Pix2Pix led to an overfitting problem that This study differs from those previously mentioned in CycleGAN avoids because it does not require a one-toterms of its context, its source and target images, the one mapping between a source and a target domain. In size of the dataset, and the operations included in the other words CycleGAN can produce results without the data preparation process. Moreover, in this study, both need for a dataset of paired images. Although this study the source and target images are taken from real maps is focused on translating map styles, it does not require (the Istanbul Pervititch Map collection and satellite views a training dataset from IPMs manually converted to SVs. supplied by the Istanbul Metropolitan Municipality). This allows the development of a translation model of Whereas Balci et al. (2020) used fictional game maps the research problem where training datasets do not and Andrade and Fernandes (2020) used Google satellite exist (Figure 4). images as targets. The main contribution of this study is to develop a ML-based framework that automatically In a paired dataset, every image is manually mapped to transfers style and information from a given to a target a corresponding image in the target domain according to context. various shared features. Pairing is done to ensure that the input and output share some common features. The proposed framework uses the generative adversarial This mapping defines a meaningful transformation of an network (GAN) technique first introduced in 2014 image from one domain to another. With paired datasets, (Goodfellow et al., 2014). The architecture of GAN is based the generator must take an input (real ‘a’) from Domain A, on two parts, namely a generator and a discriminator. including the IPM dataset (DA), and map this image to an The term “adversarial” indicates the competition output image (generated ‘b’) which must be close to its between the generator and the discriminator where the mapped counterpart. However, this study uses unpaired generator is expected to generate new images based on datasets, and as there is no predefined meaningful a given source image and the discriminator is expected to transformation it becomes necessary to create two GAN classify the generated images as real or fake (Goodfellow architectures. In the first GAN, ‘Generator a2b’ maps the et al., 2014). CycleGAN is an implementation of GAN input image (real ‘a’) from DA to an image in the target that was introduced in 2017 (Zhu et al., 2017). More domain that refers to Domain B, which includes the SV specifically, CycleGAN is a subset of an ML technique dataset (DB) as seen in Figure 5 (top part). To make sure that requires both source and target images during its that there is a meaningful relationship between these training process. The advantages of CycleGAN in style images, they must share some features that can be used transfer studies are its reversible implementation from to map this output image back to the input image. Thus, a source image to a target image and vice versa, and there must be another generator (‘Generator b2a’) that its independence from pixel level matching. CycleGAN can map this output image back to the original input. At therefore has the potential to achieve successful results this point, a second GAN model which uses the same from a small dataset. procedure as the first GAN becomes necessary (Figure 5 - bottom part). This process ensures that there is a meaningful mapping between real ‘a’ and generated ‘b’.
Source: Own elaboration (2022)
Figure 5: Neural network architecture of the CycleGAN: GAN architecture of DA (top part) and the GAN architecture of DB (bottom part)
In brief, the model works by taking an input image from DA which is fed to the first generator, ‘Generator a2b’, which transforms a given image from DA to an image in the target domain DB. This newly generated image is then fed to another generator, ‘Generator b2a’, which generates another new output, Cyclic ‘a’. As previously discussed, this new output must be close to the original input image from DA to produce a meaningful mapping that is absent from the unpaired dataset.
As shown in Figure 5, each discriminator is fed by two inputs (one is the original image corresponding to that domain and the other is the generated image from the generator). The job of the discriminator is to distinguish between these inputs. In addition, the discriminator is able to override its adversary (in this case the generator) and reject the images generated by it. However, the generator would like to ensure that these images are accepted by the discriminator and will attempt to generate images that are very close to the original images in DB.
Following the conversion of the entire dataset to 256x256 pixel images for CycleGAN. The training of the ML model was executed on the GoogleColab platform, which is a cloud-based coding environment that supports ML libraries. In addition, the PyTorch library was also used. The dataset was kept in two separate folders and was uploaded and rescaled by the use of GoogleColab.
The main data source was comprised of the Istanbul Pervititch Maps (IPMs). Although all of the maps can be accessed online from the web portal of the Istanbul Metropolitan Municipality Atatürk Library Digital Archive and E-Sources (2021), these materials are unsuitable due to the addition of the library’s digital watermarks. As an alternative database, the Salt Archive has made 194 of the 243 IPMs available online (Salt Research, 2021). However, 20 of the IPMs taken from the Salt Archive are legends and index maps that only show the borders of the building blocks; these were excluded from the dataset. The IPMs provided by the Salt Archive were initially organized in 50 different folders and were then merged into one main folder. Although the scanned IPMs have differences in color tones and brightness, further corrective calibration was not applied. In addition, tags have been added to the IPMs in a variety of different ways (e.g. rectangular backgrounds, without backgrounds, capital or lowercase letters, and flipped in different directions). On most of the IPMs, there are large white labels that overlap buildings and prevent the overall shape of those buildings from being seen. These white labels were not removed.
The IPMs measure 2500-3500 pixels (long edge) and are in portrait format. In the data preparation process, 1024x1024 pixels squares were cropped from the original IPMs. These were selected to exclude areas with legends and to include buildings with varying functions. In addition to the preparation of the first dataset of 67-cropped images extracted from the IPMs, the second dataset was prepared and processed. In the second dataset, satellite views supplied by the Istanbul Metropolitan Municipality (SVs-IMM) were used. These satellite views were captured using WorldView-3, which is designed and manufactured by Maxar. The spatial resolution of the satellite imagery captured on 30th April 2021 is 30 centimeters with a look angle of 11,1. The first and second datasets were precisely superimposed using Adobe Photoshop software. The superimposition operation included rotating, resizing, and cropping (Figure 6). The superimposition operation was executed manually due to differentiation in the orientation and scales.
Following the procedures shown in Figure 5, the ML model was trained by use of the 256x256 IPMs and SVsIMM. The trained algorithm then provided outcomes both in conversion from IPMs to SVs-IMM and from SVstyle to IPM-style.
4. Results
Examples from the results are given in Figure 7. Column-a of Figure 7 represents the original IPM data (Real A), Column b represents the original satellite view (Real
B). Column-c of Figure 7 represents a reconstructed map (IPMs translated into SV-style images and then retranslated from SV-style images into IPMs). Similarly, column-d refers to the cyclic conversion of SV-style images into IPMs and the re-translation of IPMs into SV-style images. Column e refers to the result of ML regarding the generation of IPM-style from SV-style, while Column f refers to the SV-style images generated from the IPMs (Figure 7).
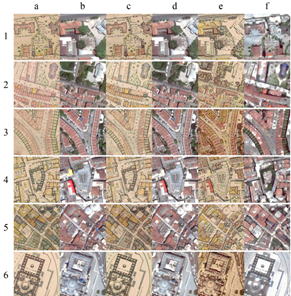
The results show that the transfer of embedded information such as the construction technique/material of buildings and tags from the IPMs (Figure 7 Column a) to SV-style images (Figure 7 Column-f) is possible. Moreover, the style transfer from SVs (Figure 7 Column b) to IPMs (Figure 7 Column e) can also be achieved. In particular, the church made of iron in Figure 7 Column f Line 2 is shown as blue. In this way, the construction technique/ material of the building differentiates from the buildings made with wooden-frame structures and those of brick, stone, and reinforced concrete. The tags belonging to the buildings in the dense street texture (Figure 7 Column a Line 5) are transferred into the corresponding SV-style images (Figure 7 Column f Line 5). In Figure 7 Column e of Line 5, shows that new additions that function as roofs can be transferred from a SV to the corresponding IPM. CycleGAN can also add colors to the satellite image and add a new layer to define the construction technique/ material of the buildings.
Figure 8a and Figure 8b were used as high-resolution (1536x1536 pixels) source maps that are larger than 256x256 pixels. A script written by the authors in Python to automate parsing an initial image into a 6x6 matrix and also merging the given 36 images as one final output. In other words, an image with a size of 1536x1536 pixels was taken and separated into a set of 36 images (256x256 pixels). After the proposed ML framework was tested, the outputs were merged automatically by the same script as shown in Figure 8c and Figure 8d.

5. Discussion
This study introduces a machine learning (ML) based framework that automates a style and information transfer from a historical map into a satellite image and vice versa. The proposed framework was tested using a selection of the Istanbul Pervititch Maps (IPMs) produced between 1922 and 1945 and satellite views from 2021 provided by the Istanbul Metropolitan Municipality (SVsIMM). Within the scope of the study, the scale differences (1:250, 1:375, 1:500, 1:600, 1:750, 1:1000) between the IPMs were overlooked. However, the dataset for the SVs followed the same scale and orientation with the paired images from the IPMs. The results of the study show that the proposed framework was able to transfer the following features: construction techniques/materials, green areas, and labels/tags, as well as the style transfer from an IPM into a SV-style image. In other words, the trained ML model is capable of generating an IPMlike historical map from any given satellite image and vice versa. As another feature, a SV-style image from any given square IPM frame (1024x1024 pixels) can be converted into the historical style of the IPMs. However, the proposed ML-based framework cannot not be applied to overall map data, unless the map is parsed into square pieces.
The goal of this study was to investigate the potential of an ML-based method (CycleGAN) on style and information transfers. The examination of the outputs of the implementation of the ML-based framework has contributed to the available information regarding errors and their causes. It can be observed that certain qualities of the dataset not limited to scale, color tones, and drawing style influence the likelihood of errors. Moreover, after encountering a problem of overfitting in the first pilot study utilizing Pix2Pix, the dataset was reorganized to use an unpaired format and CycleGAN. In such situations, the relationship between input and output becomes difficult to follow, and some of the prominent errors that can be considered as limitations of this study are listed as follows:
The data source (IPM) contains different elements of the given legends. For instance, while some of the IPMs include olive as a color, others do not.
The difference in the color tones among different IPMs caused by scanning or photographing produced inconsistencies in color recognition. For example, the same legend element represented by purple assumes a blue-like tone in several cases.
There are also scale differences in the IPMs, which becomes a compelling factor. The detail level of monuments is different from source to source (for example, on the 1:2000 map, the tag covers a large portion of the building and the material/technique is difficult to read. On the 1:500 map, however, it is more readable and its color makes the training of the ML model easier).
The differences in drawing styles across the IPMs can be also considered as a source of inconsistency. For example, there are representations in which monuments are drawn from top views with shadows, however other monuments are given without material information or shadows.
Similarly, inconsistency in the visual quality of the SVs has also been influential with regard to errors. In particular, shade or glare (e.g. the color of a domed structure turning white due to glare) led to the loss of precision in the processed data.
Moreover, there are errors in material-colorconstruction technique correlations. For example, wooden-frame structures (buildings) are represented in yellow in the IPMs. These buildings have terracotta roof tiles, and the ML-based model is trained according to this information. The ML-based model therefore applies yellow to buildings with tiled roofs (Figure 9d, building tagged with the block number 65) even if the structures themselves are made from masonry or reinforced concrete.
The model is trained to recognize the green legend for structures such as multi-domed khans (Figure 9a, 9b), which is the old Turkish or Byzantine arch technique, and also colors zinc-coated domed structures (Figure 9c) such as mosques with green (Figure 9d).
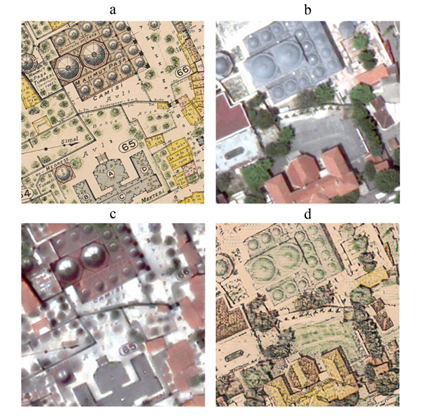
Source: Authors (2022)
Figure 9: Inputs and outputs: (a) Original IPM data; (b) Original SV-IMM data; (c) Generated satellite-like IPM; (d) Generated IPM-like satellite image
The aforementioned inconsistencies of the training material derived from both the IPMs and SVs, leading to major errors in the transfer of style and information. On the other hand, the study has the potential to provide useful data for semantic segmentation, which may lead to an automated comparison between historical and modern maps.

