


 Inglês (pdf)
 Artigo em XML
 Referências do artigo
 Enviar este artigo por email
 Citado por SciELO
  Similares em
SciELO
Similares em
SciELO 
 Permalink
I. Introduction
The breathing mechanism is a complex behavior driven by control systems that regulate ventilation. The aim is to respond optimally to the prevailing metabolic needs and to various demands on the respiratory apparatus. Actually, there is an automatic control system permanently aimed at maintaining the arterial pH, 02, andC02pressures (Pa0 2 ,PaC02) within the range of normal values. In addition, various systems can disrupt the automatic regulation in order to use the respiratory system in nonrespiratory tasks such as speech, singing, vomiting, and coughing, among others.
According to Milic-Emili 1 , the brief has three parts, each one is driven by different neural circuits: the inspiratory phase, the expiratory phase I, and the expiratory phase II. During the inspiratory phase, the burst neurons shoot to the inspiratory ramp neurons and after a time, the switch-off neurons finish the inspiratory phase and immediately starts the expiratory phase I, this phase is a inhibiting activity because it counteracts the initially strong elastic recoil of the chest and slows down the rate of exhalation in the first part of expiration. During expiratory phase II the inspiratory muscles are inactive allowing passive expiration. Expiratory muscles, such as abdominal muscles and internal intercostals, are recruited only in cases of increased ventilatory drive. The upper airway dilator muscles are generally activated significantly earlier than the pump muscle in order to allow the airways to be dilated before any negative intrathoracic pressure is created.
The briefing is a complex system with extremely high precision in its operating mode.
The measurement of respiratory dynamics includes parameters, such as respiratory rate (RR), respiratory tidal volume, depth of breath, inspiration and expiration time. The measurement of these parameters in both at clinical setting and in the daily life, could be used for early diagnosis, prognosis, and prevention of many diseases such as heart attack, stroke or depression, among others 2 , 3 .
In particular, the measurement of human respiration is a key factor in the diagnosis, monitoring and rehabilitation of respiratory disorders 4 - 7 . On the other hand, RR is also a vital signal and it can predict abnormalities in the homeostatic equilibrium 6 , 7 . Furthermore, Cretikoset al. 7 and Massaroniet al. 8 suggest that it is possible to predict physiological distress, anxiety, depression and panic attacks, obstructive and central sleep apnea, bronchitis, asthma, and other potentially serious adverse events.
Nowadays, the detection of RR at clinical setting is made through auscultation or observation, counting the number of breaths made in a minute (bpm). However, this method has low credibility and can be ignored by the clinicians, or simply overlooked and under-recorded 7 . To overcome this limitation, different studies have been carried out in the area, both at the level of contact-based methods and non-contact methods 8 . At clinical setting, spirometry or pneumotachograph methods are also used to measure parameters related to human breathing. The measurement is made with the help of a mouthpiece or face mask 9 . Although these methods have a good accuracy rate, they also have limitations, since they are not ergonomic and are intrusive, not allowing to a comfortable continuous monitoring. Since the last decade, the research community has been working in the development of novel technologies and methodologies to overcome the limitations of current procedures 9 - 24 . Wearable sensors such as accelerometers, gyroscopes and inertial measurement units (IMUs) arise like a potential alternative to measure the respiratory parameters; however it is still a challenge in a medical and technological point of view 8 .
The use of accelerometers for the measurement of respiration has been subject to a wide study, usually subject to validation. As far as RR is concerned, the use of accelerometers has been widely studied, both at the level of the upper thorax and/or abdomen 12 , 13 . Furthermore, some authors ( 8 , 12 , 13 , 17 , 25 ) have suggested that the use of tri- axial accelerometers allows the measurement of acceleration regardless of the orientation of the body, which removes the need to pay attention to the alignment of the sensors with the largest axis of rotation characteristic of singles-axis or dual-axis accelerometers.
Despite the evolution over time in terms of accelerometers, they still have some limitations, namely the fact that they only adapt to static situations. In this sense, it seems that there is a general consensus that inertial sensors could avoid the accelerometers limitation if data provided by the gyroscope are also included, thus allowing adaptation to dynamic situations.
For instance, Heba Aly and Moustafa Youssef 5 proposed a low-cost smartphone-based robust respiratory rate estimator called Zephyr. In this research, it was demonstrated that the values of the accelerometer and gyroscope sensors of a smartphone placed on the chest of the subjects are affected by the breathing mechanism. This breath rate estimator includes an algorithm that filters out noisy signals as imputed, but also performs a fusion of the sensors in order to increase the accuracy of the estimator. Following the same line of thought, Ja-Woong Yoonet al. 21 proposed a system to improve the measurement of respiratory rate of individual accelerometer or gyroscope through a fusion sensor with Kalman Filter.
In Elfaramawyet al. 19 a wearable patch sensor network to measure the breathing rate and the frequency of coughing is proposed. This system uses wearable wireless multimodal patch sensors, a low-power 9-axis IMUs and a MEMS microphone. In a more recent study, Elfaramawyet al. 20 used data processing and fusion algorithms to calculate the respiratory frequency and the coughing events in a more accurate way.
Ambra Cesareo et al. 9 , 22 presented a wearable contact- based device for respiratory rate assessment that uses 3 IMUs (two units are placed on the thorax and one on the abdomen). In order to compensate the high levels of noise of the accelerometers and the tendency to drift over time of the gyro, an implementation of a filter proposed by Madgwick was made 26 . This implementation allowed the representation of the respiration using quaternions, like the system proposed by Simon Beck et al. 23 ; however, this system only uses two IMUs: one located in the ventral area, while the other is located in the dorsal area over the chest.
James Skoric et al. 24 developed a system that uses an IMU which pairs a 3-axis acc and a 3-axis gyro for recording SCG (a method of recording cardiac vibrations with an accelerometer that can also be used to extract respiratory information).
On March 11, 2020, the World Health Organization (WHO) declared the novel severe acute respiratory syndrome coronavirus (SARS-CoV-2) infection a pandemic 27 . Severely affected COVID-19 cases experience high levels of proinflammatory cytokines and acute respiratory dysfunction and often require assisted ventilation.
Taking into account the pandemic situation, its symptoms and the previous scientific results related to measuring respiratory dynamics, we propose an alternative technique that is non-invasive, ergonomic, wearable, and wireless system based on four commercial inertial sensors to measureautomaticallythe respiratory dynamics.
The main objectives of our research are to define a reproducible procedure to measure respiratory parameters and to objectively evaluate the advantages and drawbacks of inertial sensors available in the market. In order to do that, we selected the most suitable wireless and ergonomic sensors considering the price/quality ratio. We measured respiratory dynamics in both, healthy and post-COVID-19 conditions. While the first is to replicate the current manual procedure followed at clinical practice, the second is to validate the reliability of the proposed concept with post-COVID-19 patients.
This article is organized as follows: Section II presents the materials and methods used in our research, where we described the concept, the technology used for the measurement (software and hardware) as well as the main data related with the groups of healthy volunteers and post-COVID-19 patients used to validate the main hypothesis. Section III describes hypothesis and shows the results, while the discussion is made in Section IV. Finally, the main conclusions of this research and the future steps are presented.
This research is authorized by the ethical committee of Universidad Politécnica de Madrid and all volunteers signed the informed consent.
II. Materials and Methods
In this section we describe our conceptual setup based on inertial sensors. The concept was validated with healthy volunteers and post-COVID-19 patients.
Due to the fact that the inertial sensors used are not certified as medical devices, before measuring patients, a group of healthy volunteers was selected (without diagnosis of brief pathology) in order to compare the measured values with the medical literature to ensure the reliability of the data. Moreover, we validated the number of sensors that should be used and the position in the abdominal area and rib cage.
The objective was to evaluate the numbers of sensors to be used, the reliability of IMUs to measure the respiratory dynamics, the quality of the bluetooth connection, the usability of the designed software interface, and the ergonomic characteristics of the measuring system, among others.
On the other hand, it is also necessary to ensure that the sensors are well coupled to the subjects, not causing discomfort and promoting measurements with reasonable accuracy. Through literature consultation, the coupling chosen were sensor-skin adhesives, due to its hypoallergenic and non-sensitising properties.
A. Software and Hardware architecture
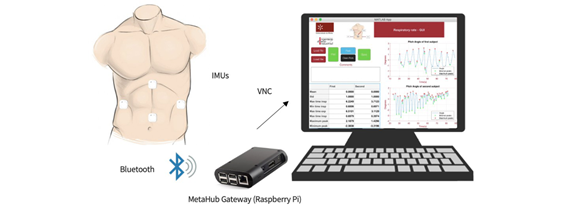
The system is composed of four sensors from MetaMotionC. Each one is a 9-axis IMU, that is a 3-axis accelerometer, a 3-axis gyroscope, and a 3-axis magnetometer.
This sensor was mainly selected due to its weight and size (approximately 25 mm in diameter); in order to non inhibit or influence on the normal breathing pattern of each subject, then the ergonomic aspect of the sensor was considered.
Regarding communication options, sensors are based on a Buetooth Low Energy (BLE) module and an ARM Cortex- M4F MCU. As previously mentioned, each sensor is able to communicate with a gateway devices. On the other hand, data from the sensor can also be saved in a flash memory. A SDK tool is provided to calibrate the sensor and to monitor the calibration status.
The location of the sensors has been determined by the body’s anatomy and the respiration dynamics. The four sensors are placed in the trunk. The first one is located in the sternum. The second one in the diaphragm, following a vertical line down the sternum, just above the belly button. The other two sensors are located on both sides of the trunk (intercostal muscles), following the midaxillary line. The height of these last sensors is found between the two previous ones located in the sternum and the diaphragm.
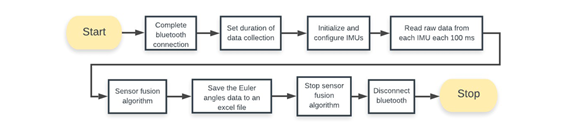
Figure 1shows the setup concept. The data acquired from the sensors were sent to the MetaHub Gateway (Raspberry Pi) via BLE communication protocol and from there to a conventional computer for further analysis. A scheme to this setup is presented inFigure 1.
At this stage, algorithms were developed in order to assess breathing patterns and the corresponding respiratory rate using the Raspberry Pi. The algorithms were developed using the Python Programming language.
The Euler angles (EA), Pitch, Roll and Yaw, were figured it out for each sensors and saved in an excel file. Because the output requires a fusion of the sensors (Accelerometer and Gyroscope), a Kalman filter was implemented. The update rate is 100 Hz. The flowchart inFig. 2summarized the processing signal algorithm.
III. Data filtering, visualization and feature extraction
IMUs are affected by different errors, such as offset and bias. In order to reduce these errors, before data acquisition, the sensors were calibrated using the SDK tool provided by Mbientlab. On the other hand, a Kalman filter was implemented to reduce these limitations.
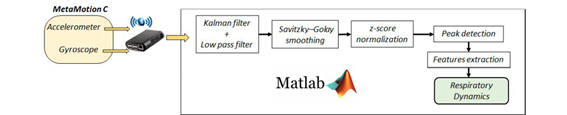
After the recording, all data was processed in Matlab.Figure 3shows the flowchart of the overall signal processing. We applied a linear detrend to all measured data to compute the respiration rate and used a Low-pass filter and a second order fitting Savitzky-Golay smoothing filter to reject both high frequency and noise peaks that can be generated by motion artifacts. The Savitzky-Golay filter also facilitates the identification of the Minimum and Maximum peaks. Data were normalized using z-score procedure.
Once the signal is filtered, an analysis of the respiratory signal is made over time in order to identify the peaks and valleys, which represents a whole respiratory cycle. With this, it is possible to retrieve the respiratory frequency of the signal, as well as features related to the breathing pattern.
Software Interface
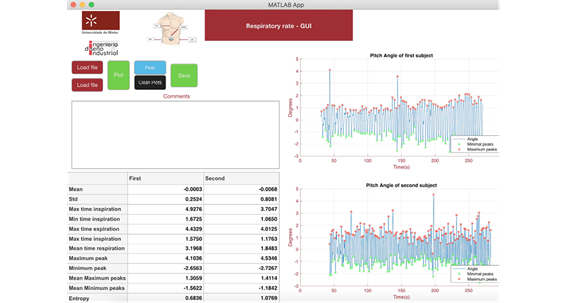
In order to monitor the respiratory dynamics, an interface was developed under Matlab environment. A scheme of the interface is showed in Figure 4. As it can be observed, the application has different interactive options, such as buttons, graphics, text area and table with different purposes. All these functionalities are described bellow.
The data obtained are shown in two intuitive ways: graph- ically and numerically, making easy to compare or monitor the respiratory rate in real time. Moreover the visualization area can be cleaned after that and the data can be saved. A box dialog was included for writing medical opinion/analysis related with the data. This information might be included in the medical history of the patient.
As a first step, the user must click on both buttons (Load File) related to the importation of excel files. In order to complete this step, the user must select the excel files to be compared. Once selected, the files will be imported and are ready to undergo the next steps of the process.
After importing the files, there is a button (Plot) with the functionality of filtering (Low pass filter and Savitzky-Golay filter), normalising the data through z-score and then placing it on the two graphs; filters were tunned experimentally.
Although a comparison is already possible by viewing the graphs, this comparison is made easier when another button is pressed. There is another button (Peak) that allows the maximum and minimum peaks to be displayed, as well as extracting the relevant features and displaying them in a table. If the user wishes to compare two new graphs, it is only necessary to use the button (Clean Plots) for cleaning the graphs and proceed with the whole process with the new data.
The functionality to create comments for professionals is ensured through the creation of a text area, where the professional can save comments about the graphs, subjects or about the difference between the two graphs.
In order to save the data related to the features, as well as the comments made by the professionals, the ”Save” button was created, which as soon as it detects a click saves the features data and the comments in an excel file and in a text file, respectively.
Healthy volunteers and Patients
The participants were divided in three groups according to the experimental necessities of our project. The group 1 (G1), healthy volunteers, participated in the validation of the reliability of concept, while group 2 and 3 (G2 and G3, respectively) participated in the respiratory data dynamics validation. In the following paragraphs, we present the most relevant demographics and clinical data for each group. All participants were included after written informed consent.
For G1 group, 20 volunteers (15 men and 5 women) without respiratory disease history or COVID-19 diagnosis were recruited from university staff and family. The population were (mean ± standard deviation): age 25.650 ± 12.097 years, weight 66.400 ± 12.435 kg, with a height of 168.100 ± 9.402 cm. In this group, 65% of the subjects were students, 40% practice sports at least once a week, 30% were smokers and only 20% had some kind of respiratory problem (rhinitis, sinusitis, and bronchiolitis as a child).
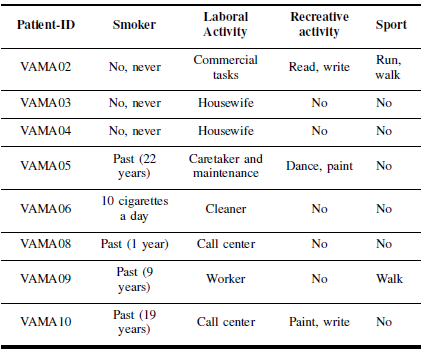
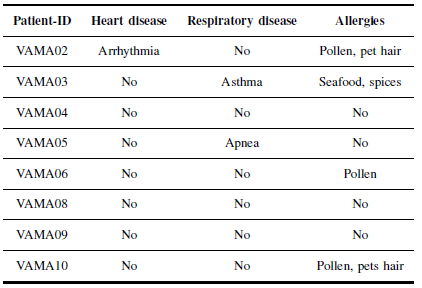
In G2 group, 10 post-COVID-19 patients were selected from the PatientAffected byCOVID-19Disease Association(AMACOVID), Madrid. Two subjects were excluded after the data analysis due to noise and communication issue, therefore data from 8participants (3 men and 5 women) were finally included in the analysis. The post-COVID-19 population were (mean ± standard deviation): age 49.556 ± 9.1422 years, weight 74.333 ± 19.293 kg, with a height of 164.0 ± 7.272 cm. Tables I and II summarize the most relevant demography and clinical data including a list with the daily activities.
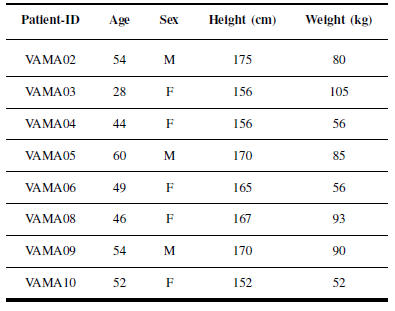
Table III shows the most relevant data related to the clinical history of each patient.
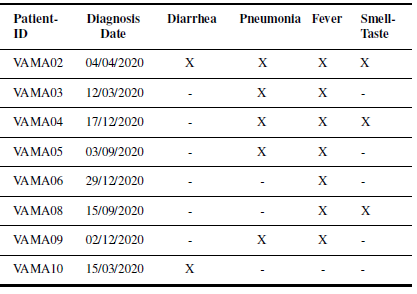
Table IV summarizes the symptoms suffered by the patient including the diagnosis date. The PCR-test (real-time reverse transcriptase-polymerase chain reaction) was used to diagnose the disease. Fever and pneumonia were the most common clinical symptoms. Other symptoms reported by patients were: hair and skin problems, headache, vomits, and cough, among others.
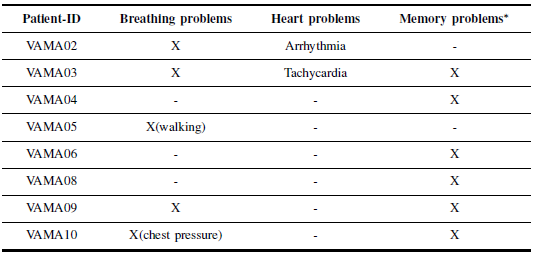
Table V summarizes the symptoms suffered by patients after COVID-19 disease, however, some of these symptoms are still present today. Other symptoms reported are: speech problems and lost of force in the muscles of the extremities.
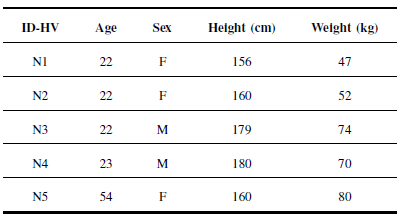
Finally, G3 group consisted of 5 (2 men and 3 women) healthy volunteers (HV), without diabetes, heart, lung and brain diseases. Demographic data were (mean ± standard deviation): age 28.600 ± 12.706 years, weight 64.600 ± 12.831 kg, with a height of 167.0 ± 10.351 cm. Table VI summarizes the most relevant demography and clinical data while Table VII shows the daily life activities.
All participants were sitting with their backs straight and motionless for the study. Two different tests were carried out. The first recording lasted exactly 1 minute, while the second test lasted 4 minutes. In the first test, participants were told to perform deep breaths at a regular pace, while in the second test, the measurements were recorded in a resting state. The participants were informed to breath normally and not to talk during the measurement. No other instructions were given to the subjects to regulate the rate or depth of their breaths. In the second experiment, participants were asked to sit down and stay quite 15 minutes before the measurement 1 .
Results
During the measurement, all volunteers were sitting down with the backs against the backrest. In the presentation of the results, the roll angle was used since it presents the most reliable values.
Experiment 1: Concept Validation
This experiment was performed at ETSIDI-UPM Mechatron- ics Lab with volunteers from G1 group. Some hypothesis to validated:
Number and position of inertial sensors (see Section 2).
Reliability of Bluetooth communication considering the number of sensors.
Reliability of each sensor to measure respiratory dynamics.
Autonomy and data storage capabilities.
Software testing.
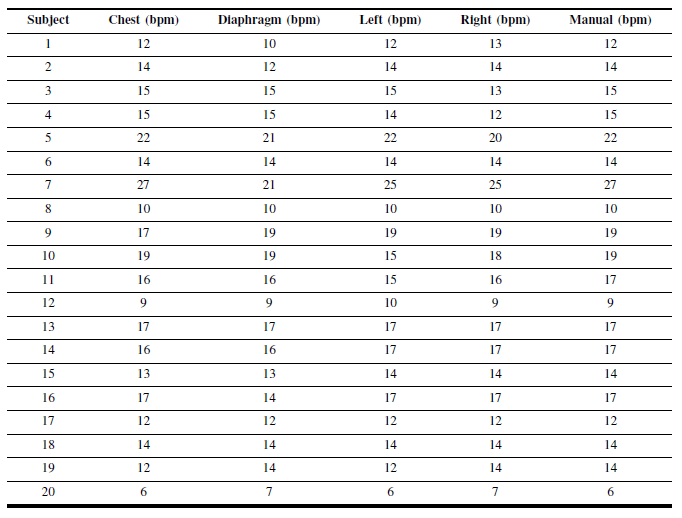
After each sensor was placed in the target position, the volunteer was encouraged to deeply inhale and exhale during one minute. At the same time, the respiratory rate was manually counted by the number of the chest rise. In order to proceed with the comparison, the respiratory rate of each IMU was computed (Fig. 3). Respiratory rate (manual and automatic) are summarized in Table VIII.
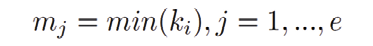
We definedk i, withi= 1, ..., mthe set of the roll angles of an inertial sensor during a measurement procedure.
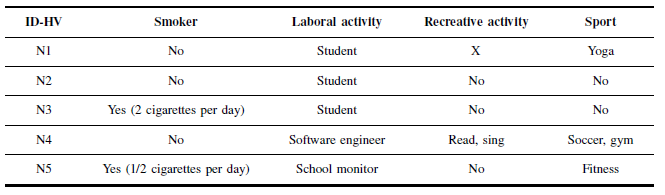
Table VIII. Respiratory rate measurement in Group 1. Comparison between manual and automatic procedure
M j andm j represent the sets of maximum and minimum values ofki, respectively:
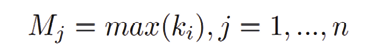 (1)
(1)
We computed the absolute error for each sensor by (3):
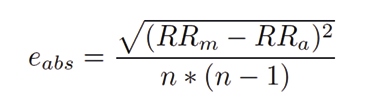
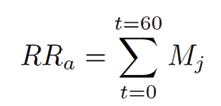
Where RRmis the manual count as it is done at clinical setting, then it is considered the true value.RR a is computed by the number of maximum peaks during 1 minute (SeeFig. 3);
The absolute errors are:e chest = 0.0289 for the chest sensor,e diap = 0.1368 for diaphragm sensor,e left = 0.0316 for the left sensor ande right = 0.0342 for the right sensor. Taking into consideration the range of respiratory rate for healthy volunteers, 12-20 breaths per minute, any sensor can be used to measure respiratory rate accuracy 6 , 28 .
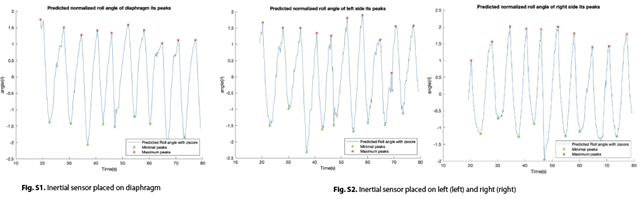
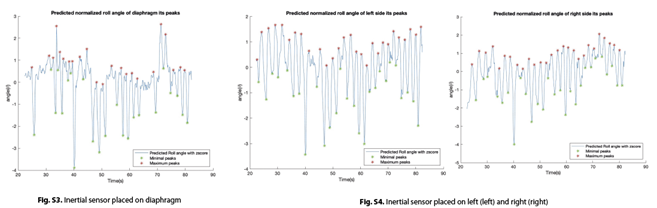
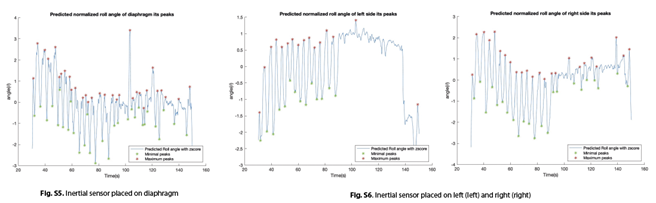
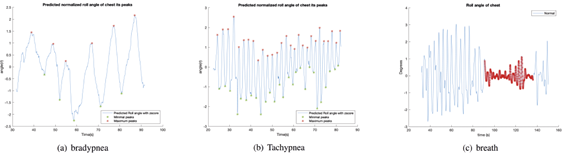
Moreover, some volunteers were encouraged to simulate the most common pattern of breathingTachypnea,whereRR >20 breaths per minute,Bradypnea,whereRR <12 breaths per minute and finally to hold-breath, where the inhaled air is kept off some seconds 18 . Values measured by chest sensor are presented in theFig. 5. The reader is advised to consult the supplementary material to view the data measured by the other inertial sensors, which are noticeably affected by measurement noise.
E. Experiment 2: Post-COVID-19 patients measurement
Experiment 2 consists in measuring the respiratory dynamics during 4 minutes to G2 and G3 groups. G2 was measured at the COVID-19 patients association. Some extra hypothesis to validated in this experiment are:
Difference in the measurements given by each sensor.
Difference in respiratory rate values between the groups.
Difference in the breathing patterns of the groups.
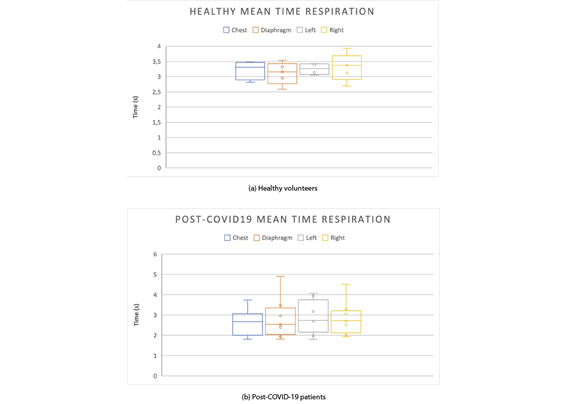
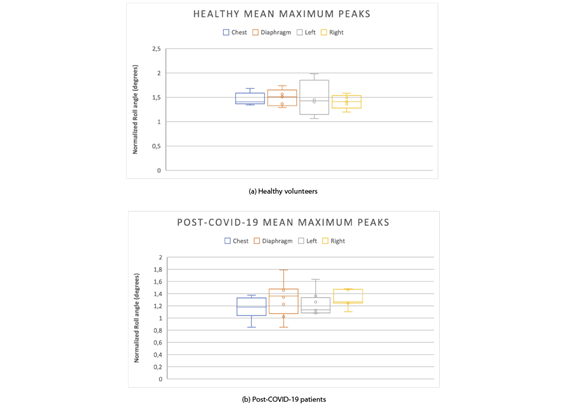
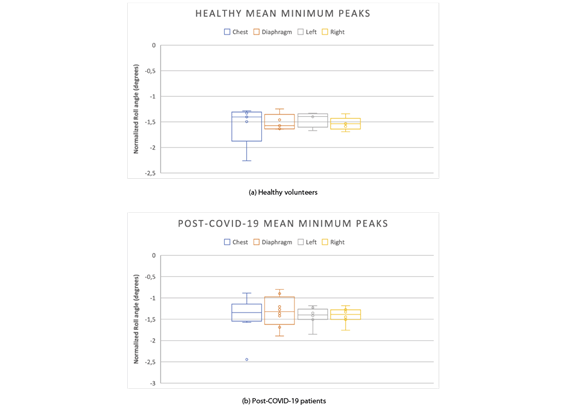
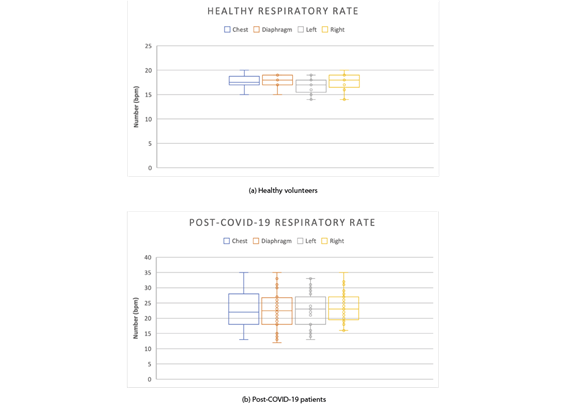
The features that best describe the respiratory dynamics are compared between groups: mean time of respiration, , sec , the mean of maximum peaks, º , the mean of minimum peaks, º and the respiratory frequency, bpm , that is the number of breaths per each minute.
By considering (1) and (2), the time of respiration is defined as the elapsed time between two consecutive maximums (minimum), that is:

Where andrepresents the time correlated to two consecutive maximum or minimum peaks.
Then, themean time of respirationis defined as the mean of all the time elapsed between two consecutive maximums (minimum), that is:

Finally, the mean of maximum and minimum peaks are defined with the following equations.

Figures 6to 9 show the measured features in both groups. As it can be observed from these Figures, the proposed system is able to capture differences in the respiratory dynamics between groups. The four sensors measured alterations in the breath behaviors, that is, the data recorded at each sensor shows significant differences between them.
In order to compute thep - values, we just considered those post-COVID-19 patients who had alteration in RR. After choosing the data to be used, we applied an ANOVA test to compute the level of significance for each feature and sensor. Related to RR feature, the inertial sensor could be placed in any part of the abdomen and thorax (pvalue <0.001) as it was demonstrated in experiment 1. To measure the minimum time of respiration, right sensor is the most confidentpvalue <0.006, while chest sensor, left and diaphragm sensors havepvalue <0.01. It is recommended to measure the minimum peaks using the right sensor, since it shows thepvalue <0.05, while no significant values were found for the other sensors. For measuring the maximum peaks, right sensor, again, seems to be best one with apvalue <0.05 and non significant values were found for chest, diaphragm and left sensor.
IV. Discussion
A. Reliability of inertial sensors to measure respiratory dynamics
According to the experimental results, the potential of using multiple, wearable and ergonomic inertial sensors with blue- tooth communication is suitable to measuring the respiratory dynamics. However, some drawbacks were found and we discuss about them below.
The position of each sensor needs to be deeply studied and correlated with abdominal and thorax muscles synergies. Although the sample size is a limitation in our study, the experimental results evidence that some sensors are more reliable than other to measure particular features of the respiratory dynamics beyond the RR. However, for measuring the RR, the inertial sensor could be placed in any abdominal or thorax area. Moreover, we did not find any correlation between the features measured by each sensor with the weight, height or body mass index in healthy volunteers.
The first experiment allowed to verify whether the sensors had enough sensitivity to measure the respiratory rate as well as to measure the most typical abnormalities in the respiratory pattern such us bradypnea and tachypnea. Moreover, a phase of hold-respiration was also measured and, under this situation, we determined the lower limit of the sensor’s confidence interval for inhalation and exhalation stages of the breath. InFig. 5we presented data recorded by the chest sensor. In the supplementary material, the reader can observe that the other 3 sensors also reproduce the pattern, however, in some cases with more noise. The placement of these sensors may be related to the anatomy and fat distribution in the abdominal zone.
Although working correctly, the bluetooth communication is prone to failure with the time and battery consuming. However, there are still some areas that should be studied and improved before starting to use this method to measure the respiratory dynamics. Indeed, this study is limited to a controlled environment and low number of tests where subjects were constrained to a motionless sitting position. In a real- world scenario, additional filtering and processing would be required to remove motion artifact and noises from the signal.
Despite of being one of its main advantages, the bluetooth connection also introduces some difficulties when measuring. The first one is the time required for having the four sensors connected. This process is made manually (one by one), so the total time necessary for this activity increases to almost one minute. Additionally, when the last sensor becomes ready to start the measuring process, the first one has been bound for some seconds with the risk of not having the four sensors starting the measurement at the same exact moment. Furthermore, the BLE signal is weak with the clothes occlusion, which is a great limitation to measure respiratory dynamic in daily life, as well as the low autonomy of the system that is limited to 4-5 hours maximum.
Another limitation of measuring the respiratory dynamics with inertial sensors is the fact that the anatomy of men and women is different, specially referring to the fat distribution. Women have more body fat than men, which provokes that the movement done by the trunk while breathing varies between both sexes, specially in the chest area, where the distribution and the quantity of fat is different and superior in female.
This idea of fat distribution affecting the measurements is also relevant for people suffering obesity. When measuring these patients, the signal obtained is not as precise as with the rest of subjects due to the influence of the fat when performing the breathing movement.
For the experiments performed, the sensors were fixed using surgical tape, but in some cases the sensors did not stay still and were not completely fixed to the skin so the data obtained needed to be filtered to remove non real movements. To prevent this unwanted activity some artifacts like elastic bands, belts or suits should be developed to stick the sensor directly to the skin and collected data from the real movement.
B. Reliability of inertial sensors to measure alterations in respiratory dynamics under disease condition
Rapid breathing can be the result of anything from anxiety or asthma, to a lung infection or heart failure. Therefore to validate our proposal to measuring respiratory dynamics, patients diagnosed with post-COVID-19 condition were measured. As it is well know, one of the main clinical picture is pneumonia. However, in this proof of concept, we included three patients who did not suffered pneumonia during the disease (see Table IV) and one of them with subjective breathing problem in post-COVID-19 stage (see Table V).
The respiratory dynamics were measured during four minutes and results were compared with the control group, G3. By analyzing the results given in Figs. 6 to 9, patients who suffered pneumonia during the disease still had breathing problems and the respiratory rate was in the range of tachypnea, similarly to the patient who reported breathing problem in the post-COVID- 19 stage. Furthermore, these high respiratory rate values were usually indicative that the ability of the subject to get oxygen into the blood and get carbon dioxide out becomes less efficient, causing the number of breaths per minute to increase.
On the other hand, by analyzing the peaks of the breathing graphs, it was found that post-COVID-19 subjects did not take such deep breaths when compared to healthy subjects, since the amplitudes of their peaks were lower, on average.
The differences in the respiratory dynamics in patients and control group was captured by the system. By comparing each sensor in both groups, we found significant differences that were related with the long-term consequences of the COVID-19 condition, even when the patient did not suffer from pneumonia. In this case, the alteration of the breath was not necessarily related with lung problems.
While the results presented are promising, better charac- terization and understanding of the reliability of the system is still needed before it can be used at a clinical level. This validation would be quite relevant, since it would facilitate the monitoring of normal and high-risk patients in a non-invasive way (post-COVID-19 condition, asthma, or chronic obstructive pulmonary disease, among others).
V. Conclusions
In this article, we have presented a novel concept to measure the respiratory dynamics using four wireless inertial sensors. We validated it by two different experiments, the first one aimed to automatize the current manual procedure at clinical setting. The main conclusion was that a single sensor can be used to measure the RR and, most important, it could be placed in any area of the abdominal or thorax part. Moreover, abnormal patterns of the respiration can be captured in a single measurement. In this case, the chest sensor shows more reliable results compared to the other sensors. One of the reasons may be the factor that the chest sensor was placed in a more stable zone minimizing the noise of the measuring.
In the second experiment, the main objective was to demonstrate that inertial sensors have enough sensitivity to capture alterations in respiratory dynamics. Post-COVID-19 patients were tested. The results demonstrated that there are alterations in the respiratory pattern in all sensors compared with the healthy volunteers.
The most relevant parameters of respiratory dynamics are computed automatically by a software developed in this research and they are conveniently presented to the medical staff using a human-machine interface designed and implemented under MatLab environment.
The main limitation of this study was the size of the groups included in the experiments. However, taking in consideration that it is a proof a concept, the results are promising and suggest that further studies are necessary for the full validation of the system.
In futures studies, issues related with autonomy of the sensors, wireless communication, relation between muscle synergies and data recorded should be studied deeply in order to get a better understanding of the respiratory dynamics. Also, an extended validation of the proposed system is needed also in dynamic conditions, during daily activities, considering both healthy subjects and patients with respiratory diseases.
In all experiments, we followed a strict protocol for cleaning common areas and materials between each use, in order to keep researchers and participants safe.