


 Español (pdf)
 Articulo en XML
 Referencias del artículo
 Enviar articulo por email
 Citado por SciELO
  Similares en
SciELO
Similares en
SciELO 
 Permalink
1. Introduction
Accessibility consists on which products, systems, services, environments and facilities can be used by people with the widest range of capabilities (International Organization for Standardization, 2014). Although global institutions are more and more aware of the need of accessibility on infrastructures, nowadays people with disabilities still suffer some difficulties. An example of this awareness could be the “Córdoba accessible” initiative (Instituto Municipal de Desarrollo Económico y Empleo de Córdoba, 2013), that aims to gather information about accessibility in the city of Córdoba, Spain. Another example could be the deployment of an accessibility system for physical maps in Getxo and Madrid (PUNTODIS, 2017). In addition, the Telefónica Foundation promotes an application that allows users to gather information about accessibility issues in their surroundings, so that others can access that information and be aware of them (Fundación Telefónica, 2018).
People with disabilities use several tools in order to perform daily tasks., like -among others- guide dogs or canes. They also use their other senses to understand their environment. In this respect, tactile pavements are very relevant. Depending on the shape of the relief, they have a different meaning for a blind person. Paths are represented by lines, while circles are used to alert (Donoso, 2018). However, the use of these pavements must be well planned, since a bad design could induce blind people to misunderstandings. In addition, the setup of these pavements are generally more expensive than other solutions, like using digital maps. Some aid devices work also as protection. For example, the color of the canes is often used to identify the disability a person has. In the USA, a totally white cane belongs to a totally blind person, while a white cane with red stripes is usually used by people who still possess some sight (Lewis, 2018). This can make drivers aware of the specific disability someone has and allow them to act accordingly.
It is true that huge steps towards accessibility have been taken in the “physical” world, that is, infrastructures, buildings, roads, public transportation and organizations that work to provide jobs and some economic independence to users with disabilities, among others. However, this progress has not taken place, by any means, in the digital world (Ellis & Kent, 2017). If we focus on new technologies, people with disabilities also find difficulties in its use. This is due to the fact that these technologies are still not adapted to this kind of users, as buildings or roads were not adapted some time ago. Since computers, smartphones and other technologies are becoming more and more popular -and, of course, more and more useful-, it is necessary to advance on the field of web accessibility.
We can say that a website is accessible if its effectiveness, usefulness, usability and efficiency is the same for both disabled and non-disabled users (Brajnik, 2009). When developing an accessible website, we should take into account that several disabilities exist (World Health Organization, 2001), and each one affects the user experience differently:
Visual: partial or totally blind people have problems to perceive colors or see the elements which surround them.
Hearing: people with this kind of disability have trouble perceiving sounds.
Physical: people with physical disabilities suffer a decrease in their motor abilities.
Intellectual: people with intellectual disabilities have problems with processes such as text reading and with the understanding of concepts and the space that surrounds them.
As we said before, people with disabilities use tools, like canes, to perform daily tasks. They also count with some tools to help them use new technologies. Multiple assistive technologies (AT) exist in order to make the use of new technologies easier for them, e.g. voice recognition programs, screen enlargement applications or screen readers. The latter are extremely important for users with visual disability and require a specific page structure and element attributes to function properly. Right now, the implementation of the most used screen readers does not only differ between them but, worse, it fails to support the Accessible Rich Internet Applications (ARIA) specification completely (PowerMapper, 2018).
The ARIA specification (World Wide Web Consortium, 2017) provides ways of improving the accessibility of a website. In particular, two main features are available: roles and attributes. The first ones define or redefine element semantics, as long as the change does not creates a strong conflict with the native semantics. The second ones are a powerful way of providing enough information about an element so that a screen reader can enunciate it properly. For instance, titles, descriptions, or whether the element should be visible to screen readers, can be indicated through an attribute.
Other AT are the refreshable braille displays, which represent braille characters as necessary by using electromagnetic mechanisms. Blind people surf the web with these.
For users with physical disability, devices called “headpointers” exist. They allow them to point the screen only using their heads, so although they are designed for people with motor problems, they must preserve a good control of their heads to use them (Luján-Mora, 2009).
In order to develop accessible websites, some guidelines should be followed. Specifically, the World Wide Web Consortium (W3C) develops a series of Web Content Accessibility Guidelines (WCAG), aiming to provide an international shared standard. They define three levels of accessibility (A, AA, AAA) being the latter one the best of them. A website is granted a level depending on the guidelines they comply with and their priority. For example, complying with guidelines of priority one, two and three grants a website a triple-A level.
This paper will not try to cover web accessibility as a whole, since it is a wide topic. We will focus on geographical web maps -also called geographical online maps-, that is, maps available online -as a web page- which present or describe the geography of a certain zone. A geographical map can represent both outdoor and indoor geography. In our case, our proposed solution gathers geographical information about the Campus of the University of Alicante, so it is an outdoor map. Our system is designed to work with outdoor maps, but it could be used with indoor ones, applying the corresponding adaptations.
This project intends to build a system which provides accessibility features to geographical web maps, in order to try to solve a problem that users with disabilities face: they cannot take advantage of the benefits that web maps could provide (independence and self-sufficiency) because of accessibility problems. The result is a web application with a responsive layout that can run on computers but also on smartphones, taking advantage of the sensors of the latter (e.g. GPS, compass, gyroscope, and so on). The result classifies as a Digital Interactive Map (Ducasse, Brock, & Jouffrais, 2017) because it is displayed on a screen and the user can interact indirectly with it, using a keyboard, a mouse, etc.
If we want to apply accessibility guidelines to online maps, it is practically mandatory to use a Scalar Vector Graphis (SVG) render. The current version is 1.1 (World Wide Web Consortium, 2011), although version 2.0 is on development. This is because it represents shapes as Extensible Markup Language (XML) elements, so ARIA attributes can be added. Other graphic technologies, as tiles or canvas, cannot provide information about each drawn element, hence they are not suitable for accessibility. The interest in SVG for accessibility purposes is not something new (Zeng & Weber, 2003), but it has now become achievable because back then web browsers did not support SVG completely.
The remainder of this paper is organized as follows. In the next section, some of the previous research about accessible online maps is discussed. Then, the following section sheds light on some related concepts. The technologies, architecture, design and final implementation of the solution are described in the fourth section, as well as the accessibility evaluation of the project. Finally, the fifth section discusses the result, its advantages, its limitations and its possible improvements.
2. Previous Research
The fact that there is not a homogeneous implementation of AT has caused multiple studies to be conducted. One of the researches performs several tests on MacOS X and Windows 7 using Jaws, NVDA and VoiceOver, the most popular screen readers (Ferraz, 2017). The results are very heterogeneous, proving the lack of consistency between implementations. The research concludes by stating that the “aria-label” together with the “text” element are read by most of the browsers. It makes also interesting comments on Search Engine Optimization (SEO), pointing that “desc” elements in SVG are indexed successfully by Duck Duck Go, Bing, Yahoo and Google. This means that it would be beneficial to use both ARIA attributes and “desc” elements in order to have AT compatibility while optimizing for search engines.
Another research was conducted about flowcharts on SVG (Watson, 2018). These are not online maps, but since they are also graphical elements, the results could be applied to web maps. The study intends to provide flowcharts with semantics and navigability. To that end, it uses a combination of the “img” role and the “aria-hidden” attribute to hide non-relevant items. It also makes use of the “list” and “listitem” groups to keep meaningful relationships between the elements of the flowchart.
Another research (Calle-Jiménez, Eguez-Sarzosa, & Luján-Mora, 2018) proposes an architecture for accessible web maps. This architecture consists of three elements. The first one is the database, which stores geographical and map data. The second one is the web server, which makes the map data accessible. Finally, the user side component shows the map to the user. This setup was enough to implement successfully an accessible web map, tested with real users. The test concluded that the application was easy to use and proved that accessibility is achievable. Users commented on the confusion that the way the screen reader pronounces words can cause. This research also emphasizes the importance of metadata. This kind of information is essential for making maps accessible, since it is what AT needs in order to inform the user of what happens on the website.
These studies assume that the developers of the online map are producing their own render with their own data. However, a common way of displaying a map on a website is making use of an API, e.g. Google Maps API, and obtaining data -if needed- from a third party. A research shows that the embedded maps from Google Maps are not accessible, since they do not provide keyboard navigation and the markers do not change its presentation when focused (Logan, 2018). This has been an issue for a long time, but Google has no will to solve it, apparently (Accessibility of Google Maps API, 2017).
3. Related Concepts
Some concepts related to this research will be defined in this section. Concepts that have already appeared on the paper will be defined too, for the sake of clarity.
As it has been stated above, accessibility consists on which products, systems, services, environments and facilities can be used by people with the widest range of capabilities (International Organization for Standardization, 2014). Applied to websites, it means that its effectiveness, usefulness, usability and efficiency should be the same for both disabled and non-disabled users (Brajnik, 2009). This means that the goal of web accessibility is to allow users with disabilities to use a site not in the same way as users without disabilities, but with the same results and functionalities, preserving usability.
WCAG are a series of guidelines which intent to provide a standard reference of what developers and designers should do in order to achieve accessibility on their websites. The latest version is WCAG 2.1 provides four principles (World Wide Web Consortium, 2018): perceivable -information and interface should be presented in a way users can perceive-, operable -interface components and navigation should be operable-, understandable -operation and information should be understandable- and, finally, robust -content must be able to be interpreted by a wide variety of user agents, including AT. For each one of these principles, guidelines are presented in order to provide a way of achieving those principles on any website. Each guideline explains, shortly, a feature that contributes to accessibility. Then, several criteria are provided, with different levels -A, AA and AAA, in decreasing order of importance-. These criteria are later used to check conformance. To be compliant with a level, the previous ones should be met too. This means, for example, that for level AA conformance criteria with level A and AA must be achieved.
SVG (World Wide Web Consortium, 2011) is a format based on XML that represents vector graphics. It provides two very interesting features. First of all, since the graphics are vectors, they can be scaled without quality loss. Secondly, since it is based on XML, it uses tags to represent graphics. This allows us to add metadata to each element, and this will be key for accessibility. As already explained, the ARIA specification provides ways of improving the accessibility of a website by using attributes and roles. These may also be used in SVG elements, so we can build accessible graphics with the combination of this technologies.
Another interesting concept is the “perceived affordance”. This concept is related with “the actions a user perceives as being possible based on how an object is presented” (Connor, 2010). For an SVG image to allow keyboard navigation, elements to be navigated must be wrapped in links. That is the only way, nowadays, of making an SVG keyboard accessible (Migliorisi, 2016). However, those links are not really working as links, so the perceived affordance of those elements is affected. A solution to this situation is the modification of the semantics of the link using the “role” attribute (Migliorisi, 2016). Perceived affordance is a very important property when developing an accessible application, because whatever the tricks we use for achieving accessibility, the appearance and the semantics must remain related. The functionality of an element, even if modified for accessibility, should be identical to the impression a user has of the possible actions when they see it.
It is important to note that, for the elements inside the SVG graphic to be focused, its root must contain a “tabindex” attribute set to zero. This attribute makes an element focusable or not, depending on its value. Only zero (programmatically and keyboard focusable) or minus one (only programmatically focusable) should be used. Other values of this attribute are discouraged because they alter the navigation order of the elements (Watson, 2014; WebAIM, 2016). This attribute is fundamental for accessibility, since it allows the developers to make any element focusable, so the user can access all the information by tabbing through the page.
4. Development of the proposed solution
As mentioned before, we propose a system which provides enough information to bring accessibility to a web application. The application is designed in a responsive way, so it can be used on both computers and smartphones. It could also be published as a native phone application using technologies as Apache Cordova, PhoneGap or Ionic. The map of the proposed solution covers the University of Alicante, but it could be also used to present indoor spaces, making the corresponding adjustments.
To try to solve the accessibility problems a web map usually has, we have developed a web application which consists on both back-end and front-end components. This web application offers two modes: an exploration one, which allows users to get an overview of the zone, and a navigation one, which calculates routes between two points using the Dijkstra algorithm (Cormen, Leiserson, Rivest, & Stein, 2001) and shows them on the map. On both modes, an accessible version of a web map is presented, along with some features to make it easier to use for users with disabilities. For example, voice control lets users control the map with voice commands. These commands, such as “move map to the right” or “go from Building A to Building B”, can be used to perform operations on the application, like panning the map or simulating routes between two buildings. They can also be used to search for buildings, select search results or zoom in or out the map, for instance.
Our proposed solution can indicate, at any time, where the user is located and headed to. This helps users with visual disability to be more aware of their surroundings. We do so by using always the same syntactic structures in short sentences, so the information is clearer and easier to understand. In addition, when navigating, users are provided with information about their surroundings (if available) in each step of the route. This also helps them orientate and know if they are following the route correctly.
This is a sum-up of the basic features of the application. In the next sections, the application will be described in depth.
4.1. Architecture and design
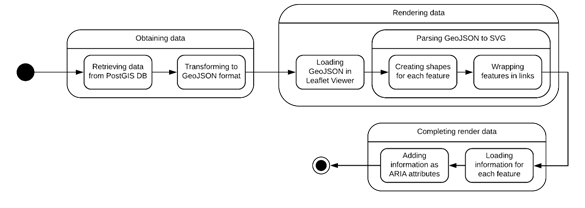
Geographical data is stored in a PostgreSQL database, using the PostGIS plug-in. This plug-in allows us to perform fast and advanced spatial queries against the database. The geographical information is organized in layers, each one corresponding to a category, which are the following. The way they relate to each other can be graphically seen in Figure 1.
Buildings: data representing buildings belongs to this layer.
Obstacles: possible difficult zones to pass through are stored in this layer (e.g. gardens or fountains).
Assistance: zones which have help for people with disabilities (e.g. tactile pavement).
Interest: places and points to remark on the generated routes.
Path: a compound of paths which can be walked through.
Entrances: places where a building can be accessed to. They are also considered as a way out.

With these six layers, we can build a system which provides useful information to users with disabilities. This is achieved by implementing a web application which users can interact with. For this purpose, we use both NodeJS and Apache servers.
The first one handles the back-end part, and it is in charge of interacting with the database, in order to access its data and provide it to the other server. For security sake, communications with the Apache server are performed using HTTPS and the NodeJS server is only reachable from the front-end server. The results obtained by querying the database are returned in GeoJSON format. This format is defined in an Internet Engineering Task Force (IETF) standard and is used to represent and encode geographical data using JavaScript Object Notation (JSON) (Internet Engineering Task Force, 2016). NodeJS has been chosen as the back-end server because it offers an easy yet reliable way of providing HTTP request handlers, together with a wide community and libraries. Other technologies could have been considered -e.g. PHP or ASP- but NodeJS is lighter and, then, has a better performance under modest servers.
The second server handles the front-end part and has the responsibility of accepting all requests and responding to them, as well as storing and serving static files (i.e. scripts, stylesheets, icons, HTML files and so on). This is the most important part of the proposed solution: for the stored information to be useful it must be presented in an accessible way.
4.2. User interface
As it can be noted in Figure 2, the application has two main areas. A sidebar on the left contains control buttons for panning and zooming. Then, three buttons are displayed: voice controls, location and orientation. The first one switches voice recognition, the second one pans the map to the user’s location and the third one states the user’s orientation (which building the user is looking at).
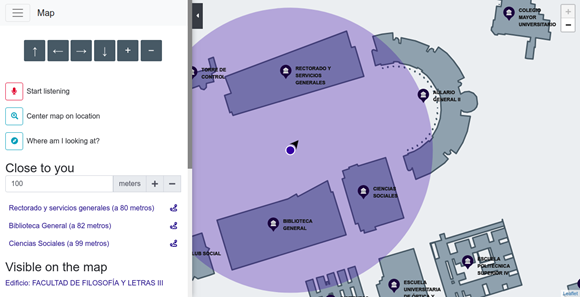
On the map, buildings have markers which state their name. They are grouped on some zoom levels, with the intention of avoiding the clutter. The number of markers grouped in each one is displayed, and their colors change depending on this number. When the user navigates with the keyboard, they do so through the marker groups instead of the buildings. If the map is zoomed to a closer level, the markers appear, and the user then navigates through the buildings themselves.
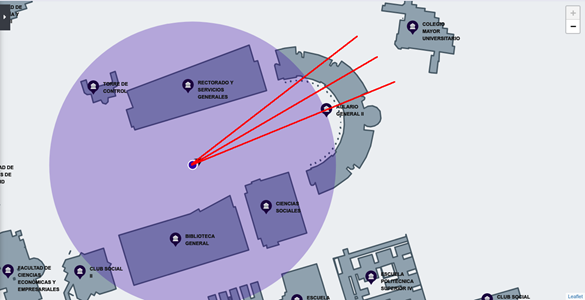
Figure. 3 An illustration of the orientation approximation technique. The three lines have a 10º difference and would vote for the same building in this example
User’s orientation is displayed as a triangle -the furthest vertex of which indicates where the user is headed to-, and calculated drawing three imaginary lines on the map, as can be seen in Figure 3. One line points straight towards where the user is looking; the other ones point each one to the same spot but with a ±10º difference, so an angle of 20º altogether is used to calculate orientation -to compensate the inaccuracy of phone compass-. When a line intersects a building, a vote for that building is issued. The votes of the three lines are then analyzed and the building with the most votes is considered as the user’s current orientation.
In Figure 2, we can also observe a section containing a list of nearby buildings, called “Close to you”, This is intended to work as a text alternative to the graphical representation of the map. Next to the name of each building, a link to start navigation to that place is shown. After this section, another section called “Visible on the map” lists buildings which fit the current view bounds of the map.
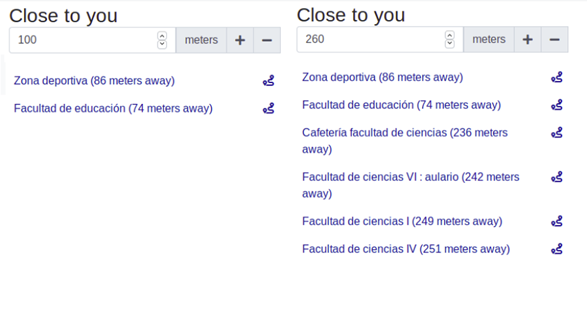
Users can adapt the text alternative to their needs, by adjusting how far the application will look for buildings near them. A control is displayed right at the start of the text alternative section. This control shows the distance the map is working with and some buttons to modify it. If users do so, for example increasing it, the list of nearby buildings will be recomputed, as it can be observed in Figure 4. On the left, the application looks for buildings in a radius of 100 meters, so only two buildings are displayed. When we increase that radius to 260 meters, the application displays six buildings, as it can be seen on the right.
This sidebar can be hidden at will. As seen on the top left of Figure 2, the user interface also contains a “hamburger” menu with links to the navigation mode and the settings page.
4.3. Accessible User Interface
The accessibility of the web map is achieved by combining a set of standards and tools from the WCAG and the ARIA specification. It is important to remark that the map is implemented using SVG as a base, because it is the only web graphics technology that supports decent accessibility. This is because SVG is a markup language which represents graphic elements as XML, so accessibility attributes can be included. We run our own study where we researched about which combinations of ARIA attributes and web browsers worked the best with a screen reader and SVG. The study concluded with some attributes that have the same effect on Chrome, Firefox and Edge:
The “presentation” role together with the “aria-hidden” attribute can hide an element from the screen reader on the three browsers.
The “group” role seems to work fine on the three browsers.
The “title” and “desc” elements expose title and description of a shape correctly to the screen reader on the three browsers.
The “aria-label” attribute works on both Firefox and Chrome, but not on Edge.
It is important to consider that, for this study, the screen readers involved were NVDA on Firefox and Edge, and Chromevox on Chrome. We concluded that the best option is to write code that uses “desc” elements and ARIA attributes in order to obtain the maximum compatibility on the three browsers, while assuring a good indexation by search engines. This is close to the conclusion we can jump to by reading other studies about this topic (Ferraz, 2017; Fisher, 2019).
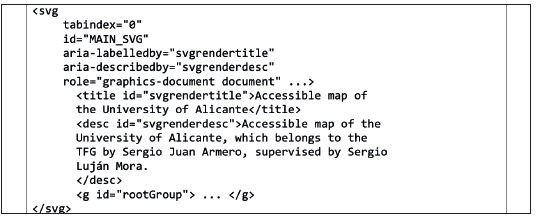
In Figure 5, an excerpt of the code, which represents a building in our map, can be observed. Some irrelevant attributes -in terms of accessibility- have been removed for the sake of brevity. The “role” attribute is used to declare that the contents of the shape are an image -“img” role- and that they have meaning depending on their presentation -”graphics-symbol” role-. Then, ARIA attributes are used to provide a label and a description. A label is a short text which names an element. The description, otherwise, is a longer text which provides more information about the element. In the code, we combine the ARIA “describedby” attribute with the SVG “desc” element by referencing one from the other, so that the description is available for both AT and search engines.
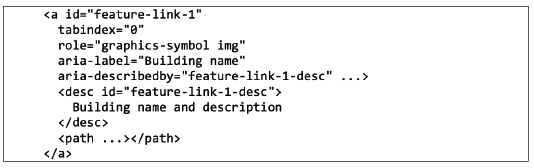
Figure. 5: SVG code that renders a feature (in this case, a building) with accessibility information
We use this knowledge to deploy ARIA attributes to SVG code generated by a Leaflet viewer. First, the viewer receives the geographical data from the server. Then, it renders an SVG inline document. We make the markup accessible in two ways: we provide a custom renderer which wraps each shape representing a building in a link. This allows the user to go through the buildings with the Tab key. Once a building is focused, the second strategy comes into play: information which describes the building is loaded from the server into ARIA attributes. Using the right combination of attributes allows the screen reader to correctly enunciate useful information to the user with disability. This sequence is illustrated in Figure 6.
Regarding the marker groups previously mentioned, they are labelled after the name of the building with the greatest priority. This priority is set manually by the data managers for each one of the buildings. This allows us to differentiate between more and less important ones. In case of tie, the group is named after the closest one to the group marker position.
Additionally, information about the whole map is exposed to the AT. This means that not only individual buildings or markers have accessibility data, but the map itself also does. This way, a user can know at a glance what to expect on the map. For example, Figure 7 shows how our application states that the map shows geographical information about the University of Alicante. The strategy to make this data readable by the AT is the same as before: ARIA attributes related to “title” and “desc” elements. However, in this case we do not wrap anything in a link. Since we are working now with an HTML element, the “tabindex” attribute will suffice in order to allow the map to be focused by keyboard. We only must wrap SVG elements to make them focusable.
Besides the web map, a textual representation of the information is provided. This is an alternative way of displaying the same data, and it is crucial for accessibility. It uses the user’s current location to display a list of places near them.
However, not all users with disabilities have visual problems. To support users with physical or intellectual disabilities, the web map provides several ways of interacting with it. It can be explored and controlled with the keyboard, with the mouse or clicking on some control buttons on the screen.
It can also be used by voice. The voice controls work for the exploration and the navigation mode. On the exploration mode, users can use their voice to search and select buildings, pan and zoom the map view, hear their orientation or move the map to their location. These controls have been implemented using the Web Speech API (World Wide Web Consortium, 2018). This API allows the developer to access two features related with voice: Text to Speech and Speech Recognition. Our project uses both to communicate with the user via voice.
First of all, we use the Speech Recognition to listen to what the user says. When the user says a command out loud, the API provides our website with a transcript of what they said. Then, using regular expressions, we discern if the transcript fits to any of the available commands. If it does so, the action corresponding to that command is executed.
Secondly, we use the Text to Speech feature to answer the user when they use a voice command. For example, if the user performs a search by voice, the results will be read out loud using this API. However, this only happens when a screen reader is not active. If it is -currently only Chromevox can be detected- the responsibility of talking will be passed on to the screen reader. This is done with the purpose of avoiding conflicts, since AT should prevail over our own implementation of Text to Speech.
On the navigation mode, the voice can be used to look for routes between two buildings. Once the route is simulated, users can go through the guide -the steps they must follow to get to their destination- with voice commands. This is very useful for hands-free navigation, so that the user can focus on their surroundings and on following the route.
Thirdly, alternative representation is also provided. The instructions are both displayed in a numbered list and drawn on the map, as could be noted in Figure 8. Instructions are displayed on the map as paths and turning points, which are highlighted when that step of the guide is selected. The numbered list shows every necessary step to go from the starting to the ending point. These steps are stated with the same syntactic structure, which helps users with intellectual disabilities. This mode also takes into account the accessibility of the computed route. This means that the application will try first to obtain a route that has no obstacles, and if that is not possible, a route with obstacles will be displayed as well as an alert about this situation, so the user could be aware. In both cases, the paths which have aids for people with disabilities have more priority in the computation of the route. Obstacles depend on the kind of disability and can only be detected if it is indicated on the navigation mode screen, using the selector visible in the top left corner of Figure 8. This kind of navigation, where the nature of the paths is considered, is currently being implemented by Google Maps. Although it is not available yet world-wide, the latest version of this service is able to simulate routes which do not count with architectonical obstacles (Akasaka, 2018).

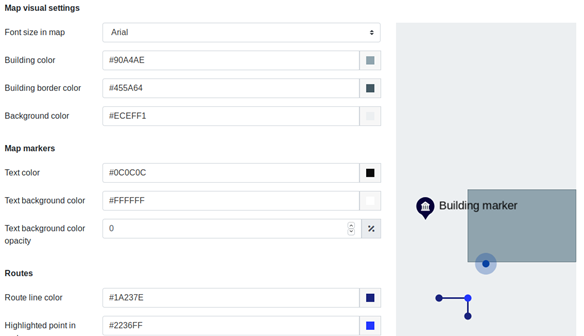
Another way of achieving accessibility is customization. Our project comes with a long set of fully customizable settings. On the web map, the color of buildings, location and orientation indicators, path lines and turning points can be changed. This is crucial for color blind users and for other types of visual disabilities, because they can adjust the colors to the ones which best fit their needs. The size of the text, as well as the font type, can be changed too. This helps people with poor vision to perceive the map better. Since the navigation mode provides distances in steps, step distance and walking speed can be customized too in the user's profile, so that the application calculates more accurate instructions.
The application offers a preview of the chosen settings, as can be observed on the right side of Figure 9. This way, the user can comfortably explore the multiple combinations of colors and text sizes and, when they are sure of their choice, save those settings. Since settings are saved locally, users can have different ones on different devices. They are stored in cookies, which are retrieved every time the user accesses the map. The presentation is then modified depending on the values of those cookies. This technology was chosen over others like Local Storage because cookies are compatible with all the browsers and they can be transferred to the server. Right now, this is not done since it is not needed, but it could be needed in future improvements of the project.
The web map can also inform the user about their position and orientation. That means that users with visual and intellectual disabilities -who normally have most orientation trouble- can know at every time where they are looking at. The name of the building they are headed is read out loud by the application and displayed on the screen. The user can trigger this behavior using a button. In addition, during the navigation, information about the surroundings is provided. That is, in some points of the route, a name of a building and its position relative to the user will be announced. This only happens when the user browses each one of the steps of the route. This way, the user can know if they are following the instructions correctly and have a safer experience.
4.4. Accessibility evaluation
The developed web application passed successfully both HTML and CSS official validators. Furthermore, an automated accessibility test was carried out, which also passed successfully. The results WCAG 2.0 AAA level (World Wide Web Consortium, 2008). WCAG 2.1 (World Wide Web Consortium, 2018) could not be tested, since no automatic tools exist for that version when the accessibility was evaluated. This should be checked with a human test. It also showed compatibility with the most used browsers nowadays and compliance with the SEO guidelines of Google, Bing and Yahoo.
Manual tests regarding color blind accessibility were also performed. We used the WebAIM color checker tool and a web browser extension -“Let's get color blind” - in order to simulate color blindness. The default colors are compliant with the WCAG AAA Contrast Ratio even for this disability.
5. Conclusions and future work
The obtained result shows that it is possible to implement an accessible web map with good functionality and a modern design. However, they require to have a full geographical database with the data to be presented on the map. In addition, it is essential to provide more information, besides the geographical one, in order to achieve an accessible presentation. This makes our model incompatible with current maps APIs, e.g. Google Maps. These APIs normally load the map on a canvas, which as discussed in this work, is not suitable for accessibility. So, although we implemented an accessible web map, it is limited to those who can afford to feed and maintain a geographical database.
It is interesting to mention that our proposed solution is limited to the kinds of disability we considered. For example, we can simulate routes taking into account visual and physical disabilities -since they are the only ones, we store obstacles and assistance points about- but users with some other disabilities will not be able to simulate routes adjusted to their disability, and will have to choose one whose limitations are similar to their own. In addition, since the developer of the map must maintain their own geographical database, the complex the map gets, the complicated its maintainability gets. This is something to take into account in terms of project costs and risks.
Our research also shows the importance of SVG in web accessibility. Whenever an image has multiple parts which convey meaning, this technology is the only way to provide an accessible way of providing that information. Although “img” elements with alternative text can display an image in an accessible way, we must use SVG if we want more advanced features as interaction and modularity. This means that the development of scalar vector graphics is fundamental for web accessibility, as well as the proper implementation of the specification by all modern browsers. In this case specifically, this is of great importance, since web maps could help people with disabilities with one of the most problematic matters for them: independent movement. Improving accessibility on web maps can help them become more self-sufficient and, right now, this improvement is only achievable using SVG. Additionally, our proposed solution is compatible and works properly on mobile devices, so it can be used to help people with disabilities to move around their surroundings.
Our proposed solution stands out among others in terms of extensibility and features. Other studies have very good proposals but focused on one of the modes described in this paper. For example, a paper (Calle-Jiménez, Eguez-Sarzosa, & Luján-Mora, 2018) performs a research about exploration and, other (Tao, Ding, Wang, & Ganz, 2017), about navigation. However, we integrate both on the same proposed solution, and we provide along them useful functionalities as voice control, location, orientation and dynamic text alternative. We have also conceived a system that works for geographical data but can be extended, by a few changes in implementation, to other kinds of information. For example, this system could present and describe a map of the human body just by getting rid of some parts of the database and changing the vocabulary of the user interface. The system can be used with several purposes, as long as the necessary information for doing so is available.
Accessibility is far from being a standard on current computer applications. In spite of the benefits it provides, there is not too much awareness about this topic on developers and computer students. Institutions are not making it easy, either. Although the WCAG has existed almost since the foundation of the W3C, the ARIA specification which allows developers to include accessibility information dates from 2014. That is not a long time, speaking in terms of computers.
Right now, the specification works well only with basic cases, and it gets complicated when we try to make it work on specific applications, as web maps. Only for the screen readers to read information properly, we needed to carry on a full study to observe how the most used readers handled ARIA attributes and, then, choose the best ones to use. The current outlook reminds of the early days of the web, where each browser implemented the specifications their own way. This is detrimental to all the awareness efforts. To sum up, we need consistent accessibility standards, specifications and implementations.
Our application can be improved in several ways. First, a test with real users is planned to be carried out in the next few months, which we expect to provide us with a better vision of the web map accessibility and usability, in addition to knowledge about the user experience. We must consider the results of the human tests and the comments of the users. The feedback will allow us to understand how the application fits to the needs of people with disabilities.
In addition, right now we only support outdoors navigation. We think that a very useful feature would be to provide indoors exploration and navigation, so users can safely go through indoor spaces. The exploration mode would be like the outdoors one. The navigation mode would simulate routes inside buildings, in a similar way to the one other researches have proposed, where it proved to be useful (Calle-Jiménez & Luján-Mora, 2016). Indoors positioning techniques described in some studies, which use Bluetooth and RSSI (Cabrera-Goyes & Ordóñez-Camacho, 2018) or NFC tags (Tao, Ding, Wang, & Ganz, 2017) could also be adopted in order to provide the user orientation about their surroundings.
The algorithm used to compute routes uses paths saved in a static way on the database. This makes maintainability harder, since it requires human effort to manage those paths. An algorithm that generates paths dynamically from the geographical data could be beneficial in this respect.
Regarding the voice controls, they only work on Chrome at the moment, since it is the only browser compatible with the Web Speech API. As soon as any other browser offers support for the API, we should check that it works properly in our application. They should also be revised to make them smarter, allowing users to speak with a more natural language.
Users should also be able to request information about their surroundings at will during the navigation mode. With the current implementation, that can only be done in exploration mode.

