


 Inglés (pdf)
 Articulo en XML
 Referencias del artículo
 Enviar articulo por email
 Citado por SciELO
  Similares en
SciELO
Similares en
SciELO 
 Permalink
1. Introduction
Learning as a form of development is the base for any society. The knowledge being generated all around the world and across all kinds of areas and subjects is recurrently more evident in certain fields such as science and technology. Therefore, it is imperative for professionals and researches to stay up to date in their fields of choice as easily and effectively as new information is constantly released
In order to understand how to improve our ability to learn it is necessary to understand how the very process of learning works. Learning Styles Models are tools designed to measure and better understand preferences and the mechanism of learning itself and how to take advantage of the variables. Although Learning Styles Models have been broadly studied, there is unfortunately little to none information about a clear method to classify and even create them. As a result of this a lot of different models exist without a clear differentiation from one another.
As mentioned above the lack of conceptual consensus led to the creation of many different types of models. Some of them where created by small modifications or corrections of previously developed models, while others presented completely different approaches. According to the investigation conducted by Coffield, Moseley, Hall and Ecclestone (Coffield, Moseley, & Ecclestone, 2004), there are over seventy-one different models. In order to classify them, they divided the various methods into five different families. One of said the families, for example, considers that the learning styles are part of the student’s personality type (Hall & Moseley, 2005), while other considers that they are representations of the subject´s current preferences and that they are constantly evolving (Hayes & Allinson, 1997).
The Index of Learning Styles (ILS) is a Learning Styles Model designed by Richard Felder and Linda Silverman in 1988 (Felder & Spurlin, 2005b). This model consists of four groups of learning styles where students are assigned a score based on the answers given on a questionnaire. Notwithstanding the fact that this particular model takes into account certain personality traits, it is mostly considered a part of the “flexibly stable learning preference” family (Cueva, Calderón, Salazar & Grijalva, 2018). Another model from the same family is Allinson and Hayes’s model (Hayes & Allinson, 1997).
The ILS is not only easy to employ, but it also gives a great deal of information and furthers the understanding of how the actual process of learning works. An example of this is the research conducted by Felder (Felder & Silverman, 1988) and Cueva (Cueva, Calderón, Salazar , & Grijalva , 2018), in which they obtain the ILS of a group of STEM students and compared the learning styles with the teaching styles of their institutions both established that there is not a required set of learning styles to study a specific major, instead every student (with any combination of learning styles) is able to succeed in whatever their field of choice is, as long as they understand how to take advantage of their learning styles.
In this particular case study Geometry was chosen a subject matter, as it is considered the simplest math related subject, and it is the basis for more complex majors, such as the Engineering, particularly the Control Systems in Electronic Engineering. Every STEM student knows that math, physics and programming are core subjects for their education. Furthermore, geometry might be just as important as the above mentioned subjects since it requires of students a more generalized “outside of the box thinking” as it were. Some even consider that Geometry is the “clearest way of thinking available to us” (Bursill-Hall, 2002).
The information used for this investigation is based upon the results obtained by the students at levelling courses from “Escuela Politécnica Nacional” (EPN) in Ecuador, which focused on the results obtained in Geometry tests and the ILS questionnaire. This paper sets to identify the correlation, if any, between the Learning Styles of the students and their scores. Taking into account that each teacher uses different methodologies and teaching styles, it is expected to find that the results have a low correlation or no correlation at all. Nonetheless, if we were to find any significant correlation, some students would have a clear advantage studying for a given subject based on their own Learning Styles.
The content of this paper includes: an explanation of the problem, the analysis tools, and the description of the methodology, results, and conclusions.
2. Problem description
Learning styles models have existed for a very long time. Their main objective was always to give students the possibility to improve their understanding of the mechanism through which they learn and study, and therefore implement and reinforce it. In addition, we believe it would also be a useful tool for teaching professionals to determine if there is any preferred method of learning among their assigned group of students. Unfortunately, it has proven to be a challenge to establish to learning preference within a group of individuals, given that it would imply that teachers require to apply different teaching styles to reach each and every of their students’ preferences.
This is why is necessary discover the model of the relationship between the different learning models and the performance in a university class, how is presented in Equation 1.
 (1)
(1)
Where Puc is the Index of performance, ls1, …, lsn are the different learning styles. The information presented in this paper will compare the performance of a group of students taking a geometry course with their learning styles according to the ILS model.
2.1. Study Case: Geometry
It is often a challenge to grasp the concept of geometry as a necessary subject and actually applicable in day to day life. As this is the case it is not easy to spot any other primary applications of geometry other than in construction related experiences. There are certain very interesting hidden applications, like the dressing of controls systems for robots, but still most people would believe that they will never interact with geometry in its purest form in their lives and to a certain extend it is somewhat a valid point.
Geometry has been studied for a very long time, even as far as the ancient civilizations of the Greeks, after which our modern day civilization is modelled. However, the reasons to study geometry in its basic form have varied throughout time and history. The current idea as to why geometry is important to study differ widely from the reasons of the ancient Greeks, who were starting to formulate explanations based on natural causes instead of supernatural ones.
Current study of geometry is normally attributed to the benefits it provides student rather than to the knowledge it provides in itself. Geometry is mostly defended by arguing that its teachings “train the mind in clear and rigorous thinking” (Bursill-Hall, 2002). As a tool to improve rational thinking it would be interesting to find if students who have a benefit of obtaining higher results and scores in their chosen careers by the mere understanding of geometry and its laws.
2.2. Introduction to the Index of Learning Style
The Index of Learning Styles is the result of several investigations aiming at understanding learning and behavior analysis. It takes Carl Jung’s (Felder & Linda, Learning and Teaching Styles, 1988) model as the foundation to build a model that originally considered five different groups to represent all dimensions of learning and both possible learning styles within them. After some improvement, the model was reduced to four groups and it offers the affinity towards both learning styles in the group instead of a binary result.
The ILS is easy to apply; it only requires the participants to answer the forty-four questions of a questionnaire with two different answers for each question. It is important to note that the method is aimed at the way that each student feels about the results, rather than the results themselves. The main benefit of this kind of tests is the own interpretation of each student as related to their learning preferences. The main benefit of taking the ILS it to allow the students to take advantage of this knowledge and improve effectively the way that they study.
The ILS is currently divided into four groups, and each group contains two opposite learning styles. The groups and their learning styles are (Felder & Rebecca, 2005a):
Perception group:
Sensory: prefer facts, data and experimentation.
Intuitive: lean towards principles and theories.
Input group:
Visual: remember and understand pictures, diagrams, flow charts, time lines easier.
Verbal: would rather hear or read the explanations, and discuss the topic to reach a better understanding.
Processing group:
Active: relate more to knowledge gained by experience, work in groups, and participate actively in class.
Reflective: would rather have the opportunity to think about the information presented, tend to be theoreticians.
Understanding group:
Sequential: feel comfortable with a logical order progression, following a linear reasoning when solving problems.
Global: prefer the bigger picture, deduce the specific from the general ideas, and devise their own way of solving a problem.
The ILS questionnaire relies upon asking the students how they acquire, process and interpret information (Felder & Rebecca, 2005a). Therefore, it is necessary that the student is able to recognize the differences between both possible answers and select the one that is closer to their behavior instead of the one that they think is considered as “the correct” answer. Unfortunately, there are several biases that could influence the answers the students provide. For example, if someone taught them that the best way to analyze information is using a graph they might select that option, even when they acknowledge that verbal information is easier to understand for them.
The objective of researching how the learning mechanisms work is mainly to understand how professionals approach teaching. Unfortunately, describing how learning works is complex procedure and it contains a lot of variables. Since all of us have different preferences, it is challenging to come up with a system that represents each and every one. There is not a single answer, nor a specific method to succeed at leaning any-and everything, however there are already some tools that students and teachers can use to make their learning experiences efficient and pleasant.
3. Methodology
The methodology describes the data acquisition and results analysis tools employed in this study. This section contains a brief explanation of both.
3.1. Data acquisition
The ILS was selected as the tool to measure the students learning styles. A few different methods were considered, but ILS had certain key advantages- One of them is the fact that the researchers are already familiarized with it and it is easy to apply. The ILS gives each student a number within a scale in four different groups. The results of the ILS are not definitive, but they could be considered as an accurate description of reality (Felder & Spurlin, 2005b).
With the authorization to use the ILS from one of the creators, it was uploaded to the university student administration system. The students were asked for their option collaboration in the investigation through e-mail exchanges. Students from all the different faculties and levels took part in the survey. Only the students that took the course on Geometry at EPN were taken into account for this analysis.
This paper contains the analysis of three consecutive semesters starting from the first half of 2017. Since the semester of the first half of 2018 was still on course while this article was conceptualized, the final grade for this semester was computed with the information available at the time. The estimation of the final grade is based on the probability of approval. (Sánchez, Sandoval, Salazar, & Sánchez, 2018)
3.2. Database preparation and analysis
This study was formulated by comparing the results obtained with the ILS questionnaire and the grades obtained in the geometry course taught at the university.
The results of the ILS measures eight learning styles separately and compares the scores of the learning styles from the same group. This analysis will consider the individual score in each learning style instead of the general score obtained in each group. Every learning style score and the Geometry class score are over forty points.
The probability of approval, used for obtaining an approximation of the final grades for the first semester of 2018, is based on the work made by Sánchez, Sandoval-Salazar and Guevara (Sánchez, Sandoval , Salazar, & Sánchez , 2018). It considers a series of logistic regressions based on historic information and considers the data from Table 1 according to Equation 2. This process has an accuracy of around 80% while considering a historical data of three years.

 (2)
(2)
The methods to analyze the data considers linear correlations, correlation dispersion, and their respective analysis were used
4. Discussion
This section presents some of the results obtained by summarizing them in a correlation matrix, some charts and graphs.
4.1. Model: Pearson Correlation
The Pearson correlation allows to establish if there is significant impact between the scores obtained in any of the eight learning styles under analysis and the grades for the Geometry class.
The correlation analysis will measure the strength of the correlation, as well as its direction and an auxiliary value (p-Value) that is used to determine if the correlation is meaningful.
The correlation strength is a value between -1 and 1, where the sign represents the direction of the correlation. For a positive strength the value represents a direct correlation, and a negative value an inverse correlation. A strength of zero would imply that the two values are not related at all, while a value of  0.4 imply a moderate correlation, a strength of
  means that both variables exhibit the same behaviour.
The p-Value allows to establish the significance of the correlation. If the p-Value is lower than the level of significance (0.05), then the correlation is different from zero. On the other hand, if the value is higher, then it is not possible to establish that the correlation is different from zero, therefore the value of the strength becomes meaningless.
This results only considered the actual scores of the students, which are:
Active style:
Pearson correlation = 
p-Value = 0.397
Reflective style:
Pearson correlation = 
p-Value = 0.365
Sensorial style:
Pearson correlation = 
p-Value = 0.091
Intuitive style:
Pearson correlation = 
p-Value = 0.094
Visual style:
Pearson correlation = 
p-Value = 0.231
Verbal style:
Pearson correlation = 
p-Value = 0.260
Sequential style:
Pearson correlation = 
p-Value = 0.363
Global style:
Pearson correlation = 0.038
p-Value = 0.426.
This results shows that the p-Value is too high in every correlation, therefore it is not possible to establish that the correlation is significant.
4.2. Model: Correlation Matrix
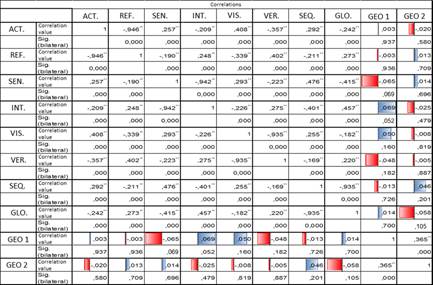
The next step considered the comparison of the correlation with two different methods. The matrix from Figure 1 shows the results obtained. The matrix is the result of the comparison of the Pearson and Spearman linear correlations, using a statistical confidence of 95%.
The matrix uses the first three letters of each learning style, for example ACT, which stands for active. The field that contain GEO1 and GEO2 refer to the geometry grades, where GEO1 considers the actual grades from the previous semesters and GEO2 the approximation for the current semester. The “correlation value” establishes the correlation strength and its direction. On the other hand, “Sig. (bilateral)” is used to obtain the correlation significance.
It is possible to see that one of the strongest inverse correlation is given between the Sensorial style and the geometry score. While visual and intuitive styles present the higher direct correlations with the geometry score.
4.3. Correlation dispersion
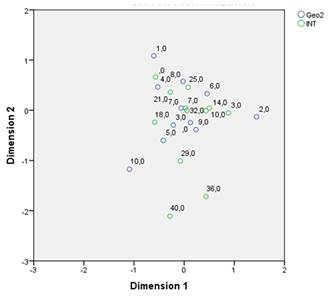
The graphs presented in this section allows the analysis of bi-dimensional correlations. This allows to see the distance and therefore correlation between grades (blue circles) and the learning styles (green circles). This analysis considers the correlation distance and not the Euclidean distance.
The graph from Figure 2 shows the correlation distribution between the geometry grades and the Intuitive style. Where the low scores are not correlated with the Intuitive style, but the higher grades are close to higher Intuitive style scores.

The graph from Figure 3 shows the correlation distribution between the geometry grades approximation and the Intuitive style. There is a notorious difference when compared with the previous graph, but the behavior at the center remains the same.
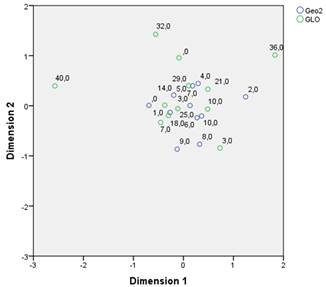
The graph from Figure 4 shows the correlation distribution between the geometry grades and the Global style. This shows that there is certain direct relation between the grades and this style.

The graph from Figure 5 shows the correlation distribution between the geometry grades approximation and the Global style. In contrast with the previous graph, this one presents an aggrupation of lower grades with higher scores of the style, implying an inverse correlation.
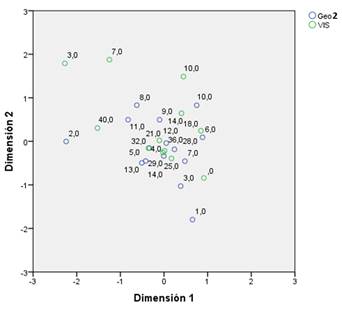
The graph from Figure 6 shows the correlation distribution between the geometry grades and the Visual style. Even though lower grades and scores do not reveal any important information, the mid and high grades and scores are closer to the center of the graph, suggesting a strong direct correlation.
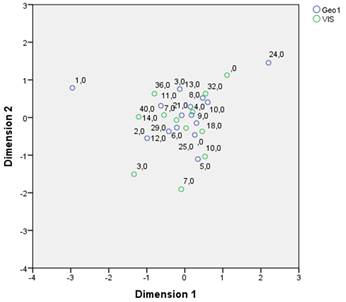
The graph from Figure 7 shows the correlation distribution between the geometry grades approximation and the Visual style. This graph shows a very similar behavior to the last one. Suggesting that there is a direct relation.
5. Conclusions and Recommendations
The analysis of correlations between the scores obtained by the students and their learning styles normally reflect the independence between this two. However, since this analysis focused on a specific subject there was the possibility that the results might reveal some hidden relationship between Geometry and one or more of the learning styles.
The results that were obtained only with the Pearson Correlation established that none of the correlations where significant. Nevertheless, even if they were significant their strength is considerably low. Either way there is no correlation between any of the learning preferences and their performance in Geometry.
In order to increase the amount of data under analysis, the prediction model was applied to the results of the current semester. This model has proved to be useful when predicting the possibility of a student to approve a subject only considering the grade of the first half of the semester. Even though the results obtained with this technique are not equal to the ones that consider real grades, the model does inform that the accuracy of around 80%.
The correlation matrix considered more information, producing interesting results. Unfortunately, the results are still not considerable as relevant. The correlations with the Sensorial and Intuitive styles obtained the highest strength, therefore it would be interesting to extend this investigation by focusing between this types of learning styles. If they were found to be significant that would lead to some interesting research regarding the causation of this phenomena.
The correlations dispersion allowed to visualize certain relations. The three styles presented were the ones that contained a higher density of values around the center. The intuitive correlation that was hinted previously proves to be slightly more evident, and even the possibility that Visual style is directly correlated with the performance in geometry.
In agreement with the previous research about this topic, the results obtained were not enough to determine if there is a direct relation between the learning styles and the performance of the mm be explained by the generalization of certain teaching style. We consider it necessary that this kind of investigation is carried out on different institutions, in order to compare the results and maybe even discover if a certain subject does benefit from a specific set of learning styles.
This methodology can be applied to any university class or course related to Automatic Control Systems.

