


 English (pdf)
 Article in xml format
 Article references
 Send this article by e-mail
 Cited by SciELO
  Similars in
SciELO
Similars in
SciELO 
 Permalink
1. Introduction
Technology's progress of renewable energies in recent years has marked an impressive development for the generation, transmission and intelligent distribution of electric energy. Achieving an economic benefit for the user and its correct management for development. In addition, with the implementation of Information and Communication Technologies (ICTs), Electric Power Systems (EPS) will develop into Smart Grids (SG), more flexible, cleaner, safer and more economical. This study makes the implementation of a photovoltaic energy estimator of a Microgrid (MG), consisting of a set of 160 panels with nominal capacity of 35kWp, distributed as follows: 15kW array of monocrystalline panels, polycrystalline 15kW and polycrystalline 4kW with tracking in an axis, Espinoza et al. (2017), the study is carried out with the MATLAB® Simulink tool. Therefore, the behavior of the system can be modeled by the use of computational tools as in the studies in: Prasanth et al. (2018); Razman and Chee, (2017); Rameen, (2017); Ahmad et al. (2017). This allows to have a referential system with respect to the installed to estimate the production of energy under the available solar resource, also allows to study the possibility of improving the performance by replacing new panels with superior characteristics. The design criteria have been referred to the technical specifications of the panels and equipment installed. To obtain its validation by means of measurement tests in each stage, a database obtained from the weather station and a comparison of the real measurements with the results of the model have been entered.
1.1 Description of the photovoltaic system
The photovoltaic system about study is located in the Balzay Technological Campus of the University of Cuenca in Ecuador, latitude: -2.892, longitude: -79.038, time: GMT-5, azimuth: 196.54°. This system has a nominal capacity of 35kWp consisting of 136 photovoltaic solar panels of 250Wp each, Atersa brand (Spain), distributed as follows: Photovoltaic System 1 (PVS1) with 60 fixed panels oriented at an angle of 5° north of monocrystalline type with a capacity of 15kW; PVS2 with 60 fixed panels oriented at an angle of 5° north of polycrystalline type capacity of 15kW, both sub groups contain a GPTech independent two-level inverter with tracking of the maximum power point. In addition, there is a PVS3 with 16 panels, 4kWp capacity, of polycrystalline type, movable on an axis with east-west tracking capability with a maximum inclination of 90°. The mobile photovoltaic system is connected to an inverter with a nominal capacity of 5kW of Fronius Primo brand model 5.0-1, Espinoza et al. (2017). The Table 1 summarizes the photovoltaic system and its main characteristics:

2. Methodology
The procedure and the methodology used for the estimation of energy from the photovoltaic system about study is carried out through modeling and simulation mainly in 4 stages, which are: data acquisition, modeling and simulation, validation and finally applications, as observed in Figure 1:
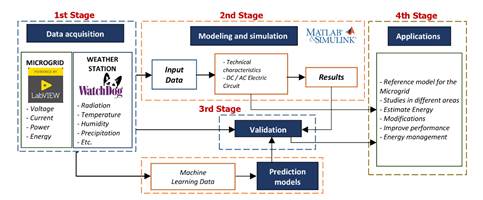
2.1 First Stage - Data Acquisition
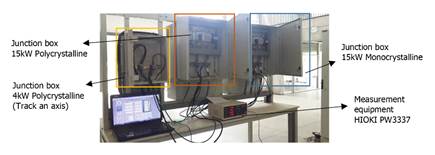
The data acquisition was developed in two sections: Meteorological data Radiation [W/m²] and temperature [°C] obtained directly from the WatchDog 2000 Series Weather Station and Microgrid data including: voltage, current, power and energy, both in Direct Current DC and AC alternate, through the electrical variable measuring equipment HIOKI PW3337 (see Figure 2), with the help of a graphical and storage interface designed in LabVIEW and a TCP/IP LAN connection. The sample size of the measurements was executed for each minute during each day of operation 6am - 6pm, for the two sections simultaneously, during a monitoring period of 4 months.
2.2 Second stage - Modeling and simulation
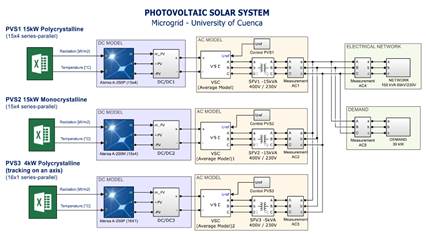
In this stage of the methodology the main aspects have been considered, a database of meteorological resources with radiation and non-uniform temperature, see example: Ding et al. (2012) and Sreenivasa et al. (2017), electrical system, tracking algorithms Perturb and Observe, Nayak and Shaw, (2017); and finally the 3D modeling of the tracking component. From the data coming from the weather station, the modeling and simulation of the three photovoltaic generation systems (fixed monocrystalline, fixed polycrystalline and axis tracking) were designed, using the MATLAB Simulink tools, see: Rameen, (2017) and Ahmad et al. (2017). In this application a so-called "PV Array" of a series of photovoltaic modules was used, where it is selected from a wide list of models and manufacturers.
The model corresponding to the photovoltaic system about study, is represented in Figure 3, where the model made in Simulink of MATLAB can be observed, which includes a database of radiation and temperature of the weather station in "xlsx" format, the PV Array block with the specifications of the Atersa A250P and A250M models, in the respective parallel series configuration and the implementation of the MPPT with the Perturb and Observe algorithm of MATLAB. A three-phase DC/AC inverter "Average-model based VSC" with a switching frequency of 5 kHz is used for the interconnection to the AC system and they function as current sources to the PCC (Point Coupling Common). For the connection to grid, a galvanic isolation using dry type three-phase 400V/230Vac transformers is used, and the simulation of the system was developed with a configuration where a constant load of 30kW can be fed into the PCC from the photovoltaic system about study or from the public electric power system, which has a transformer with a capacity of 150kVA to 12.7kV from the public grid, in representation of the laboratory facilities of the University of Cuenca.
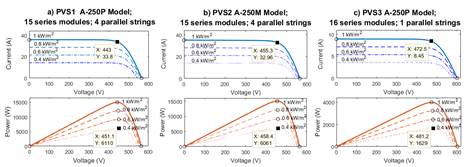
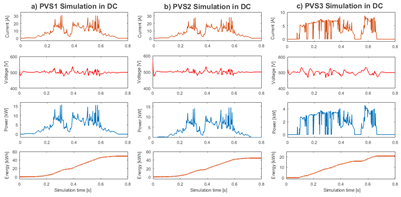
For modeling of the photovoltaic solar panels, the behavior is used by the curves I-V, P-V from the libraries obtained from MATLAB, the photovoltaic systems are studied at a constant temperature of 25°C. Figures 4a and 4b show a similarity in the ranges of current and voltage operation between polycrystalline and monocrystalline models, under the different solar radiation conditions. In the characteristics I-V, P-V Polycrystalline 4kW Photovoltaic System tracking on a Figure 4c axis the range of voltage operation increases when considering 16 panels in series, with respect to previous systems and its current is limited to 8.94A. From the figure it is observed that to operate at the point of maximum power, in the case of polycrystalline it is necessary to operate near 450V with a variation of 8V in the case of decreasing solar radiation to 400W/m², monocrystalline with a value close to 460V and a variation of 4V, finally polycrystalline with tracking on an axis in 480V with a variation of 9V.
For graphically observe the tracking behavior on an axis, the V-Realm Builder MATLAB tool is used, which allows a 3D model that responds before different locations of the energy source. The tracking algorithm is presented in Figure 5, where variable “C” indicates the direction of motor rotation and vector of constant motion on the axis MOV = [1 0 0] (x, y, z).

Results of the Simulation
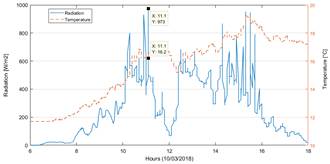
In order to validate the proposed models, the data obtained from the weather station (WatchDog 2900ET) located in the study area were used and correspond to one day, the values of direct solar radiation are represented in [W/m²] and temperature in [°C]. Figure 6, shows the data obtained on the day (03/10/2018) between 6:00 a.m. to 6:00 p.m. As can be seen in the figure, there is an important variation close to 12:00 as a result of the frequent cloudiness of the area with a maximum radiation of 973W/m² for an ambient temperature of 16.2°C and an average of 15.6°C during that day, temperature that within the model used does not represent a significant decrease in the generation of energy, given that the panels used have a coefficient of power of the temperature of -0.43%/°C.
From the meteorological data used, the behaviors of the designed photovoltaic models are presented in Figures 7a and 7b, where the results of the instantaneous power and accumulated energy are shown. In them you can see a linear relationship between radiation and power generated. In Figure 7c, the tracking system on one axis differs from the other systems, because the input data to the radiation model is the result of the tracking algorithm (see Figure 5), in this case it receives more solar radiation for its tracing.
In another aspect, Figure 8, the results of the energy in the output of the set of power converters in AC are observed, in it a linear relationship between the input power and the output current in AC is observed. It can also be seen that the PVS3 has a higher energy production comparatively around 11%, which also reflects in the AC output of the inverter.

2.3 Third stage - Validation of results
In the validation process of the model, the database of the Microgrid obtained in the first stage was used, together with the results of the simulation. For the process of validation of the results, the similarities of the model and the real data were analyzed, obtaining an approximation of 95% in each parameter. Next, the verification for the polycrystalline 15kW system is presented and for the rest of the photovoltaic systems it has been carried out with the same procedure.
Result and validation PVS1
The operating range of the system, due to its configuration in 4 parallel strings, maintains its nominal current value at 35.78A with a nominal irradiance of 1000W/m² (see Figure 4a). The checking of the model current and actual measured current DC [A] is presented in Figure 9a:
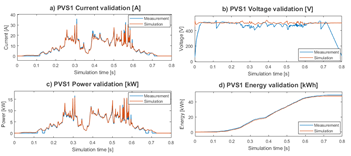
On the other hand, the voltage covers an operating range between 400 to 500Vdc. In Figure 9b you can see the model voltage and real voltage reached in the photovoltaic system with the MPPT controller implementing the perturb and observe algorithm, in the figure it can be verified that MPPT operation range oscillates around 450Vdc as indicated by the Maximum power operating point of the array specifications (see Figure 4a). The power [kW] and the energy in [kWh] presented in Figure 9c and 9d, respectively, show a great approximation with the measurement values.
In the verification of the tracking algorithm on an axis, an alternative database was used, which represents the values obtained from the measurement sensors of the two axes (right-left), see Figure 10a. In response to the algorithm, its performance can be observed at points where the radiation is greater as seen in Figure 10b.

2.4 Automatic data analysis
Advanced data analysis applications with functionality and versatility, allow managing the information of the electrical grid to analyze and extract information, for example: improving energy quality, more efficient distribution, optimization, machine learning, etc. Therefore, under this same criterion, the slogans are corrected as new information is known, see examples in: Chunming et al. (2017) and Mellit et al. (2009). Figure 11 shows the correlation matrix based on the Pearson correlation coefficient of the variables obtained from the weather station of the zone in the interval 10/02/2018 until 03/15/2018, where the variable to be predicted (supervised learning) is the power of PVS1, depending on the other variables.
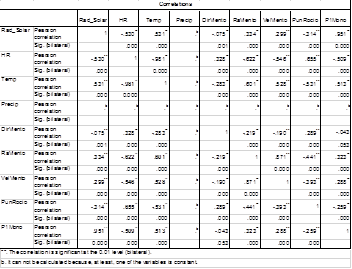
In the correlation matrix it can be seen that the variable of interest electric power (P1Mono) has a high correlation coefficient of 0.951 with respect to solar radiation (Rad_Solar) and a coefficient 0.513 with the temperature variable (Temp), plus a coefficient inversely proportional to the variable relative humidity (HR) -0.509, therefore the most significant variables for the study represent solar radiation and one of the two variables: temperature or relative humidity, since these variables are inversely related in -0.981. On the other hand, the variables Precipitation (Precip), Wind speed (VelViento), Direction (DirViento), Gust of the wind (RaViento) and Dew point (PunRocio) do not influence to a great extent the variable of interest, therefore they are not considered in the model.
Linear Regression Model Monocrystalline System
When applying the linear regression algorithm with a database in 70% training percentage and 30% in validation in the computer program Waikato Environment for Knowledge Analysis (WEKA), a correlation coefficient was obtained in 94.79% of the regression model and an absolute relative error of 19.21%. Equation 1 represents the power [W] according to the most significant variables of the analysis in the area: radiation [W/m2] and temperature [°C].
 (1)
(1)
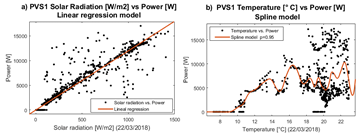
In Figure 12a, the relationship between temperature, radiation and power variables is shown through a linear smoothing regression model. You can see its linear relationship of power with radiation in Figure 13a. The results of the model applying Equation 1 are shown in Figure 12b.
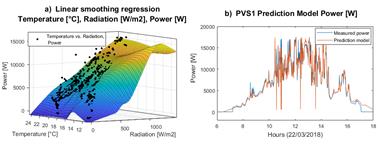
In order to observe the influence of the temperature variable with respect to the power in the study area comprised between 10°C to 25°C, the smoothed spline model with a value of p = 0.95 is included. The smoothed spline "s" is presented in Equation 2, and is built for the smoothing parameter "p" and the specified weights "wi" of MATLAB.
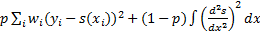 (2)
(2)In Figure 13b, the incidence of temperature for generation in PVS1 is observed, despite having a temperature between 10°C to 25°C, most of the power values are lower than 6 kW, which implies its dependence closer to solar radiation in similar climatic zones. Reason because, its correlation coefficient of 0.513 with the power has less influence with the radiation.
Radiation Prediction
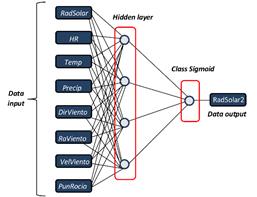
Radiation data have an important impact on the generation of energy, Incidence of radiation and temperature in the power of the PVS1 which is why their prediction studies are developed in the field of Artificial Neural Networks (ANN), due to their degree of complexity and uncertainty, based on some applications: Meenal and Selvakumar, (2018); Almorox and Hontoria, (2014); and Almaraashi, (2018). Due to the scope of this 4-month study, your data is limited for the analysis at this point for the time being, for the application of these prediction models, but an example has been developed in the Figure 14, where the objective is to obtain a prediction model of solar radiation the next day (RadSolar2) from the meteorological data of the previous day.
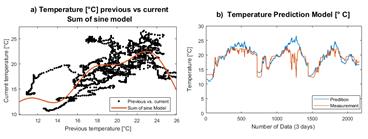
Temperature Prediction
Applying the sum of sine model in a database through MATLAB (Figure 15a), where its objective is to determine an approximation of the temperature variable of the following day  through a learning of temperature data of the previous day (
 ) in the same pre-established order. The results are obtained from the following Equation 3:
 (3)
(3)
Figure 15b shows the application of the model in a database and its results. The relative error is 10.34% of a 3-day continuous test of the example in the study area.
2.5 Fourth stage - Application of the model
In order to use the referential model for the Microgrid using the modeling tools used, it is possible to carry out applications where the feasibility of photovoltaic installations is studied in places where radiation and temperature meteorological data are known, as well as the type of solar panel photovoltaic selected. When obtaining a model you can also make changes and study the possibilities of improving the current system, such as changing and testing different models of the panel manufacturers intuitively, replacing the panels with greater power generation, studying the possibility of changing a fixed system in tracking on an axis, etc. As an example, if we study the possibility of changing the 15kW fixed polycrystalline system in a system with tracking on an axis, as a result we obtain that for a fixed system on average in a day of analysis (03/10/2018), 6.375kW were generated, when changing the fixed system in tracking on an axis, an average of 7.075kW is obtained, which guarantees an increase of approximately 11% on that day.
Development of graphical user interface GUI
A graphic interface has been developed for the user in the MATLAB GUIDE application so that they can observe and interact intuitively, see an example in: Bays et al. (2014). The program has an application for educational purposes later, where you can load a database and estimate the energy production of the study. Besides, it offers the possibility of making modifications to the parallel serial connections of the system and choosing different manufacturers (see Figure 16).

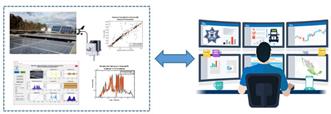
ICTs applied to energy management
The Microgrid is an effective means for an active distribution grid, which will help the large-scale integration and transition from the traditional grid to the smart grid. Similarly, the control and monitoring system, plus information and communication technology, together create "Smart Cities", which facilitates the supervision and control of electric energy transport. In this sense, electrical services are involved in grid automation processes, supported by ICTs, to improve grid efficiency, reliability, security and quality of service (see Figure 17).
3. Conclusions
Using tools for modeling and simulation, we have been able to observe the behavior of the different elements of the photovoltaic generation that participate in the Microgrid, with results similar to their original behavior. The measurement error with respect to the model is less than 4%, which guarantees an excellent reference for the modeled system. Some basic equipment specifications have been directly related to the model, although other factors that alter their normal behavior must also be considered. The use of values and real data can be approximated to a large extent to a real model, observing its most influential parameters and values implies a better knowledge in the study area.
Therefore, the implementation of ICTs in electrical systems allow us to improve the management of the electrical grid, as well as some techniques in the automatic learning of data in the prediction of some variables of interest. As a result of the modeling, some advantages can be highlighted, such as the dimensioning of the equipment, observing and controlling the abnormal effects, controlling the connection of the systems in their stationary state, analyzing the potential and performance of the equipment’s, etc.

