


 English (pdf)
 Article in xml format
 Article references
 Send this article by e-mail
 Cited by SciELO
  Similars in
SciELO
Similars in
SciELO 
 Permalink
1. Introduction
Cardiac arrhythmias are heart condition alterations mainly due to the change of the heart rate. This alteration is generated when the heart's electrical conduction system doesn’t work properly (Khan. T. T, et al., 2015). Some types of arrhythmias are infrequent and transitory nature; therefore, their diagnosis isn’t an easy task when it is performed with a standard electrocardiographic (ECG) test (12-lead test). For proper diagnosis of these types of arrhythmias, there is an ambulatory or Holter ECG test that evaluates the patient for long periods of time without interfering with daily activities of patients (Chung. E. K. Edward, 2013). However, given the length of Holter records (involving a large amount of heartbeat), it is necessary to use computer-aided systems to support the diagnosis.
For the analysis of Holter records is possible to use supervised or unsupervised techniques. But unlike the supervised analysis, in the unsupervised, it is not necessary to have a set of labeled data, as they use it (Aggarwal, et al., 2012) (Carreiras. C, et al., 2016). Thus, the unsupervised analysis is chosen with the objective of designing a system that allows identifying five different types of cardiac arrhythmias in Holter records.
In order to achieve the above objective, a set of morphological and spectral features of the heartbeats are used (Senapati, M. K, et al., 2014), which allow to improve the achieved clustering by the unsupervised method k -means. Besides, other stages as preprocessing and segmentation of heartbeats and the sensibility evaluation of the number of groups are involved (Chen. Y. H & Yu. S. N, 2012). These stages are applied over records from MIT/BIH's arrhythmia database, which includes 48 records with the arrhythmias recommended by the AAMI (Association for the advanced medical of instrumentation) such as: Normal beats (N), Supraventricular ectopic beat (S), Ventricular ectopic beat (V), Fusion beat (F), unknown beat class (Q) (Martis. R. J, et al., 2013).
The unsupervised method k-means, is one of the most well-known clustering methods, it was used for the first time by MacQueen in 1967 and from then, this technique has had many applications, not only for clustering cardiac signals but also another data and numerical signals such as electroencephalographic signals (Wang. J., et al, 2015). Recently, Rodríguez, Gallego, Mora Orozco and Bustamante used k-means with the aim of clustering heartbeats of ventricular premature contraction (Rodríguez. C. A, et al., 2014).
Despite the existence of techniques that have been very helpful to achieve this objective, the design of a robust system to face problems such as signal noise, the morphological variability and the minority classes are still an open issue. Particularly in the case of the minority classes, that is to say, the presence of an abnormal heartbeat inside a record which contains a great quantity of normal heartbeats, its no identification could produce confusions as giving for heal a sick patient, doing that this not submit to an adequate treatment of the sickness. In this work, with the aim of contributing to the solution of present problem, the segment-bases approach for clustering is done, this methodology makes easy the detection of minority classes besides helps the reduction of the computational cost. Because of the method of clustering used (k-means) is sensitive to the initialization of centroids, methods of initialization as max-min and j-means (Ye. C, et al., 2012), (Bhateja. V, et al., 2013) are used, insuring that the algorithm of k-means doesn´t converge in a local minimum but in the global minimum, which improve the clustering. Besides a feature selection to eliminate redundant or irrelevant features that can affect the clustering of heartbeat is done. The segment-bases approach for clustering, the centoid initialization and the feature selection allow to obtain optimal results to classify five different types of arrhythmias with 91,31 %, 99,16 % and 99,36 % for sensibility, specificity and accuracy, respectively.
The rest of this paper is structured as follows: Section 2 describes the materials and methods used. Sections 3 and 4 present results and discussion respectively. Finally, some concluding remarks and future works are drawn in Section 5.
2. Methodology
Clustering is the assignment of a set of observations into subsets so that observations in the same cluster are considered similar with regard to employed features (Revathi. S & Nalini. D. T, 2013).
The experimental data set used in this work comes from the MIT/BIH arrhythmia database that also provides heartbeat labeling. In agreement (Moody. G. B, 1990) since 1975 the Beth Israel Deaconess Medical Center and MIT have supported research into arrhythmia analysis and related subjects. One of the first major products of that effort was the MIT-BIH Arrhythmia Database. The database explains with more detail in the section 2.1.
Figure 1 depicts the methodology proposed for Holter arrhythmia analysis that appraises the next stages: a) Preprocessing and segmentation, b) Features extraction, c) Feature selection, and d) Clustering.
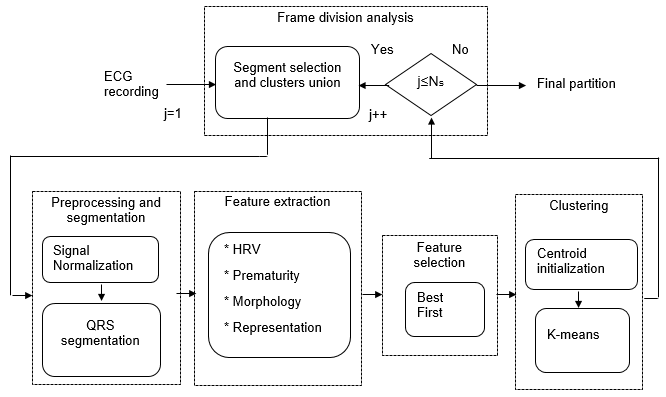
Fig. 1: Block diagram of proposed unsupervised methodology for Holter monitoring of cardiac arrhythmias.
2.1. ECG signals
The MIT-BIH database contains 48 records each one being of about 30 minutes long, obtained from 48 subjects studied by the BIH arrhythmia laboratory between 1975 and 1979. Twenty-three records were chosen at random from a set of 4000 24-hour ambulatory ECG records collected from a mixed population of inpatients (about 60%) and outpatients (about 40%) at Boston's Beth Israel Hospital; the remaining 25 records were selected from the same set to include less common but clinically significant arrhythmias that would not be well-represented in a small random sample. The subjects were 25 men aged 32 to 89 years, and 23 women aged 23 to 89 years.
The records were digitized at 360 samples per second with 11-bit resolution over a 10 mV range. The signals were filtered to limit saturation and for anti-aliasing, using a passband from 0.1 to 100 Hz relative to real time, well beyond the lowest and highest frequencies recoverable from the records. The band pass-filtered signals were digitized at 360 Hz per signal relative to real time using hardware constructed at the MIT Biomedical Engineering Center and at the BIH Biomedical Engineering Laboratory.
Mostly, arrhythmias could be divided into two main types: the first one includes life-threatening heartbeat irregularities requiring immediate therapy with a defibrillator. The second one includes arrhythmias that are not imminently life-threatening, which are the only ones considered in this work. In accordance to the AAMI standard, the following groups are of interest to be examined: normal-labeled heartbeat records (N), Supraventricular ectopic beat (S), Ventricular ectopic beat (V), Fusion beat (F), as well as unknown beat class (Q) is also taken into consideration (Martis. R. J, et al., 2013). It is important to note that the records analysis is performed one by one, and some records exhibit strong unbalanced number of observation per class. Namely, it can be found some records holding just one-two heartbeats of class F, a few of S (less than 10), whereas its number of normal heartbeats may be very huge (more than 3000).
2.2. Preprocessing and Segmentation
ECG signals are normalized regarding the maximum value in order to hold the signal amplitude ranged into (-1, 1);, as well they were centered (set zero-mean) Equation 1 y Equation 2:
 (1)
(1)
 (2)
(2)
This preprocessing is assumed not to affect the separability among the underlying heartbeat groups (Byrne. C. L, 2014).
After QRS complex segmentation is performed from the location of the entries in the database MIT made in the R peak of each heartbeat, a fixed 200ms or 72 samples centered on each peak of the signal window is taken. The extraction of QRS complex is performed with Equation 3.
 (3)
(3)
Where  is the R-peak time location of the j-th heartbeat and Fs is the sampling (360 in the case of the database of MIT).
2.3. Feature extraction
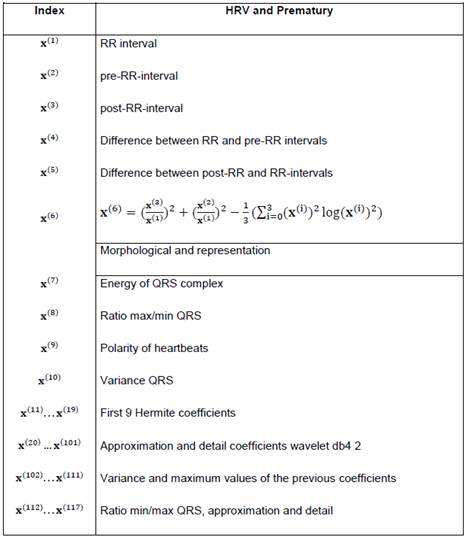
Heartbeats characterization is performed and computed features are described in Table 1.
As a result, feature matrix X is obtained such that X=x
1, ...,x
n
= x
(1), ...,x
(d), being x
i the i-th heartbeat and x
(j) the j-th feature. The number of features d is 117.
is obtained such that X=x
1, ...,x
n
= x
(1), ...,x
(d), being x
i the i-th heartbeat and x
(j) the j-th feature. The number of features d is 117.
An important issue in signal clustering is how to represent the time sequences to partition. This representation greatly influences the performance of the subsequent methods. In practice, these sequences are usually chosen by researchers based on previous similar works (Balachandran. A, et al., 2014) (Xie. X. Q, et al., 2015). After feature selection is done, considering that some features can be redundant or irrelevant (Chandrashekar. G, et al., 2014).
2.4. Feature selection
The feature selection is done through the method called "Best first", which consist on evaluating features individually, choosing them and ordaining them from the best to the worst, eliminating the less important as it is shown in (Kavitha. B, et al., 2010). Once features are selected, a reduced data matrix  is accomplished, where p is the number of selected features, such that p<d.
2.5. Clustering
For further statements, let us to consider the notation C = {C1,…Ck} the k-dimensional clusters set k-means as clustering method is used. In this method, a start partition associated to an initial center set is chosen and their center reassignments change, so they are done to generate new partitions, they are assessed per each iteration. Then, once a center is moved, all reassignments are done and the objective function change due to this movement which is computed.
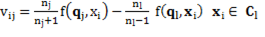
By assuming a data point x i that belongs to C l for the current solution is reassigned to another cluster C j, the center updating can be accomplished applying Equation 4:
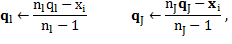 (4)
(4)
where  y
y  .
.
Changes of the objective function value caused by reassignments are computed using Equation 5:
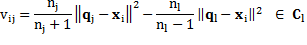 (5)
(5)
The previous equation is applied in case of MSSC objective function. In general, a specific objective function must be considered, so Equation 6:
 (6)
(6)
Where f(.) is the objective function expression corresponding to some criterion or clustering method.
Such changes are computed for all possible reassignments. Then, if they are all non-negative  the procedure stops with a partition corresponding to a local minimum. Otherwise, the reassignment reducing most the objective function value is performed and the procedure iterated (Rodriguez. C. A, et al., 2014).
K-means is tested with random initialization and with initialization max-min and j-means, in order to observe how the performance measures vary regarding different values of number of groups(k), particularly, experiments with k = 5,8,10,12 are performed. Proofs with other moral values of k can be realized, however, the minimal number of k ( 5 ) is established considering that to classify 5 types of arrhythmias, while the maximum number of k ( 12 ) is established in such a way that a cardiologist's visual inspection is not difficult. Between other parameters used in k-means, they are the distance and the maximum number of repetitions, in the realized experiments 2000 repetitions and Euclidean distance are used (Anderberg. M. R, 2014).
2.6. Centroid initialization
Once a group number is fixed, centers for each subset are initialized by using j-means and max-min algorithms (Celebi. M. E, et al., 2013). For further statements, let us consider the notation the partition set of X, standing for the j-th center, k as the number of groups, and j ∈ {1, ..., k}.
2.6.1. J-means algorithm.
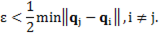
J-means algorithm consist of updating the centers trough local assessment of objective function, only taking into consideration a certain region around the centers instead of all data space (Aldahdooh. R. T & Ashour. W, 2013). This algorithm works as follows. After a random initialization, every point  out of a sphere of radius ∈ with center
  is considered as a centroid candidate. Thus,
  replaces a current centroid . After updating, the objective function value is calculated using only the new centroid. Then, the original objective function (previous value
  ) is compared with the new objective function value (previous value
  ). Thereby, if
  , the process stops; otherwise the algorithm starts again using the same initial partition and its updates. Parameter ∈ is chosen in such way that no intersections among spheres occurs, for that reason is a necessary condition that Equation 7:
 (7)
(7)
2.6.2. Max-min algorithm.
The aim of max-min algorithm is to find, into the set of data X, the k elements that are further away from each other, improving the number of necessary groups to classify the classes and the convergence value (Tzortzis. G & Likas. A, 2014). This algorithm starts with a random data point of X as the first center and the rest of them are chosen following a strategy, in which selected element in the i-th iteration is the element that is the further one among the i-1 chosen elements. Then, the first center  is chosen randomly from X, and the second center
  is the data point which presents the maximum distance between and remaining points {
 -
- }. Since these centers, the rest of them can be obtained using the máx-mín criterion, as Equation 8.
 (8)
(8)
Where ‖.‖ represents the Euclidian norm.
2.7. Segment clustering
Further decreasing of computational load can be reached if sectioning the whole input data into segments for localized processing. An intuitive way to carry out this kind of analysis consist of dividing into Ns subsets, called segments, and later applying a clustering procedure for each segment (Rodríguez-Sotelo. J, et al., 2015).. Segmented data set is denoted by  where
where  is a
is a  matrix corresponding to the i-th segment Equation 9:
 ,
(9)
,
(9)
 represents the entire nearest to its argument.
At the beginning, a proper length of segment to be clustered is estimated. Selection of proper number of localized clustering segments is constrained by following restrictions: twice of number of features must exceed the amount of observations per segment, Equation 10:
 (10)
(10)
The union of groups of intuitive way is made, that is joining the set of a segment with the set of the following segment to go over the total quantity of segments.
2.8. Quality measures
This work takes advantage of the fact that studied database is labeled and supervised measures are accomplished. Thus, performance outcomes can be contrasted with another similar works. In particular, each assembled cluster can be split into two classes: one holding the majority heartbeats regarding to the class of interest (MC), and another having the minority beatings being of different classes (OC). Therefore, the following quantitative measures are defined:
True Positive (TP), heartbeats MC classified correctly.
True negative (TN), heartbeats OC, classified correctly.
False positive (FP), heartbeats OC classified as MC.
False negative (FN), heartbeats MC classified as OC.
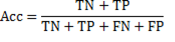
After computing the above described measures, the following values of sensitivity (Se), specificity (Sp), and clustering performance (Acc) are estimated as Equations 11, 12 and 13.
 (11)
(11)
 (12)
(12)
 (13)
(13)
The sensibility and specificity quantify the proportion of beatings from OC and the MC that are correctly classified, respectively.
3. Results
Regarding results, in Figures 2, 3 and 4 we could realize that the performance measures vary regarding different values, particularly, experiments with k=5, 8, 10, 12 are performed. Figure 2 shows the obtained results using k-means with random initialization, the figure 3 shows the obtained results using k-means with j-means initialization and the figure 4 shows the results obtained using k-means with max-min initialization.
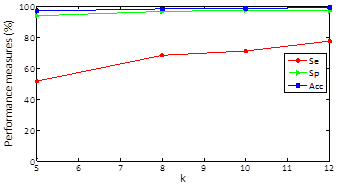
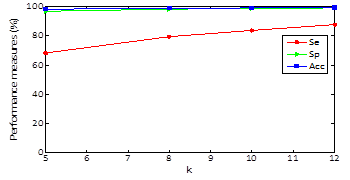
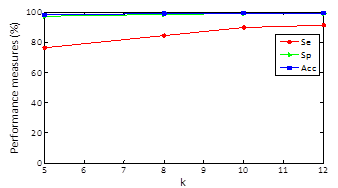
Clustering results for specificity and accuracy are maintained almost constant as k varying and the sensitivity grows as k increases. For random initialization with k=5, sensitivity has an approximate value of 51% and when k increases to 12 markedly improves obtaining an approximate value of sensitivity of 76% .For k-means and J -means initialization with k=5, a sensitivity value of 68% is obtained and setting k=12 sensitivity up to a value of 87% and finally for k-means and max-min initialization with k=5, a sensitivity value of 76% is obtained and setting k = 12 sensitivity up to a value of 91%. In other words, the max-min initialization is the one with the best results in performance measures which improve with increasing k.
The quantity of heartbeats and the performance measures for each type of arrhythmias are shown in the tables 2, 3 and 4. The results presented in the tables are obtained with a k equal to 12, because this presents the best performance. Only some records are included in the tables, but the averages presented for each type of arrhythmias and the total average are the obtained on all the records. It is important to quote that accuracy value is not given for arrhythmia type, the value is given for each record. The records 114 and 202 are included because they contain all types of arrhythmias, this last record has a total of 2142 heartbeats and 117 features, with the feature selection, the features are reduced to 10.
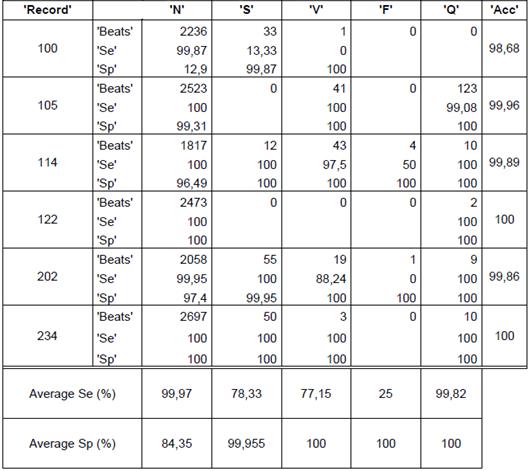
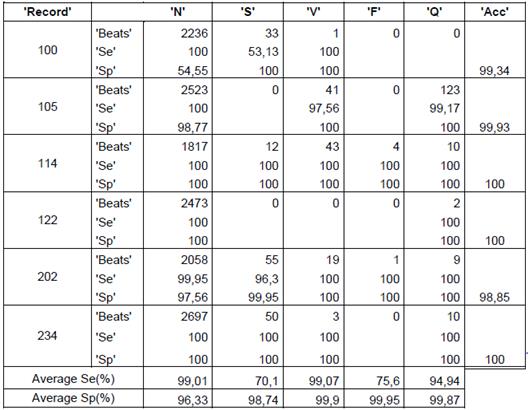
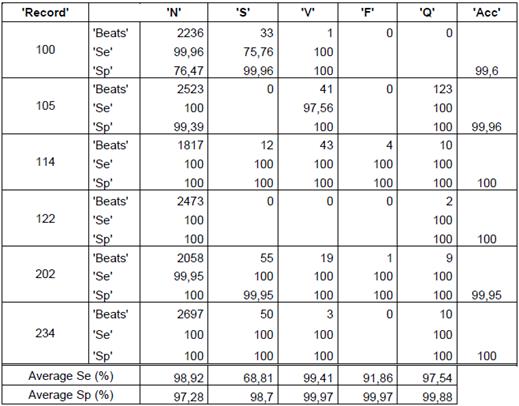
The obtained average in all the records of the data base for random initialization (table 1) is 76,05%, 96,86% y 99,73% for sensibility, specificity and accuracy, respectively. In the case of j-means initialization (table 2) the clustering results are 87,74 %, 98,96 % and 99,01 % for sensibility, specificity and accuracy, respectively. Finally, with the max-min intialization the best results are obtained, as they are 91,31 %, 99,16 % and 99,36 % for sensibility, specificity and accuracy, respectively.
Bearing in mind the presented results in the tables, to use the max-min initialization allow to obtain better performance measures if we use another type of initialization, can be confirmed.
It can also be concluded that the presented average of the performance measures for the heartbeats of type F had more variation, they presented a low performance measures with the random initialization, which increase notoriously with j-means initialization and furthermore with max-min initialization.
The record 202 had 1 heartbeat type F that was not correctly identified with the random initialization but with the max-min initialization and j-means initialization, a sensibility of 100 % was obtained.
4. Discussion
Rodriguez, Gallego, Mora, Orozco and Bustamante (Rodriguez. C. A, et al., 2014), obtained results with k-means of 97,41% and 92,94% for specificity and sensibility, respectively, although sensibility is higher than the obtained with the methodology used in this work , it is pertinent to explain that the mentioned work takes into account only the ventricular contraction heartbeats.
Juie D. Peshave and Rajveer Shastri (Peshave. J. D & Shastri.R, 2014), obtain similar results with the 85 % for sensibility when clustering 3 different types of arrhythmias using Thresholding's method.
N.Jannah and S. Hadjiloucas (Jannah. N & S. Hadjiloucas. S, 2014) use supervised classifiers as the Support Vector Machine (MSVM) and Complex Support Vector Machine (CSVM) and obtain results in terms of 94 % for accuracy, thus the supervised methods result be also useful in the process of arrhythmias identification.
Using unsupervised methods and especially k-means allow to achieve good results. But unlike from other works, in this paper, the segment-bases approach for clustering, the centroid initialization and the feature selection together are used, contributing to the detection of minority classes, reduction of the computational cost and convergence of the k-means algorithm, with the aim to realize a better heartbeat clustering and facilitate the cardiologist gives a diagnosis of a pathology checking 2 or 3 prototype heartbeats of a group and give to the patients trustworthy and timely results of the medical exams , with the aim that the patients get an adequate treatment. The main contributions of this work are the segment-bases approach for clustering, the feature selection and the centroid initialization.
5. Conclusions and Recommendations
In this paper, a whole clustering system for grouping heartbeats from ambulatory ECG signals is presented. The clustering scheme is performed within a segment-based approach, which improves the detection of minority-class arrhythmias. Throughout this paper, the sensitivity of clusters number is evaluated as well as demonstrate the benefit of the center initialization on the clustering performance.
Performance measures as specificity and the percentage of classification do not present enough variability of a method to another one to difference from the sensibility, that is to say, the measure that enables to establish a comparison between methods. This is due to that there are records in which minority classes are shown, it does that the detection of the pathological heartbeats be more difficult.
Exploring with others techniques of unsupervised analysis that allow improving the arrhythmias detection in Holter records is advisable and also the time of processed will decrease.
As future study, besides exploring others unsupervised methods, others data bases of patients with arrhythmias could be studied.

