


 English (pdf)
 Article in xml format
 Article references
 Send this article by e-mail
 Cited by SciELO
  Similars in
SciELO
Similars in
SciELO 
 Permalink
INTRODUCTION
In the process of discovering knowledge, data mining serves as the foundation for extracting valuable insights from data. This is accomplished through a variety of methods, techniques, and algorithms falling under the categories of classification, regression, clustering (Fayyad & Piatetsky-Shapiro, 1996), and summarization (Fayyad, Piatetsky-Shapiro, & Smyth, 1996). Tax administrations have also leveraged data mining to analyze historical information and extract knowledge (Ordóñez & Hallo, 2019; Rad & Shahbahrami, 2016; Gonzáles & Velásquez, 2013).
Evasion is one of the risks identified in the debt management process of tax administration; therefore, the process seeks to recover the debts calculated based on the declarations or based on legal evidence. Debt recovery is a critical aspect of tax administration that involves the identification and mitigation of risks such as evasion. Recovering debts can generate costs due to the need for bank collection systems, databases, and computer programs. The cost of managing owed values is generally lower in the early stages of collection than in later stages (Alink, 2000). Tax administrations are also striving for greater efficiency in their debt management processes to improve office performance (Huang, Yu, Hwang, Wei, & Chen, 2017). Utilizing information technology such as data mining can contribute to this goal by providing evidence-based data for business analysis and decision-making (Seddon, Constantinidis, & Tamm, 2016). In this context, tax authorities have attempted to analyze the risk of non-payment, but thus far have been unable to predict high-risk debtor taxpayers with uncollectible debt (Wu, Ou, Lin, Chang, & Yen, 2012). Additionally, a literature review does not identify any relevant studies that can predict tax debtors with a high risk of default in the coming years at an appropriate time (Ordóñez & Hallo, 2019).
The aim of this study is to carry out a data mining framework to detect atypical behaviors of tax debtors with a high risk of non-payment in tax administrations. This study will assist information professionals and knowledge engineers in identifying atypical debtor taxpayers, enabling them to build models that predict which debtor taxpayers are likely to default on their payments. The data mining process and developed models may also be applicable in departments related to debt management, or those that assess non-payment risk in tax administrations.
The proposed data mining framework is based on an adapted version of the Cross Industry Standard Process for Data Mining (CRISP-DM) methodology (Chapman, et al., 2000).
The primary outcome of this study was the identification of normal and anomalous behavior (outliers) groups among tax debtors. A clustering algorithm was employed for this task. The presence of a cause-and-effect relationship in the identified outlier events rendered them events of interest, which is a desirable characteristic for determining whether they require further investigation for decision-making model development. Conversely, when outliers lack this cause-and-effect relationship, they may be removed from the analysis database, and further analysis may be disregarded (Senator, Goldberg & Memory, 2013).
To demonstrate the proof of concept, this study utilized data from the payment management department of the Internal Revenue Service of Ecuador.
This paper is structured as follows: Section 2 outlines background information on tax administration and outlier detection; Section 3 presents the proposed data mining framework; Section 4 describes the results of the framework's implementation; and, finally, Section 5 summarizes the conclusions and future work.
BACKGROUND
This section provides information on tax administration, outlier detection, and related work using machine learning techniques.
Tax Administration
Tax administrations have several primary functions, such as processing statements, determining taxes, controlling the application of tax and non-fiscal legislation, conducting inspections, managing debt, and providing services and communication. The risk of taxpayers evading their taxes is present in these functions, and the administration has limited resources to control the process (Ordóñez & Hallo, 2019; Alink, 2000). The tax administration has two objectives:
To provide services that meet the needs of taxpayers.
To investigate and control only high-risk taxpayers.
One identified risk is in the debt management process, which supports the collection of primary function and aims to recover values based on taxpayer declarations or legal evidence. Additionally, the debt management process records all financial transactions with taxpayers, providing a source of historical information to extract knowledge using analytic techniques. Finally, the process takes action to manage the recovery of values when taxpayers refuse to pay voluntarily (Alink, 2000).
Outlier Detection
Outliers are observations that significantly deviate from the norm. Methods are used to model normal data, but deviations from the norm are considered as outliers (Aggarwal, 2017). Data that includes outlier observations have large gaps between outliers and inliers (Hawkins, 1980).
Outlier analysis allows for the interpretation of results (Aggarwal, 2017), and a relationship between the condition and effect pair can be identified in outlier data. Furthermore, when the condition-effect is explained, outlier data can be transformed into events of interest (Senator, Goldberg, & Memory, 2013).
The dataset has the following characteristics:
Data set is not labeled.
Some attributes in the dataset are correlated. For example, business taxpayers have higher incomes and generate higher taxes. These types of attributes are called covariates.
The dataset also includes attributes such as payment time and the amount of the fine that are not correlated.
The statistical distribution of the dataset is unknown.
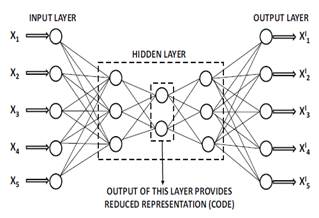
Given the features of the dataset in the debt management process, a method that reduces the number of variables and evaluates reconstruction error was chosen. The method is named a replicator or autoencoder because in the first step the data set is encoded using a function φ and the second part of the data set is decoded to the data by the function ψ (Hawkins, He, Williams, & Baxter, 2002). Function parameters are estimated using a neural network, and their architecture needs to be determined.
Outlier Analysis
The aim of outlier analysis is to convert atypical events into events of interest. This conversion helps to identify cause-effect relationships in anomalous data and to detect behavior patterns that are relevant to the application domain (Senator, Goldberg, & Memory, 2013). This process can be divided into three steps:
Identify outliers using techniques that suit the domain problem (Mandhare & Idate, 2017; Aggarwal, 2017; Souiden, Omri, & Brahmi, 2022; Domingues, Filippone, & Michiar, 2018).
Detect events of interest in outliers using methods that explain the findings (Senator, Goldberg, & Memory, 2013; Mokoena, Celik, & Marivate , 2022; Herskind Sejr & Schneider-Kamp, 2021).
Filter or remove outliers without patterns that are relevant to the problem domain. Additionally, there are algorithms sensitive to noise and outliers (Senator, Goldberg, & Memory, 2013; Yang, Rahardja, & Fränti, 2021; Chen, Wang, Hu, & Zheng, 2020; Ramos, Watanabe, Traina, & Traina, 2018)
In this paper, the normal and unusual behaviors (outliers) of indebted taxpayers are analyzed and the results are interpreted to discover events of interest for the tax administration domain using a machine learning approach. The patterns of outlier data are explained using natural language labels to determine which outlier data correspond to an event of interest. In another related study, outliers with no event of interest for the problem domain are filtered out (Ordóñez, Hallo, & Luján-Mora, 2020).
DATA MINING FRAMEWORK
This section presents a data mining framework proposed to detect outliers, adapted from the CRISP-DM methodology (Chapman et al., 2000). The framework employs five phases for conducting a data mining project, which are iteratively performed. These phases include business domain understanding, data understanding, data preparation, modeling, and evaluation. The models are developed using the Python programming language.
Business Domain Understanding
The first phase of the data mining process focuses on the business perspective, during which the following steps are taken:
Identification of the types of transactions involved in the debt management process in the tax administration.
Definition of the payment time range and analysis of the statements of the debt management process.
Identification of the data sources of debt management process information.
Data Understanding
The second phase involves the analysis of raw data to become familiar with it and to resolve quality problems in the raw data. The following steps are taken:
Description of the type of attributes available in the data sources.
Identification of the attributes that characterize the debt management.
Data preparation
This section involves all the activities necessary to prepare the final dataset. To achieve this objective, the following steps are proposed:
Define interest attributes.
Eliminate the transactions with quality problems.
Modeling
In this phase, a deep learning approach is used to create the clustering model. Thus, the following steps are carried out to identify data with normal and unusual behavior using an unsupervised approach.
Definition of the architecture of the neural network to detect the outliers.
Selection of the technique to create the clusters of outliers.
Division of data to create, evaluate and test the models.
Tuning of hyper-parameters using training and validation data.
Evaluation of the performance of the learning process considering the error of reconstruction.
Evaluation
In this phase, the resulting groups are analyzed using the following steps:
Division of outliers into groups with similar characteristics by determining the cluster number after applying the model step.
Evaluation of the quality of the outlier clusters.
Identification of the interest events according to concerns of tax administration.
RESULTS
In this section, the results of the data mining framework are presented.
4.1 Business Understanding
The debt management database in the tax administration of the study case consists of three types of transactions:
Self-determined statements: Taxpayers determine the values of tax to pay.
Determined statements: Tax administration determines the values owed by a taxpayer using administrative records.
Suspended statements: Statements that are in an appellate court and await a court ruling.
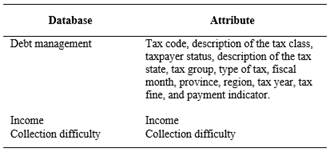
To characterize the debts in the tax administration according to domain expert's criteria, attributes from three additional databases were added to the raw dataset. These databases include:
Income: Database with assets, liabilities and income of taxpayers.
Difficulty to collect: Database with taxpayers that are difficult to collect tax.
Remission: Database with debts that have been paid in stages where the tax administration has forgiven fines and interest. This is an unwanted behavior, but it allows to obtain money from old debts.
Taxpayers were grouped in two types: a) large economic groups that produce the highest collection amounts and, b) small taxpayers such as natural persons, small businesses, and so on. The tax administration defines which taxpayers belong to each group every year.
4.2 Data Understanding
Raw data was collected from four databases. The main variables are presented in Table 1.
4.3 Data Preparation
In this step correlated data were reduced. Redundant attributes were eliminated and the values outside the possible range and null values were reviewed to eliminate invalid transactions. The number of days before payment was calculated for each transaction. The type of taxes was aggregated in 4 categories (direct, indirect, fines and others). The number of transactions of debt management analyzed for the debts of the self-determined statements was 2.1E+06 of which 1.9E+06 debts were paid and 1.2E+05 were not paid.
4.4 Modeling
The dataset was analyzed to obtain data with normal and unusual behavior. An atypical data is considered outlier; however, they could have events of interest. The events of interest were found using associated rules over the groups detected.
The outliers were found using a method that reduces the number of variables and evaluates the reconstruction error considering the features of dataset in debt management process. The method is named a replicator or auto-encoder because in the first step the dataset is encoded using a function φ and the second step of the dataset is decoded to the data by the function ψ (Hawkins, He, Williams, & Baxter, 2002). Function parameters are estimated using neural network and their architecture is shown in Figure 1.
The objective of training process is to minimize the aggregate error of reconstruction (Aggarwal, 2017). The error of reconstruction is evaluated using Equation (1).

where
m: input dimensions
The library pyod.models.auto_encoder of python 3.6 was used to obtain data with normal and unusual behavior. The parameters used were:
hidden_neurons=[8, 2, 8]
random_state=10
epochs=15
batch_size=128
contamination=0.1
validation_size=0.3
hidden_activation: relu function
l2_regularizer= 0.1
The analysis produced the following results:
2.1E+05 records with outlier behavior.
1.8E+06 records with normal behavior.
The type of data found in the debt management process is shown in the Figure 2.
4.5 Evaluation
The data acquired during the modeling phase, comprising both normal and atypical behavior, underwent scrutiny for events of interest for tax administration. These events were classified as transactions with outstanding features, which are elaborated upon in subsequent sections.
Groups of outliers with similar characteristics
The condition-effect relationship identified in the outlier data was employed to interpret the results (Aggarwal, 2017). This allowed us to transform outlier data into events of interest (Senator, Goldberg, & Memory, 2013).
Number of clusters in outlier data
Clustering is the process of grouping data with high similarity to define finite sets of data categories (Fayyad & Piatetsky-Shapiro, 1996), thus enabling analysis of groups with similar patterns or characteristics.
The k-means technique is a commonly used distance-based clustering method. The technique is one of the most used methods to optimize K-means algorithm (Umargono, Suseno, & Gunawan, 2020; Shi et al., 2021). The elbow method determines the number of clusters that provides the most information by plotting the sum of the squared distances between each point and the centroid in a cluster. The point at which the metric drops suddenly guides the selection of the best-fitting model (Han, Kamber, & Pei, 2012).
The skkearn.cluster.KMeans python library was employed to implement the k-means technique and elbow method. The following parameters were configured:
Number of cluster k: 1 to 10.
Cost for every k group: Sum of squared distances. Figure 3 shows the sum of squared distances for k=1 to 10 using k-means technique.
The rest of the parameters of skkearn.cluster.KMeans were used in their default value.
The Figure 3 also shows two elbow point when k = 2 and k = 3 added more information as a number of cluster than the other values of k, therefore the quality of the cluster have to be evaluated.
Quality of the outlier clusters
Cluster quality assesses the efficacy of a cluster in terms of the cluster separation and cohesion of each group. Cluster quality evaluation can be accomplished using supervised or unsupervised methods. The Silhouette coefficient, an intra-cluster metric, is an unsupervised method that evaluates the quality of a cluster, with its value ranging from -1 to 1, where 1 represents the best value (Han, Kamber, & Pei, 2012). The Silhouette coefficient have been used to assess the quality of k-means clusters because this coefficient has the advantage that does not need a training set to evaluate the cluster (Thinsungnoen, Kaoungku, Durongdumronchai, Kerdprasop, & Kerdprasop, 2015; Shutaywi & Kachouie, 2021). To compute the Silhouette coefficient, the Silhouette_score from the Python tool sklearn was used. The values obtained are presented in Table 2.
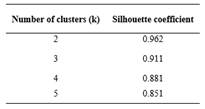
According to Figure 3 and Table 2, when the number of cluster k=2, the quality cluster is the best. Therefore, the outlier data was divided in:
Group 0: 2.09E+05 records.
Group 1: 1.2E+03 records.
Identify the interest events
After identifying the groups, patterns in each group were analyzed to determine the events of interest from the outliers. The process of extracting knowledge from the database utilizes data mining tasks. One of the data mining rules is association rules, which enables analysts to interact easily with data and mining results (Hipp, Güntzer, & Nakhaeizadeh, 2002).
Format data to apply association rules
Before applying association rules to discover the most important relationships between variables, each characteristic of the dataset was mapped into binned categories or cut points. The optimal cut point technique based on the entropy metric was used. This technique divides continuous values into multiple intervals (Fayyad & Irani, 1993) and is regarded as one of the most important methods for discretization (Grzymala-Busse & Mroczek, 2016).
Moreover, the binned categories were transformed into labels using natural language, which enables analysts in tax administration to read the results more efficiently. For instance, if variable "debt" had three cut points, the labels were described as follows:
Label 1: Debts paid in less than x days.
Label 2: Debts paid between x to y days.
Label 3: Debts paid between z days and over.
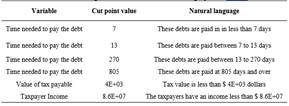
Table 3 shows the cut points in outlier data showing the number of categories to analyze in each variable.
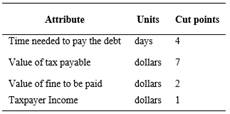
Table 4 shows some examples of cut points applied in variables of dataset. For instance, the cut points for the time needed to pay the debt were 7, 13, 270 and 805.
Association rules technique for discovering patterns
Next, associate rules were applied to find patterns that characterize outlier dataset for two groups of data such as the payment frequency. Table 5 shows the outstanding patterns identified for the first group which was named group 0.
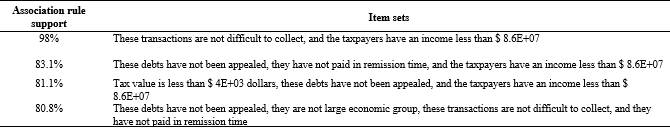
According to the domain expert, group 0 of outliers contains events of interest that were identified using data mining. Payment analysis reveals that the majority of payments are made before day 270, after which the number of payments made by taxpayers decreases significantly. However, most unpaid debts exceed the 270-day default threshold. Figure 4 shows the frequency of payments using cut points. On the other hand, group 1 of the outlier dataset does not contain any events of interest, as indicated by the domain expert, and thus will not be presented.
Data with normal behavior analysis
After identifying and isolating the outlier data, the data with normal behavior was obtained. This data was divided into similar groups using the k-means technique to identify patterns. To determine the number of clusters, the elbow method and intra-cluster metric were used. Association rules were then applied to understand the behavior of these groups.
Number of clusters in data with normal behavior
As per the outlier analysis, there were 1.8E+06 records with normal behavior. Similar to the outlier data, the k-means technique and elbow method were used to select the optimal number of clusters for the normal data. Figure 5 displays the outcome of the elbow method, which utilized the skkearn.cluster.KMeans Python library. Two groups were chosen since the larger intra-cluster value was obtained with k=2. The silhouette score for the intra-cluster value was 0.854.
The data with normal behavior was divided in:
Group 0: 9.5E+04 records.
Group 1: 1.7E+06 records.
The records not paid in the first were 1%, and two percent of the records not paid in group second group were identified. The frequency for payment is shown in Figure 6. Most debts are paid up to 85 days.
The results were communicated to the authorities of tax administration section who could use it to develop strategies to get the payment. Additionally, these results have been used to select data pre-processed as input of models to predict debts with high risk of non-payment in tax administration in short periods of time (Ordóñez, Hallo, & Luján-Mora, 2020).
CONCLUSION
With the data mining framework and with the data of the tax administration of Ecuador, a model to find atypical comportment groups of taxpayer’s debtors with high risk of non-payment was developed using machine learning techniques. Given the conditions of the dataset, a technique was applied to find the unusual and normal behaviors of debts. The result of this analysis determined two groups with unusual behavior. Two groups with normal behavior were also identified.
With the time estimated by the models on the outlier group, tax administrations can determine the debts that belong to uncollectible debt. For example, for group 0 with unusual behavior (Figure 4), until day 270 debts are mostly canceled. From that threshold the probability of no payment begins to rise. The patterns of this data were also found using associated rules to find event of interest (Table 5). With the knowledge generated, tax administrations can make decisions regarding communication for the collection of obligations, guidelines to grant payment facilities, select records that need to be audited, among others. Additionally, tax administrations could use the results to select data as input for other models in future works.