Inglés (pdf)
 Articulo en XML
 Referencias del artículo
 Enviar articulo por email
 Citado por SciELO
  Similares en
SciELO
Similares en
SciELO 
 Permalink
1. INTRODUCTION
Cotopaxi is a stratovolcano located in the Real (eastern) Cordillera in the Ecuadorian Andes. Its summit reaches 5897 m above sea level, and is covered with a glacier cap that can be melted by pyroclastic flows produced during eruptions. Cotopaxi has developed five eruptive cycles in the years 1532-1534, 1742-1744, 1766-1768, 1853-1854 and 1877-1880. During these cycles there have been approximately thirteen major eruptions with the following volcanic phenomena: ash falls, lava, pyroclastic flows and mud flows with debris or lahars that caused one of the greatest destructions in the country (Andrade et al., 2005).
Lahars are the volcanic phenomena that are the subject of our study. These are a mixture of rocks, pumice and sand with water coming from the melting of a glacier, from the rupture of a crater lake or from heavy rains. Lahars travel at high speeds reaching 100 km/h and move downhill driven by the force of gravity following natural drainages. Lahars are the most dangerous phenomena that can occur during an eruption of the Cotopaxi Volcano. People trapped in lahars have very little chance of survival, therefore, during a volcanic crisis, evacuation of populated areas near the dangerous drains that flow down the volcano is carried out.
Lahars have been a very common phenomena, so according to historic records, the following information has been collected: in November 1744 there were pyroclastic flows that melted parts of the volcano glacier and caused lahars in the Latacunga and Los Chillos valleys, these were larger than those of 1742. In September 1853, there was an important increase in the volcano activity that produced destructive lahars in the Cutuchi River. On June 26, 1877, lahars occurred in the Pita, Cutuchi and Tamboyacu rivers causing great destruction along these three drainages (Andrade et al., 2005).
On August 14, 2015, after four months of premonitory signals, two small explosions occurred in the Cotopaxi Volcano, the first at 04h02 and the second at 04h07 (Hidalgo et al., 2018). With this visible change in the external activity of Cotopaxi, the population near the volcano was compromised by the risks and threats to which it is exposed. The Cotopaxi volcano has demonstrated, throughout its geological history, to be one of the most dangerous volcanoes in Ecuador because of the impacts on nearby populations caused by lahars in past eruptions (Saalfeld et al., 2019).
The Instituto Geofísico (IG) of Escuela Politécnica Nacional, in collaboration with other institutions, has conducted extensive research to understand and disseminate the possible consequences of future lahars. Since 1999, the Instituto Geofísico has implemented the use of detectors known as AFM (Acoustic Flow Monitor) for monitoring and surveillance of lahars (Andrade et al., 2005).
To date, the seismic activity of Cotopaxi volcano has shown important changes. With this background, we present the application of a seismic array in linear configuration to detect and characterize lahar flows generated as a consequence of an eruptive process in the Cotopaxi volcano. The methodology described here, when included in the monitoring process, provides an effective tool to decrease the time-to-react for the communities living in the edges of the streams where the lahars normally transit.
The electronic equipment developed in this project can be used not only in sensor arrays but also in broadband, monitoring devices, infrasound and others, at a much lower cost than similar equipment available in the market (Asch, n.d). The cost of similar equipment is eight to ten times higher than the one presented here, making it an affordable solution to be implemented in observatories with limited budget. Therefore, this technology provides a gain in time to alert the communities located on the banks of the volcano streams. This time translates into an early warning that helps to protect many lives in a volcanic crisis.
2. METHODOLOGY
The present work is a quantitative experimental research, in which the main variable was the apparent speed of the seismic waves when they cross the surface of a sensor array composed of geophones applied to the study of the lahars in the Cotopaxi Volcano.
Embedded system design
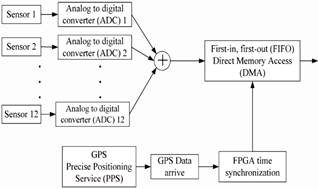
During the first stage of research, a prototype for the digitization and storage of twelve channels of seismic signals based on a new generation Field-Programmable Gate Array (FPGA) was developed as a measurement instrument for the variable under study. The block diagram is shown in Figure 1.
The designed and built instrument stores the seismic data recorded by geophones when seismic events occur in a reliable, valid and quantifiable way, without affecting the real data (Asch, n.d; Paz et al., 2019).
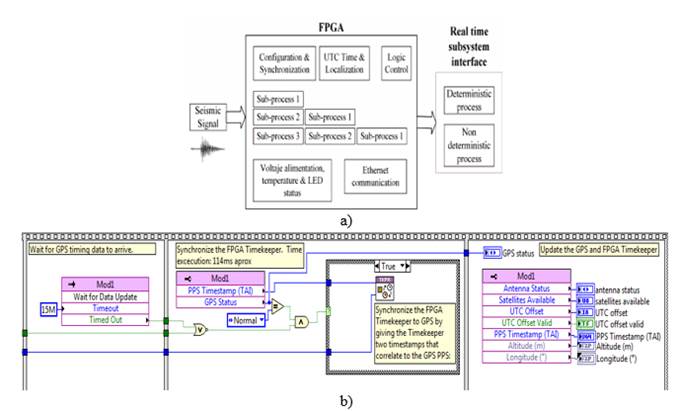
In the FPGA, simultaneous programming threads control the twelve acquisition channels and their synchronization with Coordinated Universal Time (UTC) with an accuracy of 100 ns. As show in Figure 2.
Source: authors' own elaboration
Figure 2. Threads control of twelve acquisition channels and synchronization with UTC.
The main thread of deterministic execution and high-speed control uses the pipelining technique to increase performance and take advantage of the parallel processing capabilities of the FPGA (Wei et al., 2016). First, the analog-to-digital converter (ADC) sampling rate is set, this can vary up to 50 ksps. Subsequently, the FPGA is synchronized with the Real Time Subsystem, the overall control, so that there are no gaps in sample acquisition. Next, the samples enter the pipelined loop, which has three internal intercommunicated sub-processes. In this loop, the main thread gets the conditioned signals from the sensors converted into a 24-bit digital signal.
The second sub-process writes to independent First-in, first-out memory (FIFO memory) for each channel through Direct Memory Access (DMA). The third sub-process measures, in clock ticks, the time required for the longest path of the three processes which is given by the ADC sampling rate and the FIFO memory fill alarm (Herrera, 2017). The result is a loop with a speed of approximately 800 clock ticks, i.e. it complies with the ADC sampling rate of 50 𝑘𝑠𝑝𝑠.
The Trimble Global Positioning System (GPS), model 66800-40 D, is used to synchronize in UTC time and determine the location of the station. In this case, the FPGA internal loop takes a new reading every second with a maximum offset of 100 ns and records the offset value for time error correction. The information is transferred to the real-time subsystem through a FIFO memory.
Finally, low priority processes are executed, such as: reading the voltage in the power supply system, reading the ambient temperature and flashing the led indicating the correct operation of the equipment. Figure 3a shows a summary of the processes described above developed inside the FPGA, as well as the inputs necessary for their correct operation and the outputs obtained in real time. Figure 3b shows a part of the diagram design internal FPGA in LabView software.
Design of geometric configuration
In the second phase, several field trips were conducted first to search for suitable sites with uncomplicated access to monitor the streams of the Pita, Cutuchi and Barracas rivers, which are hydrologic features of interest in this current research work, see Figure 4. Finally, the prototype was installed at a recent lahar flow site of the Pucahuayco stream in the Cotopaxi Volcano, called Nasa.
As a strategy to choose the best spatial geometric configuration to be used during the present investigation, the GPMC software was used to perform the analysis using the beamforming estimated direction method. Subsequently, the equipment was installed on the banks of this stream in a linear configuration, ten sensors trying to form a straight line and two sensors on the central axis.
Once the data obtained by the sensor array was stored and collected, a mathematical model was developed using a cross-correlation matrix and the determination of the slowness vector with a program developed on the Matlab platform.
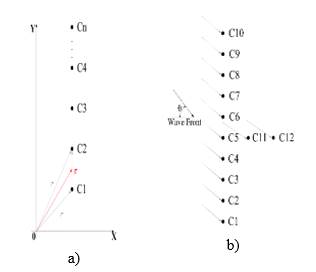
An array of sensors with a common time base records wave fronts that arrive simultaneously in different directions. It is common for these arrays to be circular in shape to achieve better azimuthal coverage, in our case a linear array we used.
Surface waves are dispersive in a heterogeneous medium, which is formed by layers of different materials. The phenomenon of dispersion means that each frequency forming the wave front travels at a different speed. Figure 4 shows the streams through which lahars would be produced in case of an eruption of Cotopaxi volcano.
3. MATHEMATICAL MODEL
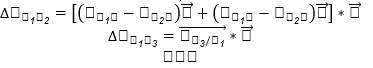
A linear array was chosen for better shaping of the wave front beam reaching the sensors. The array is formed as follows: ten sensors on the straight line parallel to the flow circulation and two in perpendicular line which forming the vector precision triangles in order to find the correlation results. The methodology for setting up the model is as follows:
One interpretation of this vector would be the slowness with which the wave front generated by a seismic event arrives to the sensors array. By definition, this vector is in (1):
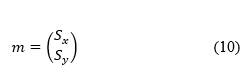
From Figure 5 a) the vector 𝑆 is obtained as (2):
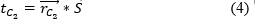
And we also define (3) and (4):

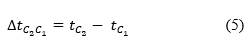
The time difference between 𝐶 1 and 𝐶 2 is (5):
Replacing (3) and (4) in (5):
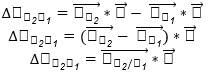
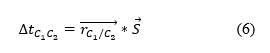
For an array 𝐶 1 , 𝐶 2 … 𝐶 12 , taking as reference 𝐶 1 , we have (6):
If 𝑡𝑎𝑛𝜃= 𝑆 𝑦 𝑆 𝑥 where 𝜃 is show in Figure 5 b)
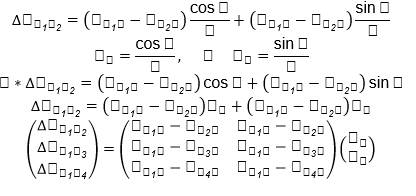
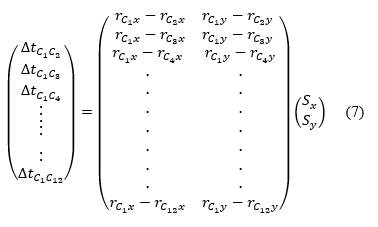
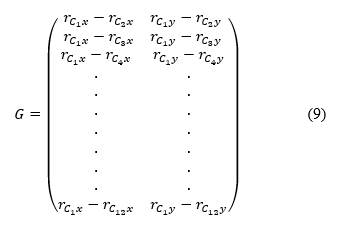
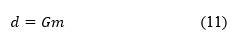
Where the matrix containing the vector 𝑟 corresponds to the cross-correlation matrix. For twelve stations, we have the following set of matrices (7) and (8):
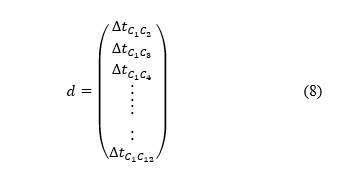
And 𝑑 is the variation of the arrival time to each station (11):
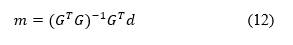
This model is transferred to Matlab software to process the data and find the apparent velocity of the wave front through the array by computing the vector 𝑆 (𝑚).
4. RESULTS
We have obtained a robust and reliable interface, similar to the interfaces of commercial equipment developed by international manufacturers. The interface is user friendly and easy to use. It receives and visualizes the monitored signals.
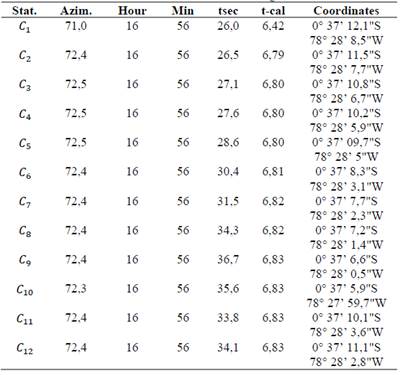
Table 1 shows collected and processed data obtained for an event generated in the volcano which simulates data that could be obtained in the case of a small lahar flow.
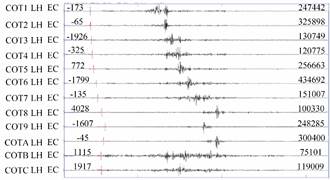
Figure 7 shows an example of an event in the Cotopaxi Volcano with a linear array where the arrivals of the seismic signals in the different sensors can be observed.
Table 2 shows the results obtained after applying the correlation model based on the Matlab software.
We have analyzed the data obtained by seismic sensor lineal to choose the processing algorithm with the less computational time and the highest accuracy in detecting the channel through which the lahar transits and its estimated volume.
Figure 7 shows the distribution of the resultant energy according to color intensity in an array of sensors with linear configuration.
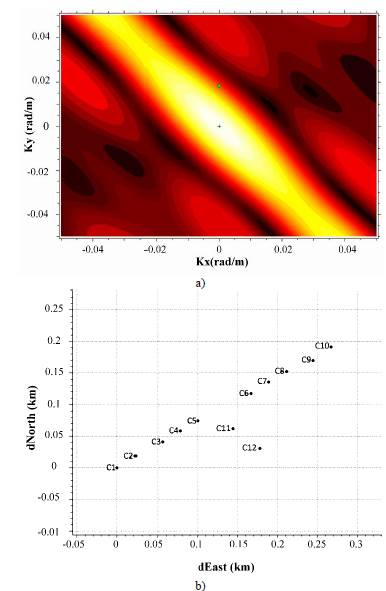
Figure 7 a) Distribution of the resultant energy. b) Concentration of the Slowness vector in an array of sensors with linear configuration.
Table 2 Results of the simulation in Matlab based on the mathematical physical model of cross-correlation
As we can see in Figure 8, a linear sensor array clearly provides a higher directivity. Therefore, it is the most suitable configuration for the study of flows in transit through a channel or the volcano streams.
5. CONCLUSIONS
A configurable 12-channel FPGA-based array was designed and built in order to detect the occurrence of lahars and their speed.
A user-friendly interface here developed allows to graphically view data from the sensors connected to the system with an automatic scaled to improve the visualization of events.
A 10 𝐻𝑧 sensor array was used in a linear configuration. In addition, the data acquisition system was linked to a mathematical model based on the cross-correlation matrix, this model is used to determine the speed of the flow wave front.
The array is adaptable and can be used in several configurations, namely circular, linear or pentagonal, in order to obtain different solutions according on the type of sensor used, the type of event studied, the distance to the source, etc.
The advantage of using the proposed array is the increased level of precision in the calculation of lahars and mud flows speed. This information could be useful for estimating the arrival times of large lahars to populated areas and improving emergency response operations.