


 Spanish (pdf)
 Article in xml format
 Article references
 Send this article by e-mail
 Cited by SciELO
  Similars in
SciELO
Similars in
SciELO 
 Permalink
1. INTRODUCTION
Gamma spectroscopy is an analytic technique that identifies isotopes through the gamma photons emitted by each radionuclide. This technique employs two types of radiation detectors: scintillators and semiconductors. One of the most employed semiconductor materials for radiation measurements is Hyper-Pure Germanium (HPGe) detector. This detector has a cylinder crystal inside in a vacuum-tight cryostat of HPGe (Turner, 2007). In the market, it is possible to find detectors with different configurations such as planar or coaxial. The size of the detector generally changes among the manufacturers and the aims of the studies (Demir et al., 2013; Marzocchi et al., 2010).
Additionally, the main difference between scintillation and semiconductor detector is the resolution, which is the capability of generating a well-defined peak based on the radiation emitted by an isotope. A way to measure the resolution in spectra is the peak full width at one-half of the maximum (FWHM), when FWHM is low it means high resolution in spectra. In this sense, semiconductor detectors are characterized by having a higher resolution than scintillators. In fact, a scintillation detector, the FWHM of NaI (Tl) detector is around 30-50 times greater than FWHM of HPGe detector (Perez-Andujar & Pibida, 2004). This feature of allow the discrimination between nearby peaks in the spectra. For this reason, semiconductor detectors have been used to identify samples with multi-emitter isotopes (Siegel, 2013). Identification of isotopes is not the only application of gamma spectroscopy; this technique is also used in several science fields. For instance, gamma spectroscopy is used to study and understand the hydrodynamics of the soils. These types of studies are conducted for the optimization of water resources (Baldoncini et al., 2019; Strati et al., 2018). Furthermore, gamma spectroscopy is employed to study the composition of planets and stars far beyond earth (Sanin et al., 2020). A more conventional application is the characterization of isotopes for neutron calibration sources, such as Cf-252, or to analyze radionuclide distribution in soils (Ahmed, 2020; Watson et al., 2021).
Gamma radiation emitted by radioactive isotopes enters the semiconductor detector and promotes electrons for the valence band to the conduction band. The number of electrons promoted is proportional to the energy of the radiation emitted. An electric field is applied to the semiconductor, so the electrons can be driven to the positive terminal and be counted. Each interaction generates one count, and it is called an impulse; it is possible to classify each impulse based on its height. Energy calibration is the procedure by which the intensity (or height) of the impulse is related to the energy of the radiation emitted (Del Sordo et al., 2009).
Not all the energy released by an atom reaches the detector, most of the radiation is lost since it is not inside the solid angle between the detector and the source. Efficiency calibration is the procedure that allows the estimation of the radiation lost because of this characteristic. In order to quantify the amount of an isotope present in a sample, both calibrations (energy and efficiency) must be performed for a specific detector (Abbas, 2010; Abbas et al., 2006; Martin & Burns, 1992).
Gamma spectroscopy calibrations are traditionally made with standard samples of a known activity and defined volume. This process is made to measure what fraction of radiation, of the total emitted by the isotope, is registered by the detector. This calibration is known as full energy peak efficiency (FEPE) calculations (Elekes et al., 2003). Nevertheless, this process is costly due to standards acquisition, and it can be challenging to find standards of irregular volumes. This problem can be solved with Monte-Carlo simulations (Vidmar, 2005). Monte-Carlo simulations are a way to solve radiation transport equations. The first application of a Monte-Carlo method was proposed by von Neumann in the Manhattan project (Benov, 2016) in order to calculate the critical mass of the atomic bomb. There are several software packages to perform Monte-Carlo simulations. Among the most important codes it can be mentioned: MCNP, TRIPOLI, FLUKA, and GEANT4 (Agostinelli et al., 2003; Battistoni et al., 2007; Kirk, 2010). It is worth mentioning that GEANT4 is an open code, free to download and use. GEANT4 code allows users to simulate a wide spectrum of particles. Regarding applications of GEANT4, it is used to perform FEPE calculations, estimate response of detectors facing sources at different geometries, or calculation of self-absorption correction factors (Guembou et al., 2018; Hurtado et al., 2004, 2007).
The objective of this work is to develop a GEANT4 application to estimate the full energy peak efficiency for a HPGe detector and their deviations of experimental measurements. This work aims to be a seed for future works which will develop more accurate applications, especially for irregular volumes.
2. MATERIALS AND METHODS
2.1 Experimental measurements
Gamma spectroscopy measurements were carried out with a Canberra Hyper Pure Germanium (HPGe) detector model BE2020 and a cryostat 2002CSL with serial 8639. The detector was plugged into a multichannel analyzer model LYNX to save information in 8190 channels. The radioactive sources employed were: Am-241, Eu-152, Cs-137, and Co-60. These sources were placed at 0, 5, 10, 20, and 25 cm from the top of the cover of the detector in a straight line.
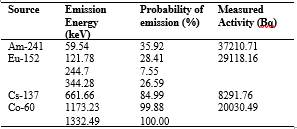
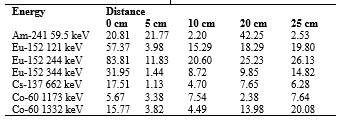
Registered results were analyzed in Python. A channel calibration was done to adjust all spectra in terms of energies. To perform such calibration, an isotope with well-known emission energy was used as a reference, and the channel at which the radiation was detected, was equated to the energy emitted. This allows for the transformation from a peak detected at a specific channel to a peak detected at a defined energy. The energies used for regression are detailed in Table 1, and they were obtained from similar works (Duc Tam et al., 2017).
Additionally, it was made a FEPE calibration of the HPGe detector. This process was made for each photo-peak detailed in Table 1. Equation 1 was used to calculate the FEPE. Efficiency calibrations were made to each data set of spectra at different distances.
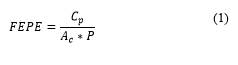
Where:
2.2 Simulation
The simulation was performed in GEANT4. Three basic classes were defined: detector construction, physics list, and primary generator. To extract useful information from the simulation, the following user action classes were also instantiated: Run Action, Event Action, and Stepping Action classes.
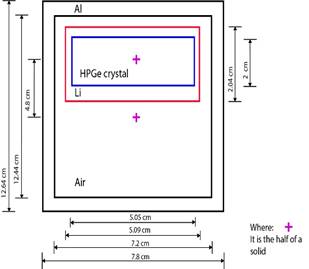
Through the detector construction class, the geometry shown in Figure 1 was implemented in the simulation. The following modular physics list were used for performing the simulation of the physical process: G4Radioactivedecay, G4DecayPhysics, and G4EmStandardPhysics. For implementing the radioactive source through a primary generator class, it was employed General Particle Source because it facilitates the generation of particles with macro commands. The simulations’ geometries were the same as experimental measurements. A radioactive source was placed at 0, 5, 10, 20, and 25 cm from the top of the cover of the detector. However, it is important to point out that several isotropic gamma sources for Am-241, Eu-152, and Cs-137 were simulated to emulate the multipeak generation of such isotopes. Am-241 was simulated through a 59.54 keV gamma isotropic source. Eu-152 was simulated through three different isotropic gamma sources of 121.78 keV 244.7 keV, and 344.28 keV. Cs-137 was simulated with a 662 keV gamma isotropic source. This was done because simulating all radioactive decay processes uses a lot of computation time. Only for Co-60, the whole radioactive decay process was simulated because it did not take a large amount of time.
User action classes were programmed to save energy deposited in each step. Energy deposition was done with Stepping Action class. Summing up all the energy deposition around an event was done in Event Action class. The events with zero energy deposition were ignored. Run action class was made to plot a ntuple with energy deposition and its counts.
The simulated spectra were scaled up to the activity of each radioactive source used in each experimental setup. This process was done because the Monte-Carlo simulation just estimate the response of the detector for a known number of particles, but there is no time relation whatsoever. Therefore, it was calculated how much time the real radioactive source would take to emit the same number of particles as the Monte-Carlo simulation. This process was done by dividing each spectrum bin to the activity correction factor. Activity correction is basically a pseudo time of measurement, and it was estimated through equation 2.
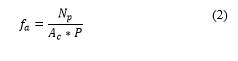
Where:
Simulated spectra with activity correction factor were transformed into simulated net count rate spectra. These rates were compared with the experimental net count rate spectra. Then, another correction factor was estimated, this was calculated through Equation 3. This correction factor was called the detection factor ( 𝑓 𝑐 ), and it measures how much the simulation diverts from experimental results. This process was carried out at the photo-peaks detailed in Table 1, for each set of spectra data for all distances. Scaling was performed by dividing each net count rate spectrum interval by the value in each energy of 𝑓 ?? .
Where:
Finally, the error was estimated between simulated net count rate spectra with detection correction factor and net count rate spectra. This process was done with Equation 4.
Where:
3. RESULTS
The energy calibration curve is shown in Figure 2. In this curve, the relation between energy and detection channel is established. The curve has a correlation factor (R2) of 0.99. It means that the model used in linear regression has a good fitting with experimental results (Shtatland et al., 2002).
Figure 3 shows FEPE for different energies at different distances. The FEPE curves are lower when distance increases, this is caused by variation of the solid angle as the source is placed farther from the detector This behavior of radiation detector had been studied by previous researchers (Krneta Nikolić et al., 2018; Smith & Kearfott, 2018).
Curves of Figure 3 were compared with similar data obtained by third-party experiments. We compare our measurements with those obtained by Ješkovský et al. (2019), Khan et al. (2018), and Aviv & Elia (2020). These results vary among them because HPGe crystals present different features that depend upon the manufacturer, the thick of the dead layer, and the crystal state. On one hand, the detectors employed by Ješkovský et al. (2019), and Khan et al. (2018), tend to have a behavior that increases the FEPE until a zone near to 100 keV. After this range of energy in those type of detectors, the FEPE curve tends to decrease with energy (Ješkovský et al., 2019; Khan et al., 2018). On the other hand, the detectors employed by Aviv & Elia (2020) the FEPE decreases while energy increases (Aviv & Elia, 2020). Analysis of figure 3 shows our values are different from Ješkovský et al. (2019), and Khan et al. (2018) but have similarities with Aviv & Elia. In fact, a plausible reason for that behavior is in the first works p-type HPGe detectors were used. These devices are cylinders with empty concentric cavities. Even though p-type HPGe crystal are chemically the same, they have a different geometry from the BE2020, the detector employed in our work. Conversely, the work made by Aviv & Elia (2020) employed the broad energy detector, like we do. This detector is a fully filled cylinder. However, in contrast with our equipment, Aviv & Elia's (2020) is bigger (8 cm), so the capability for detecting radiation is higher than ours.
Figure 4 shows the comparison among spectra. The blue solid line represents the simulated spectrum without any correction. The green dotted line is the simulated curve corrected with the activity factor, and the red dotted line is the experimental result. The spectrum without detection factor is several times greater than the experimental spectrum. One reason for this anomaly is that GEANT4 does not simulate the electronic chain of acquisition. It is also important to note the difference in how a spectrum is recorded in the simulation in comparison to the experimental result. Simulated spectra have a greater photopeak because for GEANT4 is enough for a particle to arrive at the detector and deposit its energy in order to consider it as an impulse. However, in experimental measurements, it is needed for a particle to arrive at the HPGe detector, which deposits enough energy for promoting an electron to a conduction band, and only then to count it as an impulse.
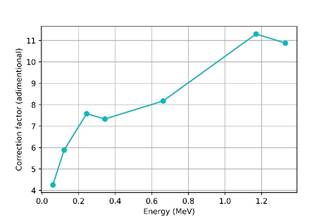
The variation of the detection factor with energy and distance was also studied. The correction factor value was averaged for the same energy value for different experimentation distances, to eliminate the influence of distance. After that, the mean detection factor for each energy was plotted and is shown in Figure 5. This mean detection factor was used to scale the simulated spectra with activity correction. When comparing the tendency between Figure 3 and Figure 5, it can be inferred that the correction factor is inversely proportional to full energy peak efficiency calibration. The minimum overestimation of GEANT4’s simulation is four times, and the greater overestimation is eleven times approximately.
Finally, it was measured the error between rescaled spectra with activity correction and detection correction. The errors are presented in Table 2.
It is important to mention that errors are higher for Eu-152 simulations. The reason for this difference could be that for the Eu-152 was simulated each photo-peak alone, but in real life, Eu-152 emits all these energies at once. Therefore, the detector saturates more easily for sources in the real experiment, especially when the isotope emits several different energies. Next simulations should be focused on multi-emitters radionuclides with all radioactive decay processes occurring simultaneously.
All files employed for data analyses are available in this repositoryhttps://github.com/sebassaras02/HPGe_data_rp_publication.git. Meanwhile, the GEANT4 application is available in this repository: https://github.com/sebassaras02/HPGe_G4_rp_publication.git.
4. CONCLUSIONS
The present work developed a GEANT4 simulation to estimate the response of the HPGe detector for gamma spectroscopy. Am-241, Eu-152, Cs-137, and Co-60 sources were simulated. Furthermore, it was scaling the spectra to activity measured, and then it was determined a detection factor, in order to estimate how much simulation diverts from experimental measurements. In addition to this work, our data was compared with third-party experiments, and it shows similar detector behavior. Finally, it was pointed out that errors are higher for Eu-152 simulations. The reason for this difference could be that for the Eu-152 was simulated each photo-peak alone, but in real life, Eu-152 emits all these energies at once. New simulations must improve the simulation for multi-emitter radioactive sources.

