


 Inglês (pdf)
 Artigo em XML
 Referências do artigo
 Enviar este artigo por email
 Citado por SciELO
  Similares em
SciELO
Similares em
SciELO 
 Permalink
1. INTRODUCTION
According to ONU-Habitat between 2000 and 2050, the quantity of urban space should be doubled in developed countries and expanded by 326% in developing countries to accommodate people (United Nations, 201). The urban boundary expansion towards undeveloped land near a city requires the extension or construction of new infrastructures, demanding relevant investments. Nevertheless, developing countries lack economic resources. Then, there are other necessary measures to accomplish with the required new investments. This reality demands the application of urgent measures to ensure a sustainable development.
Sustainability means to satisfy as much as possible dialy needs using as little as possible non-renewable or difficult to renew resources, including land use and infrastructure networks. Then, the efficient usage of infrastructure networks could cover the increment in the demand without an additional budget. For instance, the McKinsey Global Institute argues that “Improving infrastructure productivity could save $1 trillion a year” ( McKinsey Global Institute, 2013 ). They showed how boosting asset utilization, optimizing maintenance planning, and expanding the use of demand-management measures could generate savings of up to $ 400 billion a year.
As infrastructure networks are public values, national governments are responsible for guaranteeing the accessibility, affordability, availability, and social acceptability of public services. Thus, authorities and policymakers play a crucial role in the improvement of infrastructure productivity. They should remove obstacles to the effective participation of all stakeholders in the decision-making process. This calls for a more holistic and inclusive framework for the planning, design, and provision of urban mobility systems and services.
This framework could be established through the application of actor-network theory. This method allows for mapping and analyzing the physical and social complexity of infra-systems. The methodology includes the identification of interested actors, non-interested actors, the formal relations between them, and interdependencies (Boelens, 2015; D. Sage, 2011).
Ecuador is a developing country, according to the World Bank’s 2021 list (World Bank, 2021). The lack of an adaptive urban planning approach causes the unbalance of the population inside the urban area, and therefore, the waste of infrastructure networks. Moreover, the lack of adequate institutional capacity and corruption-free procurement process for providing public infrastructure and services pose immense challenges in advancing sustainable development.
This article shows how the application of actor-network theory helps to define such a framework to improve the productivity of public transportation in the city of Cuenca-Ecuador. The solution will consist of a combination of transit-oriented development and demand-management measures. The implementation of the solution will allow extending the public transport service to all urban population without any substantial investment.
The article is outlined as follows. The second section introduces the Sustainable Development Goal, while the subsequent section presents the challenges to tackle in Cuenca-Ecuador. Section four provides the list of involved actors, and section five presents a description of the public values at stake. Section six shows the framework for the local government to meet the specified infrastructure challenge by 2030, and section seven describes the role of the local government in the actor-network. Finally, section eight presents a discussion and conclusions.
2. TOWARDS A MORE SUSTAINABLE FUTURE
In 2015, the United Nations adopted a set of seventeen goals as part of a new sustainable development agenda. Goal number eleven is to make cities inclusive, safe, resilient, and sustainable. The purpose by 2030 is to provide access to safe, affordable, accessible, and sustainable transport systems for everyone. Actions should include improving road safety and expanding public transportation. This, with special attention to the needs of those in vulnerable situations, women, children, persons with disabilities, and the elderly (United Nations, Sustainable Development Goals, 2017).
Expanding public transportation improves the livability of the city. Firstly, it is a sustainable mode of transport since greenhouse gas emissions per bus are about one-twelfth of the car (United Nations, 2013). Secondly, it increases the accessibility of jobs, education, health services, and other facilities. Thirdly, it is demonstrated that people with access to public transport, work more days annually than those without such an access (United Nations, 2013). Furthermore, public transportation supports community cohesion by increasing the quantity and quality of interactions between people. And finally, public transport tends to increase physical activity as most trips include walking or cycling links.
Considering that land use influences travel behavior and transport systems influences the way cities to grow, a trade-off between accessibility and livability could be reached by the combination of transit-oriented development and demand management measures. This means that cities should be more compact (Boussauw et al., 2012), with a mix of land use and prioritize sustainable modes such as public transportation and active mobility (walking and cycling). Experiences worldwide demonstrate that this could reduce 10 % to 20 % in car dependency (United Nations, 2013).
Ecuador is a state member of the United Nations since 1945 (United Nations, Member States, 2017). Therefore, Cuenca must meet this goal as well.
3. CHALLENGES TO BE TACKLED
The city of Cuenca lies in the southern part of Ecuador in the sierra of the Andes, with elevation varying from 2350 to 2550 m.a.s.l. The urban area occupies 70.59 km2 and has a population of 636996 inhabitants (INEC, 2020). Low densities and uncontrolled growth in the periphery characterize this area (GAD Municipal Cuenca, 2016).
Four rivers cross the city, Tomebamba, Yanuncay, Tarqui, and Machángara. These rivers drain in the Amazon River watershed. The city is surrounded by mountains on all sides with passes to the west, south, and east. Tourism, industry, and agriculture are the principal sources of its economic development (IDOM-GAD Municipal, 2015).
The Tomebamba River divides Cuenca into two parts. At the top, corresponding to the old city, working, and commerce activities are predominant, since here relevant government and some educational institutions lie. In the lower part, corresponding to the modern city, dwelling activities are the most important. Besides, the urban area exerts a great attraction to a regional level since there are localized major facilities such as the University of Cuenca, the Regional Hospital Vicente Corral Moscoso, and The Supreme Court of Justice. Owing to the architectural wealth of its city center, UNESCO listed Cuenca as a World Heritage Trust site in 1999.
Currently, the public transport (PT) supply entails buses (primary mode from a social perspective), taxis, pickups and since May 2020, the Light Rail Transport (LRT) 4 Ríos has been operating (GAD Municipal Cuenca, 2016). The LRT has a length of 20.4 km.
Two public bus systems run in the city (GAD Municipal Cuenca, 2016); the first is a trunk model that runs in the north-south direction with buses that feed it in the east-west direction. The transfer stations are in the Feria Libre (Zone 39 Figure 1) and the Buses Terminal (Zone 10 Figure 1). These points are not the beginning or end of the operation, but crossing points where the exchange could take place. The second operating bus system is composed of conventional lines, which do not have a defined model, describing diffuse paths in its route, although individually describes a diametrical behavior.
The spatial coverage of public transportation on urban territory is 77.5%, while the population cover is 92% (GAD Municipal Cuenca, 2016). Such limitations restrict access to opportunities for urban dwellers in Patamarca, Sinincay, Narancay, Rayoloma, Molinopamba and Capulispamba (zones 36, 21, 30, 24, 32, 38, 31, 49 in Figure 1), with implications for their overall wellbeing and progress. In these zones, the population density varies between 800 and 3600 inh/km2.
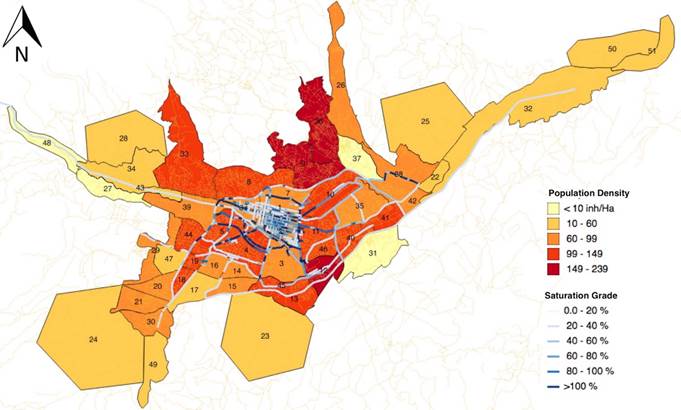
Figure 1 Map of the city of Cuenca. Colors represent the population density according to the Ordinance for land use planning promulgated since 2003 and currently valid. Blue lines show the saturation grade of the road infrastructure. The intensity of the color is proportional to the saturation grade. Source: Generated by the author
Buses cover 866.73 km every day with an average frequency of 7 min. 31% of buses run with a mean speed of 10 and 17 km/h, 55% between 17 and 24 km/h, and 14% of the bus lines run with an average speed higher than 24 km/h (GAD Municipal Cuenca, 2016).
Regarding the rolling stock, this mode encompasses 475 units with a global capacity for 36560 passengers; 17248 seated, and 19312 legal standees. 54% of the units have an average capacity of 90 passengers, and 52% has a mean age of 10 years (useful legal life is 20 years for the urban public transport service).
An important performance indicator is the occupancy ratio of the public transport system. It corresponds to the relation between the number of passengers and the traveled distance per vehicle. The public transport system in the urban area has an average of 4.2 passengers/veh-km (a value of 4 passenger/veh-km covers the operational costs per km in Cuenca (GAD Municipal Cuenca, 2016). However, 9 bus lines from the 29 in operation, do not even cover their operational costs due to the low passenger demand.
Concerning the travel time, 17.3% of trips last between 1 to 5 min and 34.1% between 6 to 10 min (GAD Municipal Cuenca, 2016). Thus, non-motorized modes could execute these trips to release traffic pressure (0.17 - 6 km). Considering the relationships between the supply and the demand, a new configuration of bus lines is necessary.
Another indicator is the saturation grade of the road infrastructure. It corresponds to the relation between road capacity and the demand in every corridor. Plotting the saturation grade allows identifying those corridors that are being sub-used. Figure 1 shows the saturation grade of the road infrastructure within the urban area. This percentage represents the ratio between the demand and the road capacity during the peak hour.
Moreover, the relationship between population density and saturation grade allows identifying those areas where construction of housing projects should be encouraged, taking advantage of the road infrastructure that is being wasted.
According to PMEP 2015-2025 (GAD Municipal Cuenca, 2016), there are 600000 daily local trips in the urban area. 70% of these trips are recurrent (same route and same hour). Regarding the modal split, the municipality reports that 32% of them are made walking, 31% with a public bus, 32% with a private car and 5% with other modes. The occupancy rate for car trips is very low (GAD Municipal Cuenca, 2016).
According to the Public Mobility Company, EMOV EP., in 2014 the transport sector was responsible for 95% of carbon oxide emissions, 71.2% nitrogen oxides, 30.2% sulfur dioxide, and 55.6% microscopic suspended particles (MP10) (GAD Municipal Cuenca, 2016; IDOM-GAD Municipal, 2015; EMOV EP., 2017). These pollutants cause serious health problems that, the World Health Organization (WHO) estimates, that in Ecuador, 33.1% of the deaths registered in 2019 were directly related to causes derived from environmental pollution (Revista Opción S-Isaías Campaña, 2019).
3.1 Performance goals for 2030
According to the Ecuadorian Constitution and the Organic Law of Land Transport, Traffic and Road Safety (LOTTSV), the Municipality of Cuenca is responsible for providing the public transportation service in the entire city (ANT, Ley Orgánica Reformatoria a la Ley Orgánica de Transporte Terrestre, Tránsito y Seguridad Vial., 2015). A private operator provides the public transport service. However, the lack of urban planning makes that public transport operators avoid supplying a suitable service if they do not receive additional compensation. Thus, the lack of public transport services encourages the use of the private car to satisfy transportation needs (GAD Municipal Cuenca, 2016; Cuenca, 2015; Busch-Geertsema & Lanzendorf, 2017).
In agreement with goal number 11 of the United Nations, the Municipality of Cuenca must provide access to a safe, affordable, accessible, and sustainable public transport system for all citizens in Cuenca. The municipality should accomplish this by improving the productivity of the current network by managing the PT-demand and making the investment as small as possible.
Urban planning and land-use policies, together with demand management and fiscal measures, could encourage a modal shift towards more sustainable mobility (United Nations, 2013). Another alternative is the management of parking supply. Increasing parking costs has proved to be effective in discouraging the private vehicle if it is incorporated in the overall city-wide transport strategy (Moore et al., 2010; Litman, 2018).
The problem formulation, causes, and dilemmas allow us to identify some fundamental actions to meet the posed goal.
Increase the PT-demand, especially in those bus lines in which the number of passengers/veh-km is lower than 4.
Extend the public transport supply to Patamarca, Sinincay, Narancay, Rayoloma, Molinopamba, and Capulispamba (zones 36, 21, 30, 24, 32, 38, 31, 49 in Figure 1).
Reduce the total travel cost for public transport service.
Diminish private car dominance.
4. NETWORK OF ACTORS
Actor-network theory is the most suitable approach to map the constantly shifting networks of relationships among human and nonhuman actors involved in the expansion of the spatial coverage of the public transport service in Cuenca. The actor-network theory allows systematically exploring the socio-political environment in which the problem is concerned. It entails knowing who will support the proposed solution, who is against it, who has the power to block the strategy, and who can offer social support to it. Moreover, the policy for problem-solving should consider the concerns and issues of all actors.
The Actor-network theory has been used in several research areas in which a holistic perspective is necessary. For instance, (Valderrama A. & Jrgensen U., 2008) proposed a framework based on actor-network theory to account for the interactions of existing and new transport systems. Through the analysis of the Transmilenio in Bogotá and the Metro in Copenhagen, the authors exhibited that the design, construction, and operation of urban transport systems constitute a process where the actors involved negotiate and actively distribute agency in the components of the new system. Sage et al. (2011) applied the actor-network theory to identify human and non-human actors that could assure the success of major construction projects.
Like those authors, Elbanna (2013); MacNeil & Mills (2015); De Albuquerque (2015) used a case study to show the benefits of actor-network theory.
Burga R. & Rezania D. (2017) applied the actor-network theory to collect data and analyze it for the enactment of accountability in the renovation project of a historical building at a public university. The relationships between stakeholders exhibit the sequence of accountability in each stage of the project from the onset to the fulfillment of the project.
Oppong (2017) provides a conceptual model of stakeholder management performance attributes to measure project success in the industry by evaluating the level of stakeholder and organizational satisfaction in construction project delivery.
Sarker et al. (2019) conducted a systematic case study to exhibit the willingness to walk to a public transport station. The actor-network theory was applied to map the relationships between the involved stakeholders. This allowed identifying the factors that could improve the accessibility to the public transport service and formulating strategies and standards for the sustainable planning of the public transportation system in Munich.
Dudley et al. (2019) explored the dynamics of how a technological innovation failed as a niche innovation in terms of the socio-technical transitions framework. Through the Mobike dockless bicycle hire scheme in Manchester showed that poor participatory practice in the earlier stages of the scheme, together with the inability of the innovator to respond appropriately through the participatory exchange, including the direct participation of the public through the technology, in the implementation stage, are the reasons for failure.
Those studies highlight the importance of the complete identification of all stakeholders: to form alliances to strengthen the project and to facilitate its execution, or to take timely measures that weaken possible opposition.
Table 1 shows the network of actors that are involved in the improving of the PT-productivity in Cuenca. The network of actors allows identifying the political, legal, financial, and technical resources available for the execution of the actions.
Table 1 The network of actors, interests, and means that were identified to improve the productivity of the public transportation service in Cuenca
| Actors | Interest | Means |
|---|---|---|
| Minister of Transportation and Public Works | Provide access to PT to all citizens in a safe, efficient and affordable way. | Legislation and financial resources at national level. |
| National Transit Agency (ANT) | Contribute to the national development, through the regulation, planning, and control of land transport, traffic and road safety, through the formulation and application of laws, rules, policies, plans, programs, and projects that guarantee the satisfaction of users. | Control, monitoring and financial competences at national level. |
| Mayor of Cuenca and the Cantonal Council | Improve the productivity of the transportation network. Increase the PT-accessibility to the urban area making the small investment as possible. | Legislation and financial resources at local level. |
| Mobility Department (DMT) | Improve the productivity of the public transportation system by managing the demand (Public-transport-oriented growth). Implement measures and strategies to increase the level of service of PT. | Knowledge and technical resources. |
| Public mobility company (EMOV EP) | Execute the projects of the Mobility Department. | Legal competences to call for tender. |
| Urban Planning Department (SEGEPLAN) | Assure a balanced growth in the urban area, avoiding the urban sprawl and the formation of slums. Take advantage of the ordinance to consolidate areas with low population density (83000 housing deficit until 2030 (Cuenca I.-G. M., 2015)). Establish a new policy to control the price of the available urban soil to avoid speculation (10.5 % of the urban soil is available (Cuenca I.-G. M., 2015)). | Knowledge and technical resources. |
| Transport Chamber of Cuenca (Representing to the public transport operators.) | Assure positive revenues for all its associates. Get subsidies for bus lines in which the demand does not cover the operational costs. | Operational resources and working force (rolling stock, bus drivers, data about the demand and the collection) |
| Parking operators | Assure positive revenues for their business, thus they are in favor of the use of a private car. | Citizen participation |
| Private investors | Assure positive revenues for their business, thus they are in favor to promote housing projects in places with network infrastructure. | Publicity of housing programs. Citizen participation |
| Public transport users | Better, safety, reliable PT-service without an increment in the fee. (31 % in the modal split) | Citizen participation |
| Captive private car users | Access to public transportation. (8 % of the urban population has no access to PT) | Citizen participation |
Source: Generated by the author
5. PUBLIC VALUES AT STAKE
Since the problem involves a public service (Public Transportation), it is necessary to review the current situation of the involved public values at stake. The proposed solution strategy should improve these conditions.
The current situation is as follows:
Affordability: The Ecuadorian government reduces the supply cost of public transportation by subsidies. These grants include half of the fee (current fee is 0.30 USD/trip) to pregnant women, students, persons with disabilities, and the elderly. Besides this, there is a subsidy for imported tires for buses and a new rolling stock purchase for buses if the previous one is scrapped (Ministerio de Finanzas, 2019; El Universo, 2019). The government eliminated the subsidy for fuels in May 2020 (Escobar, 2020).
As it was mentioned, subsidies are not addressed to improve the level of service of public transportation.
Safety: Road traffic accidents are the third cause of death in Ecuador (El Universo, 2018). Malpractice, recklessness, speeding, and driving drunk are the main factors that contribute to this reality. The ANT reported 1258 crashes in Cuenca during 2018, which resulted in 38 deceased, which represents 1.78 % at the national level (ANT, Estadísticas de transporte terrestre y seguridad vial, 2018). There are no statistics only about public transport.
Accessibility: Accessibility determines the equity of people to accomplish their essential needs. The grade of the accessibility of a zone boots its economic development.
The accessibility to transit stations or stops from their catchment area determines the public transport accessibility. Another factor that determines public transport accessibility is the geographical coverage of public transport within a given travel time budget. i.e. a 400-m walkable catchment for bus stops is suggested and backed by several pieces of evidence (Bertolini et al., 2005). In Cuenca, there are zones with a bus stop every 300 m. As it was mentioned, 8 % of the population has no access to the public transport and, 22.5 % of the urban territory has no infrastructure for this service.
Quality: Statistic information about the real condition of the population is very limited since the scarce documents refer to national censuses which are executed approximately every ten years. However, studies such as the presented in Mejía et al. Mejía et al. (2015) reveal that the general perception of the quality of the public transport service is in average 14.14 in the scale 0-20. In this scale, 0 means unacceptable, 10 acceptable, and 20 excellent. The lower perception is about the security against assaults inside the rolling stock (7.44) and for the driver training (7.96). On the contrary, the ticket price reached the highest perception (12.85). Regarding the speed and travel time, the perception is positive, with average punctuation of 10.22.
Sustainability: Sustainability in public transport means to satisfy as much as possible demand, using as little as possible of non-renewable or difficult to renew resources, including land use and infrastructure. Then, according to the indicators mentioned in section 2 (spatial cover, PT-accessibility, occupancy ratio, travel time, saturation grade of the road infrastructure, CO2 emissions, etc.), the public transportation in Cuenca requires additional measures to become sustainable.
6. FRAMEWORK FOR THE MUNICIPAL GOVERNMENT TO MEET THE SPECIFIED INFRASTRUCTURE CHALLENGE BY 2030
Designing an approach that assures solving a posed problem, requires identifying the interests, desired situation, current situation, causes for detected gaps, preferred solutions, and own means of every involved actor (Maldonado et al., 2010; Tiwana & Keil, 2009; Turner & Zolin, 2012; Rezania & Ouedraogo, 2013).
The inventory of interests shows that all stakeholders, except for the parking operators, are dedicated actors. They could be strong allies to improve PT-productivity and extend the PT-service to the entire urban population. Therefore, the municipal government should handle them to undertake the project. The Minister of transportation and public works, and the ANT have established the necessary legislation to grant the competence of transit and transportation to the local government. Together with this, the additional budget that each local government should receive to exert this jurisdiction has been established, so it is up to the municipality to comply with and enforce what is stipulated in the LOTTSV valid since 2014 (ANT, Ley Orgánica Reformatoria a la Ley Orgánica de Transporte Terrestre, Tránsito y Seguridad Vial., 2015).
Likewise, the identification of gaps in the current situation, their causes, and the preferred solutions helped to list some specific activities to success with the actions enumerated in subsection 3.1.
Parking operators could be potential critics of the project, especially those who have their business inside the city center. Therefore, the local government and the Cantonal Council should establish measures to boost the sequential change of the core business; some alternatives could be providing incentives for the implementation of cycling facilities, such as lockers, douches, maintenance workshops, etc.
With the Transport Chamber of Cuenca, the public transport operators should show their financial model to define measures that allow the extension of the PT-service without jeopardizing its business.
7. ROLE OF THE MUNICIPAL GOVERNMENT IN THE ACTOR NETWORK
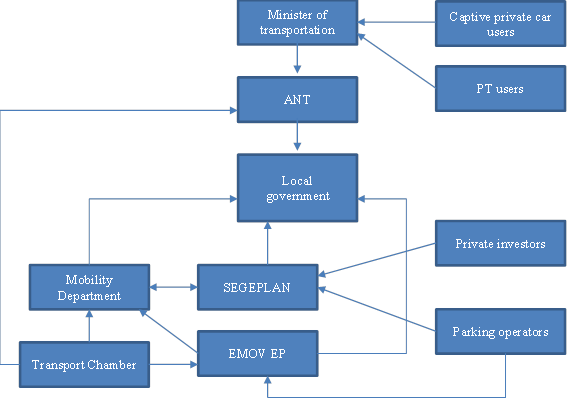
In the mapping of the formal relations between the involved actors, we considered national and local guidelines, laws, and ordinances. Based on this statutory framework, Figure 2 shows the hierarchy of the actors that should be respected.
As we can see in Figure 2, the local government is responsible for complying and enforcing all the dispositions of the Minister of transportation and public works and the ANT. At the same time, the local government is responsible for organizing, planning, and coordinating through the local authorities the necessary measures for the implementation of such dispositions. The actor-network of Figure 2 highlights that the Minister of transportation and public works and the ANT are strong allies of the local government. They, based on the current legislation, could use financial resources from the national budget to fund the investment. Table 2 shows a list of the actions to be taken with the people or entities responsible for their execution.
Table 2 List of tasks and responsible for every required measure
| MEASURES | ACTIONS TO UNDERTAKE | RESPONSABLE | |
|---|---|---|---|
| Balance the PT-demand during the journey. | |||
| 1.1 Increasing the population density in areas in which the current road infrastructure is sub-used and there is vacant land. | Inventory of vacant land. | SEGEPLAN, DMT | |
| 1.2 Reformulate the routes of the bus lines in a way that every origin zone connects efficiently with its principal destination. | Origin-destination survey per zone and per bus line. | DMT, EMOV EP | |
| 1.3 Redistribute as possible the main interest points (attractors of trips) among areas with higher PT-demand. | Inventory of interest points per zone. | SEGEPLAN, DMT | |
| 1.4 Increasing reliability in the public transport system. | Establish a contingency plan for a possible obstacle in the route. Real-time coordination with the traffic operation center. | EMOV EP, Transit Chamber of Cuenca | |
| 1.5 Respecting the bus stops. | Road safety education programs in schools and high school, and training programs for bus operators. | Transit Chamber of Cuenca, PT users, Education department | |
| 1.6 Improve the payment method. | Enhance the use of the electronic card by advertising campaigns and road safety education programs. | EMOV EP, Transit Chamber of Cuenca, Education department | |
| 1.7 Implementing safety systems inside the units, for instance, video cameras (front and back), tickets validators, emergency buttons. | Control and monitoring of the installed devices. | EMOV EP, Transit Chamber of Cuenca | |
| 1.8 Enhance the training of the conductors. | Driver education and monitoring programs. | EMOV EP, Transit Chamber of Cuenca | |
| 1.9 Provide a service with warmth and quality. | Driver education and monitoring programs | SEGEPLAN | |
| Supply the PT-service to all the urban area. | |||
| 2.1 Consolidate areas with scarce population by the promotion of affordable housing programs. | Improve the coordination between the planning and the control department based on the products of 1.1. Provide incentives to increase the number of dwellings per lot. | SEGEPLAN, DMT | |
| 2.2 Reformulate the routes of the bus lines. | Based on the products of 1.2. | DMT, EMOV EP | |
| 2.3 Redistribute bus stops. | Based on the products of 2.2. | DMT, EMOV EP | |
| Reduce the total travel cost for public transport service. | |||
| 3.1 Improving the conditions of the road infrastructure in which the buses run. | Based on the products of 1.2. | DMT, OOPP | |
| 3.2 Implement priority policies for public transport in the main corridors. | Using the data of the traffic operation center (traffic lights, horizontal and vertical signaling, physic elements). | DMT, OOPP | |
| 3.3 Adjust frequencies in the most demanded routes. | Based on the products of 1.3 and 2.2. | DMT, Transit Chamber of Cuenca | |
| 3.4 Extend the public transport service to all urban area. | Based on the products of 1.3 and 2.2. | DMT, EMOV EP | |
| Decreasing in the private car dominance. | |||
| Review of the car ownership policy (increase or implement taxes). | Coordinated reduction in the subsidy of fuels for private car users. Severe green taxes, tax per driven kilometer during the peak period inside the congested zones. | Mayor and Cantonal Council | |
| Increasing the total travel time for the private car and giving priority for public transport on the main corridors. | Based on the products of 3.2 | DMT, EMOV EP | |
| Reducing parking spots within the congested zones, but augmenting in the borders. | Based on the products of 1.3 and 2.2. | DMT, EMOV EP, SEGEPLAN | |
| Change the perception that car ownership rises social status. | Education programs in schools and high school. | EMOV EP Citizen organizations. | |
Source: Generated by the author.
8. DISCUSSION AND CONCLUSIONS
In this study, we explore how the application of actor-network theory allows defining a holistic and inclusive framework for the planning, design, and provision of urban mobility systems to extend the public transport service to all urban population. The framework allows improvements with little investment in Cuenca’s infrastructure. This, by the combination of transit-oriented development and demand-management measures.
The findings of this study suggest that the productivity of the public transportation network depends on the planning configuration of the city. Urban models that consider high population densities and diversity of activities take advantage of the maximum infrastructure capacity, while the closeness of the activities boosts the use of non-motorized modes.
On the contrary, the case study of Cuenca described in section 3, with low population densities and a strong tendency to continue expanding the urban area, wastes the current infrastructure capacity. This model requires a higher investment to cope with the demand of the growing urbanization and extends the commuting distance while it encourages the use of the private car. This since the PT-service is not efficient due to the low demand.
Besides, the population density and the saturation grade of the road infrastructure in Cuenca show that the concentration of activities in few zones as the Historic Center and the Ejido attracts a higher demand of trips which overcrowd the road infrastructure of buses (17 bus lines of the 29 cross these zones). In addition, the lack of measures to discourage the use of the private car increases congestion levels and its detrimental effects.
The diagnostic of the current situation (section 3) and the review of the involved public values at stake (section 5) allow identifying four fundamental actions to improve the PT-productivity in Cuenca, and to make the city inclusive, safe, resilient, and sustainable to 2030.
The improvement of the PT-productivity service is feasible by the implementation of a package of 22 specific activities that combine transit-oriented development and demand-management measures.
The local government of Cuenca has all the necessary instruments to meet the goal by 2030: moving from captive riders to clients in public transportation by making public transport a lifestyle choice. This requires a strong customer focus and strong political leadership to negotiate with all stakeholders.
The network of actors involved (table 1) highlights the importance of citizen participation to ensure that each state contributes positively to each stage of the process (planning, financing, socialization, dissemination, and execution); the necessity of a constant articulation and coordination of the planning, mobility, and urban control departments inside the local government; the importance of to communicate the measures that will be applied, their objective, how will be measured, their impact, and the results of the monitoring. Only a well-informed citizenry of the common benefits that are being achieved in each phase can guarantee social support to the project and its sustainability.
Perhaps, a limitation of this work is related to the lack of knowledge about the business model of the Transport Chamber of Cuenca (private PT operator) to review if the package of measures assures sustainability to the public transport operators.
Further research is needed to study the impact of the COVID-19 on the public transport demand and the change in the activities in the city due to the different restrictions in the pandemic context.