


 Inglés (pdf)
 Articulo en XML
 Referencias del artículo
 Enviar articulo por email
 Citado por SciELO
  Similares en
SciELO
Similares en
SciELO 
 Permalink
Introduction
Wayfinding is the ability to find a way to a particular destination or location and to recognize the target when approaching it (Chen et al., 2009). Healthcare buildings are complex buildings with multiple interconnected units that may cause difficulty in wayfinding if inadequately planned. Permanent and temporary tenants of hospital buildings participate in a variety of scheduled and unscheduled activities that interact with each other and are dependent on social, spatial, environmental, and temporal aspects (Schaumann et al., 2020). Wayfinding difficulty causes temporary interactions between staff and patients, may disrupt the functioning of the building. Also, it causes emotional problems such as frustration (Deng et al., 2022). Studying user behavior in various environments is crucial for designing buildings that are easy to navigate.
It can be assumed that two main factors affect wayfinding: human factors and environmental factors. Human factors can be grouped as follows: wayfinding cognition; wayfinding behavior; and individual and group differences (Jamshidi et al., 2020). The categorization of environmental factors by Weisman (1981) identifies four classes that influence wayfinding performance: visual access, the degree of architectural differentiation, the use of signs, and plan configuration. This study particularly focuses on the wayfinding behavior as a human factor, and visual access and plan configuration as environmental factors by using iVR to sequentially test three different hospital buildings in a virtual environment (VE), which would not be possible in real life.
Wayfinding and spatial performance
Plan configuration determines the overall circulation area, such as staircases, elevators, and corridors of a building. Space syntax theory, which consists of a set of analytical techniques for calculating spatial inter-relationships of spaces (Yamu et al., 2021), has been widely used in wayfinding studies to understand spatial performance better. With the help of space syntax analysis, some spatial aspects can be measured quantitatively such as visibility.
A study that utilized space syntax theory shows that corridor characteristics are strongly related to visibility (Hadi et al., 2016). Schaumann et al. (2020) observed user interactions to improve the ward layout of a hospital to reduce staff-visitor interactions. Another study revealed that the spaces with high accessibility improve the wayfinding behavior of the users (Aksoy et al., 2020). Pouyan et al. (2021) emphasized that the hospital's circulation patterns significantly affect the wayfinding strategies, and the sense of direction is higher in visible destinations. Chen et al. (2021) suggested that a symmetric tree-branch structure rather than a circular one in a healthcare building has better wayfinding performance.
Wayfinding and virtual reality (VR)
VR has become a commonly used tool for wayfinding studies by allowing the creation of multiple physical environment setups in a virtual world. Although there are differences in behavior between real life and VEs, it offers major benefits in terms of experimental control and options to track behavioral responses ((Diersch & Wolbers, 2019). It allows design errors to be tested and corrected before they are implemented in real life.
VR systems are mainly categorized into three groups according to the degree of immersion: non-immersive, semi-immersive, and fully immersive (Onime et al., 2015). Semi-immersive VR puts the user partially inside the virtual world allowing them to be aware of the real world while immersive VR entirely transports the user with specialized gear. Non-immersive VR simply provides a virtual world through a screen.
Immersive VR (iVR) offers the closest experience to reality among the types of VR. It aims to make the user feel like they are in that VE by providing a 360-degree image of the based on the user's movement. When it comes to representing a real-life environment through VR, VE's can't exactly represent real life, but the details and material properties of the 3D model elements that make up the VE's bring the environment closer to reality. A variety of studies focused on the effects of virtual and real environments on wayfinding experience. As the VR experience gets closer to reality, the similarity of the collected data with the data obtained from the real environment increases. The high potential of VR as an assessment tool for wayfinding studies was emphasized while spotting differences between real and VE’s (Kuliga et al., 2015).
There is extensive literature on wayfinding with different focuses through VR that can be sorted as follows: user stress levels (Lin et al., 2019; Fei et al., 2022; Qi et al. 2019; Ewart and Johnson, 2021), architectural characteristics (Zhu et al., 2020) , evacuation wayfinding (Shi et al., 2021, Mao et al., 2024), wayfinding behavioral data collection (Feng et al., 2022), signage (Al-Sharaa et al., 2022), and brain activity during wayfinding (Kalantari et al., 2022).
Behavioral sequence analysis (BSA)
Behavioral sequence analysis is a method for investigating how chains of behaviors are linked over time (Marono et al., 2020). It allows the analysis of each behavior in relation to each other. It is a method commonly used in ethology (Asher et al., 2009; Bels et al., 2022) or in criminology (Beune et al., 2010; Marono et al., 2017) but not common in architectural studies. It is important to understand chains of behaviors and how the architectural aspects of a space affect these occurrences to design human-centered buildings.
Protocol analysis, based on observation to reveal the dynamics behind the way of thinking is a similar method to the BSA. It is commonly used to analyze the design thinking process and the strategies in architectural studies. It consists of a set of analyses based on verbal data, design sketches, and video recordings of the design process. Protocol analysis typically involves analyzing verbal data collected from think-aloud processes or reports, as well as actions taken during the design process and collaborative behaviors (Suwa & Tversky, 1997; Gül, 2009; Prats et al., 2009; Kim & Lee, 2016; Wang et al., 2024). Although BSA and protocol analysis are two closely related methods, this study focuses on physical wayfinding behavior rather than design processes and does not analyze verbal or collaborative interactions thus, utilizing BSA to analyze how environmental factors influence behaviors.There is a gap in the existing literature on wayfinding where spatial characteristics and human behavior can be associated. The literature also takes a superior approach, overlooking the details and relations between behaviors. However, iVR experiments can be used to collect more detailed behavioral data.
Methods
The methodology associated wayfinding behaviors with spatial performance. Based on the literature, we categorized plan layouts and created simulated environments in VR by collecting architectural data. We transferred the data of these buildings to VR software for the experiment. The data on behavior and time were gathered by observing VR experiments. Then, utilizing space syntax tools, we conducted visibility analysis to collect C values. After associating the C values with the corresponding behavioral data, we interpreted the results both separately and as a whole.
The study consists of the following steps seen in Figure 1: Preparing the VE’s, conducting the space syntax analyses, preparing the experiment setup and conducting the experiment, arranging the experiment data, and analyzing the experiment data.
Preparing Virtual Environments
Three real hospital buildings were chosen to test common space layouts for hospitals, based on specific selection criteria as follows:
Floor plan layout typology: Weisman (1981) draws the ideal plan schemes for a better wayfinding experience that depicts the commonly used space layouts even today. Over time the space layouts and geometries of buildings have changed but still, common plan schemes, which have been used for a long time and whose functionality has been proven, remained use which can be listed in 3 main categories based on their circulation schemes: centralized, semi-centralized, and decentralized (Table 1).
The centralized layout has a main area with connected regular corridors, while the decentralized layout consists of irregularly distributed corridors. Based on this classification, three hospital buildings were chosen to examine the effects of plan layout typology on wayfinding.
Floor plan area: As seen in Table 1, 2 of the 3 selected hospital buildings have similar areas used in the study (~10.000 sqm). 1 of the 3 hospital buildings has a bigger area used in the study (~33.000 sqm) to measure the effects of building area on wayfinding performance.
Source: Weisman (1981); Archdaily (2023).
Table 1: Selected hospital buildings along with their information.
Availability of open-source floor plan data: After examining hospital buildings available on the internet, the ones with clear, legible, and scaled floor plans were selected based on the given criteria.
We only considered the first two floors (ground floor and first floor) for the experiment to avoid excessive time consumption and make tasks less tiring for participants. These two floors contained all the necessary units in each building for wayfinding tasks. The buildings' main elements and the elements that most affect people's movement and vision were modeled to simulate 3D models in the VR environment without causing computational problems. These elements can be listed as follows: the main structure of the building, stairs, ramps, elevators, façade, signage, lighting elements, doors, windows, information desks, waiting areas seating furniture, and basic decorative items.
Floor plan images were transferred to DWG format for 3D modeling and space syntax analysis using Revit software. The 3D models were then transferred to a virtual reality environment using Iris VR.
Space Syntax Analysis
Space syntax analysis provides quantitative data about spatial characteristics of a space such as visibility or visual integration. Visibility analysis gives the degree to which one can see other parts of the building from a given location
(O'Neil, 1991; Pinelo and Turner, 2010). In this study connectivity (C) values obtained from visibility analysis, which show the number of connections for each location were used as quantitative spatial data. DepthmapX was used for the space syntax analysis.

Table 2 shows that Rocio's Hospital has significantly higher connectivity than the other two buildings due to its larger area. On the other hand, all three buildings, connectivity drops on the 1st floor due to large entrance areas on the ground floor and an increase in corridor count on the 1st floor as seen in Table 3.
Experimental Setups
Participants performed wayfinding tasks in VR hospital environments based on partial 3D models. Iris VR was used to transfer models into VE’s. Only three participants were included to limit the analyzed data. The participants' ages varied between 25-30 and they had no prior VR experience. Two of them were architects while one was a publisher. All participants received a VR orientation and free time to practice VR at the beginning of the experiment to ensure consistency in the results. Oculus Quest 2 was used as the iVR tool with a headset and two controllers that provided mobility in VE’s (Figure 2). Participants were assigned three different wayfinding tasks in each building in the same order to make them navigate through different routes in the buildings: entrance to a clinic, clinic to the laboratory, and entrance to a ward (Figure 3).
Participants navigated through a hospital without prior information on the building or location, relying solely on signs and info desks. Signage was standardized across three buildings to avoid performance differences. If needed, participants could ask for directions. Participants' routes and behaviors were recorded during the experiment to analyze their performances. They completed 9 tasks each in 3 hospitals, making it a total of 27 tasks.
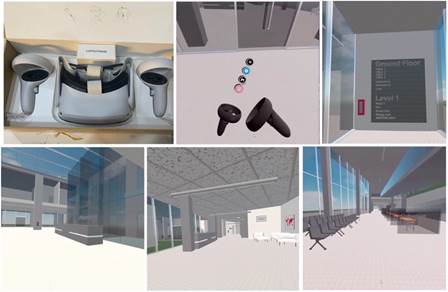
Source: Authors (2024)
Figure 2: Images of the experiment setup. From left to right: The headset and controllers, the controllers in the VE, an example of signage, the entrance of Radboudumc Hospital, the entrance of Pars Hospital, the entrance of Rocio's Hospital.
Data Arrangement
The videos of the experiments were utilized to extract behavioral data for BSA, as well as time data. The motion maps of the participants were used to extract average speed data and also C values from visibility maps.
BSA requires a set of sequential actions and their respective codes. We grouped the behaviors observed during the experiment and assigned letter codes to behaviors as seen in Table 4. We analyzed the videos, recorded the behavioral sequences, and calculated the frequency of each behavior by duration.
On the other hand, the visibility maps and the motion maps of the participants during each task were overlayed. This allowed us to gather C values for the locations where each behavior occurred. An example of a behavioral sequence for a wayfinding task, along with time and visibility data, is presented in Table 5.


Data Analysis
The analysis is divided into three groups: (1) BSA, (2) analyzing the relationship between visibility and behaviors, and (3) analyzing the frequency of behaviors in each building. A total of 937 behaviors and 31 minutes 52 seconds are analyzed in this study.
We used Behatrix, which is open-source software, to analyze sequential data and quantitative transition information. By using BSA, we identified the pairs of behaviors that occur in sequence most frequently. Behatrix uses a sequence of behavioral codes. The Behatrix input for the wayfinding task in Table 5 would be "afbpaiqnainaiqadinqjajfa". We could track the number of transitions from the transition matrices for each hospital by these sequential codes.
The second analysis explores how spatial characteristics affect wayfinding behavior by revealing at what visibility level, specific behaviors occur. We correlated the visibility and behavioral data of all the experiments regardless of hospitals. For this purpose, we utilized cross-tabulation through the use of SPSS software.
The third analysis involves calculating the total duration of each behavior type in each hospital building to determine the most frequent behaviors based on floor plan typology.
Results
We will first present the results of the individual analyses and then provide an overall interpretation of the findings from this study. To begin, we have data on the completion time and distance traveled by participants in each building. We calculated the average speed by dividing the distance traveled by the task completion time (Table 6). Since the speed is dependent on the VR system, the data provided are only for comparative purposes. The study indicates that the participants achieved their highest average speed in Rocio's Hospital, which has a semi-centralized plan layout with greater visibility and a larger floor area. Two of the lowest average speeds were recorded at Pars Hospital with a decentralized layout, low visibility, and smaller floor area.

Source: Authors (2024)
Table 6: The participants' average speed based on hospital buildings, with red indicating the lowest and green indicating the highest speed.
To examine the BSA results (Analysis 1) we need to look at the behavioral transition matrices and the count of the behaviors for each hospital (Table 7). These matrices show the transitions as follows; the transition from the code on the vertical axis to the code on the horizontal axis took place in the number of times specified at the intersections. The matrix of the Pars Hospital reveals that the most occurring behavioral pair is a-i indicating participants frequently paused to orient in space after walking forward. Also, the participants often paused for various reasons (i, j, k and l). Another frequent pair is j-a, pausing to look around and then walking forward. These transitions show that participants needed to pause frequently, especially to change their orientation. But after pausing they usually realized they were on the right path to the target and continued their way. Participants at Radboudumc Hospital usually adjusted their walking direction slightly and continued their way forward instead of stopping and changing their orientation frequently, unlike Pars Hospital. The frequent and slight change in direction may indicate the need for better observation of the surroundings since this building's symmetrical plan layout might be confusing. To differentiate between the symmetrical halves of the building, the participants required a more thorough observation. If we examine the matrix of Rocio's Hospital, we observe a significant number of pauses and changes in orientation. Participants often needed to pause to orient in space and also slightly change their direction of walking. This may be the result of the large floor area and the high visibility values leading to confusion since many elements come into view at a single glance.
Source: Authors (2024)
Table 7: The behavioral transition matrices for each hospital. Red indicates the most occurring transitions.
Analysis 2, further examines the relationship between behavior and building visibility by using cross-tabulation between behaviors and C values. By looking at the visibility levels, we can determine which behaviors occurred the most. Table 8 shows the percentage of behaviors within each C value. A total of 937 behaviors are analyzed. We observe that participants tend to take more actions and frequently change their behavior during low visibility. They frequently change direction and pause often at these levels especially for orientation change and searching, exerting more effort than at high visibility levels. At high visibility levels, walking forward is the most observed behavior and pausing is mainly for orientation change not for search. The slight direction change when walking (b, d) is another notable ratio that is mostly seen at high visibility levels.
Source: Authors (2024)
Table 8: The cross-tabulation indicating the percentage of behaviors within each C value (0.00 represents the percentages between 0-0.05).
Analysis 3, focuses on the durations of the behaviors based on hospital building (Table 9). As expected, walking forward (a) is the most frequent behavior in all three buildings. Although Pars and Radboudumc hospitals have similar percentages for walking forward, Rocio's Hospital has a much higher percentage. This suggests that participants were able to navigate Rocio's Hospital with quick changes in direction or pauses, indicating an easier wayfinding experience compared to the other buildings.
We observed that participants spent more time looking at the signage (k) in Pars Hospital compared to the other two hospitals. Slight changes in walking directions (b and d) are another commonly observed behavior in all hospitals, but Rocio's Hospital has the lowest percentage. Radboudumc Hospital exhibits frequent pausing to search (j), while this behavior is observed least at Rocio's Hospital. Turning back behavior (o and r) which indicates a decision change is mostly observed in Rocio's Hospital followed by Radboudumc Hospital.
Source: Authors (2024)
Table 9: The frequencies of the behaviors in each hospital (0 representing the seconds between 0-0.5).
The sum of all the analyses along with the spatial characteristics of the buildings can be seen in Table 10. The decentralized and diffused plan layout of Pars Hospital results in low visibility levels. As a result, way finders frequently stop for long periods to search for their way without getting lost, resulting in the slowest average speed despite its smallest floor area. Radboudumc Hospital has an average floor area similar to Pars Hospital with its centralized and symmetrical floor plan layout. This leads wayfinders to often pause to search after orienting slightly while walking. It can be assumed that Radboudumc Hospital doesn't offer a significant wayfinding experience to its users. Rocio's Hospital despite having the largest floor area and a semi-centralized floor plan layout with the most corridor count has the best average speed data. Its large spaces on the ground floor provide high visibility values which leads wayfinders to slight orientation changes while walking without stopping to better observe surroundings. Even though the sharp decision change rate is the highest, wayfinders can reorient themselves quickly.
To sum up we can assume that Rocio's Hospital performed the best while Pars Hospital performed the worst overall. Radboudumc Hospital doesn't show any significant results.

Discussion and conclusions
In this study, we utilized BSA and space syntax analyses through an iVR experiment. We assigned three wayfinding tasks to participants in VE’s of three hospital buildings with varied plan configurations. The results indicate that the semi-centralized floor plan layout with high visibility levels performs better in wayfinding while the decentralized layout with low visibility values performs worse.
Each plan layout type has its pros and cons, and there is no definitive judgment on any building or typology as entirely inefficient or optimal. We aimed to investigate how people navigate and how the environment affects their behavior. Pars Hospital guides its users with frequent stops and gradual decisions. The users take their time to search, proceed at a steady pace, and do not get lost. Radboudumc Hospital's main disadvantage is its symmetrical layout with very similar two halves. This caused the participants to waste time by frequently examining their surroundings. Rocio's Hospital has the quickest speed score with sharp and quick decisions through orientation changes. Rocio's Hospital's users who searched their way in a hurry, may have had a higher stress level. However, since this study doesn't account for real-life crowds, its effects may lead to lower average speed scores in real life. But if we evaluate the scores of this study, Rocio's Hospital performed the best with a semi-centralized plan layout and the largest floor area by lower decision behavior percentage (higher percentage of walking forward) compared to the other buildings.
This study investigated the link between wayfinding behavior and spatial performance by conducting a thorough analysis of behaviors. We analyzed the impact of different spatial characteristics, such as floor area, plan layout typology, and visibility combined with various types of data, such as speed, behavior frequency, and behavior transition. We investigated how different characteristics, as well as their combinations, affect users' wayfinding behavior and performance. This way, we could provide insights to improve hospital building design, reducing stress levels for users and time spent in the building.
Wayfinding strategies or wayfinding stress were not examined in this study to reduce the scope and compare the data more accurately. For future studies, these topics can be associated with spatial characteristics through behavioral sequence analysis. Three participants provided 937 behaviors for analysis, but due to time limitations only three average speed data were available. Additional data would enhance the accuracy of the average speed evaluation.

