Suggested citation: Briceño-Martínez, B.; Castillo-Calderón, J.; Carrión-Jaura, R. and Díaz-Sinche, D. (2020). «Proposal for implantation of coffee drying greenhouse with parabolic cover and adapted modular structure». Ingenius. N.◦ 24, (july-december). pp. 36-46. doi: https://doi.org/10.17163/ings.n24.2020.04.
1. Introduction
The worldwide coffee sector constitutes an important livelihood for millions of people, especially in developing countries. In its global production, South America represents the 47 %, followed by Asia and Oceania with 29 %, Central America and Mexico with 13 %, and Africa with 11 %. The production of Brazil, the worldwide leading coffee producer, increased 5.6 % and was 57.4 million of bags, among which was part of the harvest from April 2018 to March 2019. It is calculated that the consumption of coffee in South America increased 1.8 % and was 26.97 million of bags, after an increment of 3.5 % in 2016/2017 [1]. The use of solar energy in the agricultural sector is growing due to the price increase of the fuels, the environmental pollution and the forecasted depletion of conventional fossil fuels. The drying using solar energy is one of the most attractive and promising applications in rural areas. Usually, agricultural crops are dried by exposing them to the sun, which contributes to extend the useful life of the harvested products, thus improving the quality, position and business of the farmer, with the purpose of maintaining a constant price in their products. The direct sun drying requires an open space of large area, and mostly depends on the availability of sunlight, which is susceptible to the pollution with foreign materials such as dust, garbage and other chemicals that may be dragged out by the wind, as well as birds, insects and rodents. Similarly, most of the agricultural products intended to be stored should be first dried, because they could be affected by insect pests and fungi that easily develop when there are humid conditions, thus becoming unusable [2].
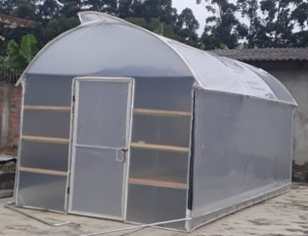
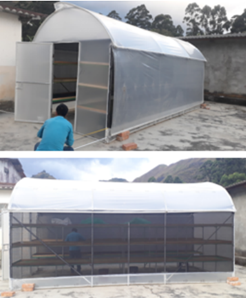
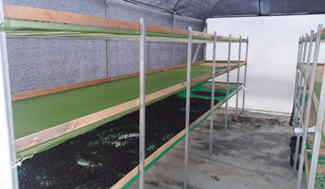
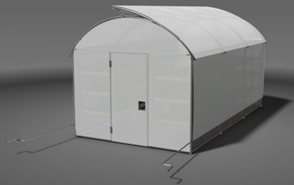
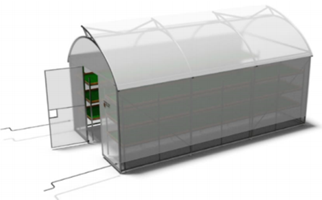
In a peak day it can be obtained an equivalent of 2.0 % of the total yearly production of washed coffee (drained), in a farm with a production of 2500 kg c.p., for which it is required 3.3 m2 of floor, having a layer with a maximum height of 3 cm [3]. With the purpose of enabling a better utilization of the solar energy, reducing the cost and facilitating the construction, operation and maintenance, a parabolic solar dryer was improved, which will be called marquee. Just like the solar tunnel dryer, it is constituted by a metal structure, a transparent plastic cover, cemented floor, rolling gates of transparent plastic and a door for internal access. The solar dryer facilitates an acceptable quality of the coveted product with a low environmental impact, and thus it is an effective, inexpensive and safe method for drying agricultural and food products. Figure 1 shows the marquee which occupies a total area of 18 m2, with a concrete floor that helps to make it a clean area, and houses two shelving columns with six drying beds, each of 6 m2, which are exposed to the there is rain present, or when the estimated temperature is not the correct one; therefore, the height of the drying beds above the floor level is 0.60 m, thus reducing the possibility that the coffee gets contaminated as a result of the trampling of the workers, or by the accidental entry of animals [4].
1.1. Solar drying
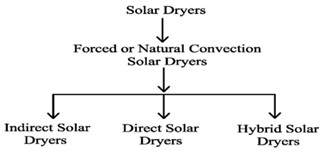
In general, the solar dryers are classified in three categories, as shown in Figure 2.
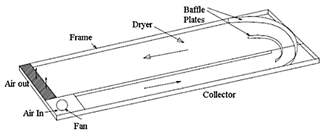
In this context, this work will focus on the direct solar dryer, because the moisture of the product to be dried is eliminated by its direct exposure to sunlight, with or without natural air circulation [4]. A schematic view of the direct solar dryer is indicated in Figure 3. The direct solar dryer has a drying chamber, an insulated box wrapped with a glass or plastic transparent cover, which has holes for letting the air move in and out of the chamber [5]. When the solar radiation affects the glass or plastic cover, the air warms and circulates naturally, or by wind pressure using an external source or a combination of both..
The construction of the direct solar dryer is simple and cheaper, and protects the product being dried from dust, rain, debris, dews, etc.; however, it also presents some drawbacks in its operation, such as product overheating, undesirable quality and limited drying capacity [6]. Tomar and Norton [7] developed a crop dryer consisting of a solar air heater and a tunnel dryer, for drying a variety of agricultural products, as can be seen in Figure 4. In comparison with the traditional solar drying methods, the drying time and the massive losses were significantly reduced with the amortization period of 1-3 years. For example, it was reported that the energy necessary for drying 1000 kg of grapes varies from 11.2 to 23.0 kWh depending on the weather conditions, with a cost between 1.2 and 2.0 USD which was absolutely insignificant as compared to the additional profit. However, the dissemination of the solar drying system to a particular area depends on the availability of electricity and of its needs.
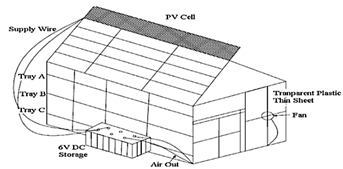
Neama and Farkas [8] presented an experimental study to increase the crop drying efficiency using a photovoltaic cell. The dryer reached a temperature of 76 °C and reduced the moisture content between 50 % and 60 %. The schematic view of the solar dryer with photovoltaic cell is shown in Figure 5. Ogheneruona and Yusuf [9] designed and manufactured a direct natural convection solar dryer for drying tapioca, and reported a reduction of the moisture content from 79 % to 10 % wet basis at environmental conditions (32 °C and 74 % of relative humidity).
Tefera et al. [10] evaluated the performance of wooden box and pyramidal shape direct solar potato dryers, which reduced the general drying time between 2 and 3 hours compared to the open sun drying. The pyramidal dryer performed better in the generation of a more favorable drying environment, with a better economic viability. Similarly, Eke and Arinze [11] developed a prototype of a direct natural convection solar dryer made with clay, for drying corn. It was observed that the moisture content was reduced from 29 to 12 % wet basis, achieving a 55 % savings in drying time against open sun drying. It was found that the drying efficiency of the dryer and of the open sun drying method were 45.6 % and 22.7 %, respectively. Therefore, the direct solar dryers are the devices mostly used for drying agricultural and food products. It is observed that the mean drying efficiency of direct solar dryers varies from 20 to 40 % depending on the types of products, the flow of air, and the drying location. The quality of the product obtained using direct solar dryers is acceptable, and can be improved by means of the use of certain types of pretreatment chemical processes.
2. Materials and methods
For the case study it was taken as reference the León Farm, located in the Loja canton, Vilcabamba parish. This farm has a parabolic solar dryer (marquee) consisting of a structure, shelving, and six drying beds of 6 m2 , which will be planimetrically surveyed for the design of the modular couplings for its easy mobilization and construction. The measurement equipment utilized for the survey were flexometer, laser distance meter and goniometer. The steps followed in this research were acquisition of real measurements, the 3D planimetric survey, the conversion of the survey to a real environment using the Rendering software, the analysis of modular couplings and the graphical comparison of the efficiency of the time and the drying of the coffee.
2.1. Extent of the research
This research spanned a period of four months (interval between June 2019 and September 2019). The collection of data and valuable information was consulted in the following documents: i) NTE INEN 2507 [12], ii) Ecuadorian Standard of Construction NEC-11, chapter 14 Renewable Energy [13].
2.2. Planimetric survey
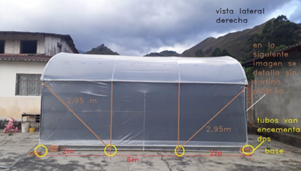
Dimensions of all the components that constitute the marquee are presented, as indicated in Figure 6.
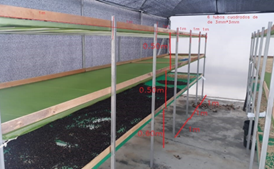
The dimensions of the marquee are 3 m high, 3 m wide and 6 m long; it consists of six beds for coffee drying, with dimensions 1 m wide x 6 m long. Figures 7 and 8 show the coffee drying beds located on the left and right hand sides, respectively, of the marquee.
2.3. Acquisition of real measurements
The acquisition of real measurements concerning the marquee, where it is evident the front view (Figure 9), right side view (Figure 10), left side view (Figure 11) and internal part (Figure 12).
2.4. 3D survey
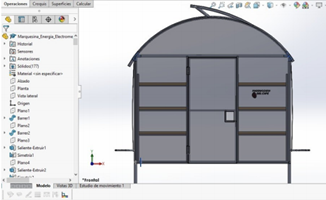
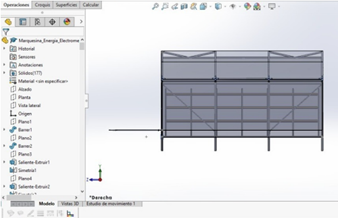
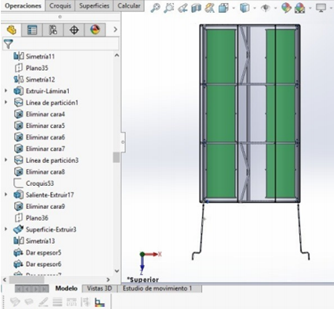
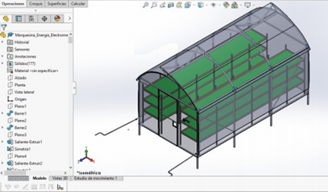
For taking measurements of the different components of the marquee, it is proceeded to make the survey in three dimensions; for this it is required an interactive software and different applications, both for learning technical drawing and for engineering analysis; SolidWorks is chosen [14]. In the following, it is detailed the front (Figure 13), right side (Figure 14), upper (Figure 15) and isometric (Figure 16) views.
2.5. Architectural presentation
For a better finish and future projection of a scale prototype, the model made by SolidWorks is converted to a real environment using the Rendering software [15] applied in the architectural field. Figures 17 and 18 present the isometric design made by Rendering.
2.6. Materials and costs
In parallel with taking the measurements, a revision of the materials that constitute the marquee was carried out. Table 1 presents the main elements.
The estimated costs of the materials that are available in the domestic market are indicated in Table 2.
2.7. Experimental design
The results of the analyses and the graphs regarding drying time and efficiency, were obtained from the statistical software STATGRAPHICS Centurion XV (Trial version 16.1.18) [16]. A factorial design of one or various factors was used as the experimental design. The theory of the efficiency of the collector of Duffie and Beckmen [17] was established in the thermal study. The following equation (1) is utilized for calculating the thermal efficiency of a greenhouse.
Where nempty is the percentage of thermal efficiency of the empty greenhouse, Cp is the air specific heat (kJ/kg °C); ma, mass flow of air; T0, initial temperature of the greenhouse; Ti, final temperature of the greenhouse; As area of the greenhouse and Is is the solar intensity on the wall and roof of the greenhouse.
3. Results and discussion
3.1. Analysis of the structural coupling
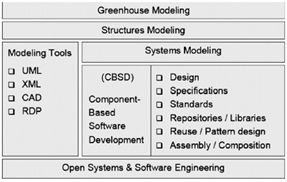
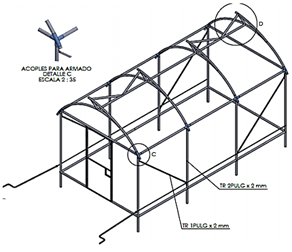
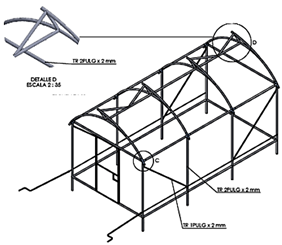
The software engineering techniques are utilized for modeling systems, specially the design and simulation of tunnel greenhouses. Traditional concepts of object oriented technology, are focused on developing software based on software engineering components, similar to the model-based design, the specification of the components and standards, applying the use of libraries and the reutilization of design structures [18, 19]. All these techniques are common in the design of greenhouses, as indicated in Figure 19. Figures 20 and 21 present the structure of the marquee made by SolidWorks, detailing the design of the coupling of assembly in the corners and in the rear part, indicating the type of tube and its specifications, with the purpose of providing an easy access of assembling and disassembling for its quick mobilization. When there is the need to model multitunnel greenhouses, methods that include concepts of reutilization, class hierarchy and succession are applied, which enable the user to have available different technological applications, with the purpose of constructing a series of basic blocks for manufacturing greenhouses, once the design has been revised. From this point of view, a greenhouse is no more than a series of blocks adapted to a space; the efficiency in the use of such space constitutes a critical issue [20].
3.2. Analysis of the shelving
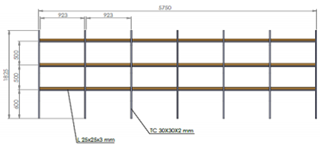
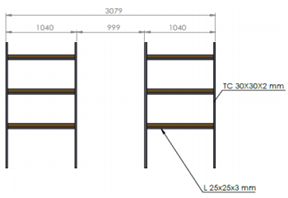
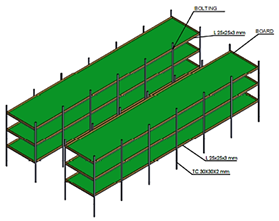
At present, the unified modeling language (UML) is utilized in different engineering disciplines for modeling systems, which enables to understand and describe the structure and operation of a system under study; for example, the UML is utilized in industrial systems: automotive sector [21, 22], teleoperation [20], robotics [22, 23], and production systems for monitoring [24]. Therefore, UML has been employed in the agricultural sector as a complementary technique for modeling greenhouses. The technique of Computer Aided Design (CAD) is used for the analysis of the shelving, as indicated in Figure 22, which shows the length and height, Figure 23, which shows the separation of the coffee drying beds and the type of tube employed with its specifications. At last, Figure 24 details an isometric view of the shelving constituted by six drying beds, and specifies the composite material and its dimensions.
3.3. Analysis, moisture – coffee drying time
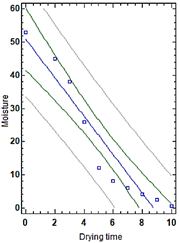
In order to estimate the relationship between moisture and coffee drying time, it is proceeded to perform a statistical analysis of linear regression, due to the little curvature exhibited by the plots in Figure 25, setting the moisture (%) as the dependent variable and the drying time (days) as the independent variable. Figure 25 indicates the plot of the model fitted, moisture – drying time, setting equations (2) and (3) as such model.
Table 3 presents the coefficients of the relationship moisture – drying time, where it is shown the estimated and incorrect parameters of the coffee drying.
From the statistical analysis, the following values were obtained:
-
Correlation coefficient = –0.952588
R-squared = 90,7424 %
R-squared, (titted for g. l.) = 89.5852 %
Standar error ofthe estimate = 6.28562
Mean absolute error = 4.83571
Durbin-Watson Statistical = 0.587605 (P = 0.0005)
Autocorrelation of residues in delay 1 = 0.60396
It can be seen in Table 4 that the P-value is smaller than 0.05, which indicates that there is a significant statistical relationship between moisture and drying time, with a confidence level of 95.0 %.
The statistical parameter R-squared indicates the fitted model, showing a 90.7424 % of variability in the moisture, and consequently the correlation coefficient is equal to -0.952588, which indicates a relatively strong relationship between the variables. The estimated standard error shows that the standard deviation of the residues is 6.28562 and the mean absolute error is 4.83571, since it is the average value of the residues. The Durbin-Watson (DW) statistical analysis indicates the residues with the purpose of determining if there is any significant correlation based in the order in which the collected data are presented. Since the P-value is smaller than 0.05, there is an indication of a possible serial correlation with a confidence level of 95.0 %, which means that the smaller the drying time in the greenhouse, the greater the percentage of moisture.
3.4. Analysis, Drying area – production
In places in which the solar drying has yearly productions smaller than 500 arrobas of dried parchment coffee, they usually occupy drying places such as marquees, canopies or parabolic dryers [25]. Table 5 presents a statistical summary showing the average and standard deviation of the samples. It should be taken into account that there is a difference of more than 3 to 1 between the smallest and largest standard deviations. This may cause problems because the analysis of variance assumes that the standard deviation of all the levels is equal, thus, the production of coffee in quintals is increasing.
Table 6 presents an ANOVA table, which decomposes the variance of the data in two components: one between groups and another inside groups. The F-ratio, which in this case is equal to 5.54178, is the quotient between the estimate between groups and the estimate inside groups, since the P-value of the F-test is smaller than 0.05; there is a statistically significant difference between the means of the three variables with a confidence level of 95 %, and thus, they are valid and accurate statistical samples in the production of coffee.
Table 7 shows the mean for each column of the obtained data, and the standard error of each mean, which is a measure of the variability of the sampling. The standard error indicates a result of dividing the pooled standard deviation by the number of observations in each level. In addition, it also marks a sample of interval around each mean.
The intervals currently shown are based in the procedure of the least significant difference (LSD) of Fisher; it is constructed in such a way that, if two means are equal, their intervals will overlap 95 % of the times, which can be graphically observed in Figure 26. Figure 27 indicates the relationship of the drying area with the production in arrobas of dried parchment coffee; it presents that in a drying area of 18 m2 of the marquee it can be produced around 1500 kg yearly.
3.5. Directional field of the heat flow inside the marquee
When Newton’s law is considered to study the effect with which a body reaches the internal temperature, as it is the case of the coffee bean inside the marquee, the temperature T of the coffee bean and the ambient temperature Ta are considered. Equation (4) is employed for studying the field of directions of the heat flow inside the marquee.
Constant K is the thermal conductivity of the medium, considering a controlled environment of 0,02 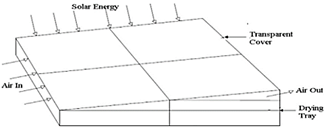 Importar imagen . The initial condition of the problem will be T(t0) = T0. The particular solution of the equation for time t0 = 0. (Equation 5).
From the measured temperature data inside the marquee it was established a Ta = 82Ľ, considering that there are not adiabatic losses for the analysis. The representation of the field of directions for the autonomous continuous ordinary differential equation (Equation 6, Equation 7) is shown in Figure 28, employing a set of meshed points. It can be appreciated an equilibrium point at the ambient temperature inside the marquee. It also occurs that the points below this point behave as attractor points that have an exponential growth.
4. Conclusions
The use of the marquee is applied to the drying of agricultural products, highlighting the drying of coffee, due to its great potential from the experimental and energy saving viewpoints. There are different types of solar dryers that have been designed and developed in some agro-industry sectors, producing different degrees of technical performance. The modular couplings made after the planimetric survey, have enabled to improve its mobility and adaptability. The values obtained regarding the relationship moisture and drying time of the coffee, exhibited a linear regression statistical analysis, setting the moisture as the dependent variable and the drying time as the independent variable resulting in a fitted model, showing a reduction of moisture with an increase of drying. In the analysis of variance of the moisture with respect to the drying of coffee it was obtained a Pvalue smaller than 0.05, which indicates that there is a significant statistical relationship between moisture and drying time with a confidence level of 95 %. In the analysis of production with respect to the drying area it was made a statistical summary based on an average of samples and standard deviation, and it was obtained a difference of more than 3 to 1 between the smallest and the largest standard deviations, thus it is assumed that the standard deviations of all levels are equal, providing a growth in the production of coffee. It was performed a variance of the data in two components: between groups and inside groups, giving a statistically significant difference between the means of the three variables with a confidence level of 95 %, indicating that the data obtained are valid and convenient statistical samples in the production of coffee. The intervals of moisture and drying area indicate the relationship of drying area with the production in arrobas of dried parchment coffee, for a drying area of 18 m2 there is the capacity of producing fifteen quintals yearly.


