I. INTRODUCTION
In recent years, access networks have evolved significantly to cater to the high demand for widely available and high-speed connectivity. These networks are characterized by their reach from the optical network terminal to the user premises. To address the growing number of users and ensure long-distance, high-speed information transmission, new wavelength multiplexing techniques have been explored to improve global connectivity. Emerging technologies must provide quality data, video, and voice services while being economical, scalable, and offering appropriate bandwidth to meet user requirements.
Passive optical networks (PONs) play a fundamental role in the growth and improvement of optical networks. They employ multiplexing techniques to share bandwidth and transmit multiple signals simultaneously over a single fiber. Multiplexing techniques are constantly evolving through various variants. These include techniques such as wavelength division multiplexing (WDM), Coarse Wavelength Division Multiplexing (CWDM), and Dense Wavelength Division Multiplexing (DWDM), each offering an increased number of channels per fiber and improved bandwidth.
Ultradense Wavelength Division Multiplexing (UDWDM) is the latest advancement in this field, an emerging technology with significant potential for next-generation access networks demanding higher bandwidth.
UDWDM is characterized by its ability to reduce the wavelength spacing between channels, enabling the utilization of an even higher bandwidth in PONs. This capability provides a solution to the stringent requirements of 50 technologies (1). With channel spacings as narrow as 6.25GHz, UDWDM can accommodate up to 1022 wavelengths over a single fiber optic channel, achieving cost savings and improving spectral efficiency.
This paper investigates the performance of UDWDM on a PON, building on previous studies of UDWDM systems. These studies focus attention on the analysis of non-linear effects that can degrade transmission in UDWDM-PON networks, such as stimulated Raman scattering (SRS), stimulated Brillouin scattering (SBS), four-wave mixing (FWM) and cross-phase modulation (XPM). In addition, software simulations were carried out using 7 channels, comparing BER values and received power and eye diagrams. The results indicate that these nonlinear effects limit the transmission of information to a BER rate greater than 10“ 9 at distances greater than 55 km, with a transmission power greater than 25 mW and at a speed of 10 Gbps. Furthermore, a maximum received power is observed at a transmission speed of 5 Gbps up to a maximum distance of 45 km. This research considers only a channel spacing of 25 GHz and a transmission rate of 10 Gbps (2).
In addition, studies by Sales, Segarra, Polo, and Prat (2015) have explored the operation of UDWDM-PON in conditions of low laser tuning, highlighting its operational viability in environments with limited resources. In another research, the same authors (2014) propose a half-duplex transmission technique to avoid Rayleigh backscatter crosstalk in UDWDM-PON using coherent receivers. These previous studies have significantly advanced knowledge in the efficient design and operation of UDWDM-PON networks, offering valuable information on key challenges such as laser tuning, transceiver cost, and crosstalk mitigation, thereby improving their performance and feasibility in practical environments (3).
A review of the theoretical foundation of UDWDM and PON networks is carried out to carry out this work. This includes knowing the basic concepts, spacing between channels, transmission capacity, and effects of channel separation, among others. Once the theoretical foundation has been reviewed, the study’s specific objectives are defined. Link budget calculation is then performed to determine if data transmission will be successful in the communications system. Subsequently, different scenarios are simulated in Optsim, using filters to limit the signal bandwidth and reduce interference between adjacent channels. Finally, the graphs of the results obtained in different scenarios are presented to compare the best performance.
II. BACKGROUND
This section begins by reviewing the concepts related to a PON network, its structure, and its operation. Then, the different types of multiplexing are described, such as WDM, DWDM, CWDM, and UDWDM, the latter of which is the main technology used in developing this work. For each of them, their main characteristics are mentioned regarding the capacity to transmit, a separation between channels, and advantages, among others.
Information is collected regarding the types of multiplexing, the most relevant information is extracted, and a comparative table of the four technologies is prepared. In addition, the standard, wavelengths per fiber, distance, spacing between channels, capacity, and cost are presented.
Subsequently, the design of the PON network using UDWDM technology is carried out. To do this, the current transmission standards and the analysis of requirements regarding the network elements are considered.
Three simulation scenarios are developed using a raised cosine filter, a Gaussian filter, and no filter. This study analyzes each channel’s individual performance, considering phenomena such as chromatic dispersion and attenuation. The objective is to determine the optimal configuration of the three evaluated channels.
Finally, the analysis of the results of the different simulation scenarios for each channel is carried out, where the BER vs. distance is compared for the different channel separations, varying the distance and transmission speed.
A. Theoretical framework
A passive optical network, as shown in Fig. 1, consists of a fiber optic distribution network that does not use active components to distribute the signal. In a PON network, point- to-point and point-to-multipoint architecture is used. Passive is understood when it does not require a power supply for the splitters, fiber, and combiners, unlike an Active Optical Network (AON: Active Optical Network), which does require it (4).
A PON network comprises the optical fine terminal (OLT: Optical Line Terminal), optical splitter, and various optical network terminals (ONT: Optical Network Terminal). In principle, a distinction can be made between point-to-point and point-to-multipoint PON. With a point-to-point PON, each subscriber is connected to the central OLT through its optical fiber. Therefore, each subscriber needs its connection port in the central office. With point-to-multipoint architecture, the subscriber’s optical fiber only extends from its ONT to the next switching point. From there, a shared optical fiber with multiple connections leads to the OLT of the switching center to connect users with the network operations centers, as is the case of fiber to the home (FTTH).
Splitters distribute the optical signal from the OLT to multiple users in a PON network. The OLT is the active network equipment at the central edge of the PON network that provides the termination point for optical fiber and manages data traffic between end users and the network. Splitters are placed at different points in the PON network to split the optical signal into multiple paths, which are then transmitted to the end users. By distributing the optical signal from the OLT, splitters allow a single fiber optic line to provide highspeed connectivity to multiple homes or businesses, thereby reducing the costs and complexity of network infrastructure (6).
PON technology has recently been the subject of significant research, standardization, and development efforts. Compared to other technologies, such as WDM, it is one of the preferred and best-positioned technologies for future broadband access. They are low energy consumption networks and reduce problems in the last mile, such as bandwidth limitations and signal degradation, greater reliability, and lower installation and maintenance costs (7).
B. Types of multiplexing
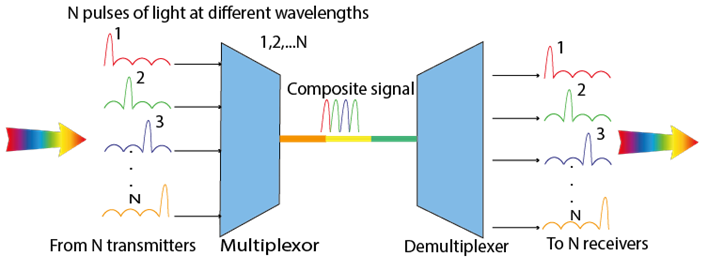
1) Wavelength Division Multiplexing (WDM): Optical wavelength division multiplexing (WDM) was proposed in the 1980s and became commercial in 1990. It is an optical transmission technique that combines multiple carrier signals in a single optical fiber using different wavelengths generated by laser light. WDM takes advantage of this by allowing multiple signals to be transmitted on a single fiber. Therefore, the fiber’s capacity is not doubled but rather multiplied by the number of signals that can be transmitted simultaneously over the same fiber. Uses a multiplexer to combine different optical signals from different transponders in a package, but with different wavelengths, and transmit them through a fiber (8) (9).
Figure 2 shows the multiplexing and demultiplexing process that is carried out. At the receiver end, the demultiplexer separates the optical signals with different wavelengths and sends them to the various transponders for further processing and restoration of the original signal. This is how two or more optical signals with different wavelengths are transmitted simultaneously over a single optical link. Each ONT works at different wavelengths. In this approach, the WDM PON architecture is similar to the PON architecture. The main difference is that multiple wavelengths operate on a single fiber, and ONTs operate at different wavelengths, avoiding user interference and better signal quality in each connection. This is because each wavelength can transmit a specific amount of information, the more wavelengths are used, the greater the amount of data that can be transmitted through the network, this is essential in networks that handle large amounts, of information (10) (11).
2) Coarse Wavelength Division Multiplexing (CWDM): Coarse Wavelength Division Multiplexing (CWDM) is a robust and relatively cost-effective method used to increase the bandwidth of an optical cable. This technology is governed by the regulations of the International Telecommunication Union (ITU) ITU-T 6.694.2 (13), establishing a separation of 20 nm. CWDM is limited in the number of channels, which typically has a maximum of 18 channels and can reach distances of up to 80 km (14).
Figure 3 shows that a CWDM system is composed of a multiplexer and a demultiplexer, which is used to combine multiple wavelength channels into a single fiber. This solution is effective in improving the capacity of an end-to-end deployed fiber. Optical signals are converted into signals of different frequencies with different wavelengths of optical carriers, where the received signals are combined during transmission, while, on the receiving side, the inverse transformation takes place (10)
A commonly used option in enterprise and telecommunications access networks is CWDM solutions, which primarily employ passive hardware components in a point-to-point topology to the backbone network, allowing the most efficient use of fiber capabilities over very long distances (15).
3) Dense Wavelength Division Multiplexing (DWDM): The primary characteristic of Dense Wavelength Division Multiplexing (DWDM) is that multiple information channels on different wavelengths are transmitted through a single optical fiber. This technology increases the bandwidth of a backbone network, allowing for more efficient use of fiber capabilities over very long distances (16).
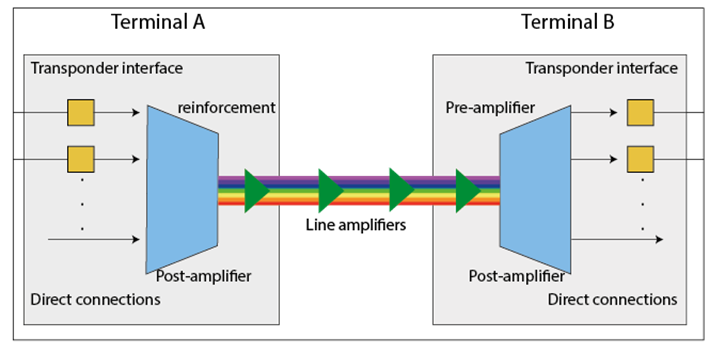
Figure 4 illustrates a DWDM system that leverages the optical fiber’s ability to transmit light simultaneously at different wavelengths without mutual interference. Each wavelength represents a separate optical channel (17). This technology enhances the performance of an optical system by achieving lower attenuation, as its main advantage is high-speed transmission over ultra-long distances, which can reach up to 4000 km without regeneration. However, the maximum transmission distance depends on various factors, such as the quality of the fiber, the quality of the DWDM system components, and the number of optical amplifiers used in the network. To improve the bandwidth of optical lines based on DWDM, it is possible to progressively add new optical channels to the existing equipment as the network develops (16).
An important device in DWDM is the optical transponder, an essential component to convert signals from customer equipment to signals compatible with DWDM technology for transmission over the main fiber. Additionally, transponders are used for signal regeneration, which involves restoring the signal’s amplitude, shape, and timing. In most cases, the optical-electrical-optical procedure is used to perform this task, which includes conversion of an optical signal to electrical, 2R or 3R regeneration (reamplification, reshaping and retiming), and then reverse conversion of the regenerated signal back to an optical signal (9).
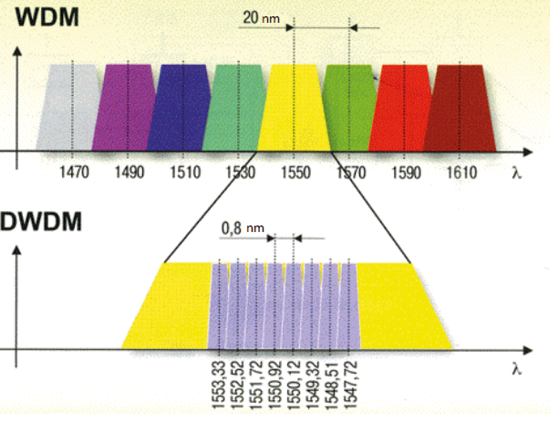
In Fig. 5, the channel spacing comparison between WDM and DWDM is illustrated, a key factor distinguishing the two technologies. WDM technology typically employs a wider channel spacing, usually around 20 nm, whereas DWDM technology utilizes a significantly smaller spacing, typically around 0.8 nm. This discrepancy implies that DWDM can accommodate a significantly larger number of channels than WDM within the same optical fiber.
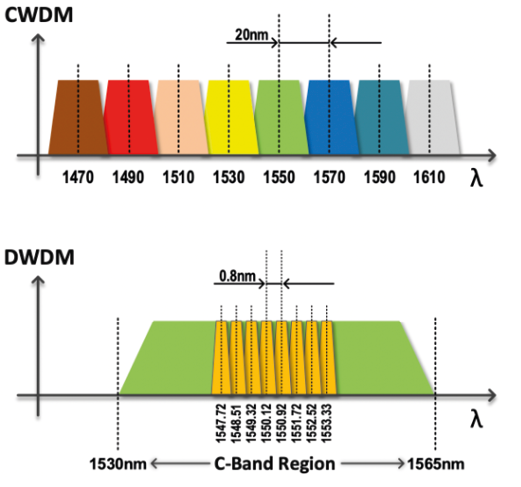
DWDM can be compared with WDM and CWDM, with several key differences. Fig. 6 demonstrates the channel spacing between CWDM and DWDM. The primary characteristic is the 20 nm channel separation for CWDM, allowing for multiplexing up to 18 different channels on a single pair of optical fibers. It serves as a suitable option for shorter distances and low-capacity applications. Conversely, DWDM employs a much denser separation, typically 0.8 nm, making it a preferred choice for high-capacity applications and longer distances (15).
C. Ultra Dense Wavelength Division Multiplexing (UDWDM)
Ultra-Dense Wavelength Division Multiplexing (UDWDM) is one of the most current technologies for access networks and is based on WDM PON. The spacing between channels is much narrower than DWDM; it is characterized by allowing for greater bandwidth compared to the other technologies mentioned above. It allows up to 1022 wavelengths to be sent through the same medium. It takes better advantage of a single optical fiber channel, achieves cost savings, and improves spectral efficiency in a communication system (11) (20).
If UDWDM is compared with WDM, it is observed that UDWDM uses a power divider which consists of an important component in the distribution network, it is important to note that thanks to this, each ONT would have the possibility of access to all the wavelengths (20).
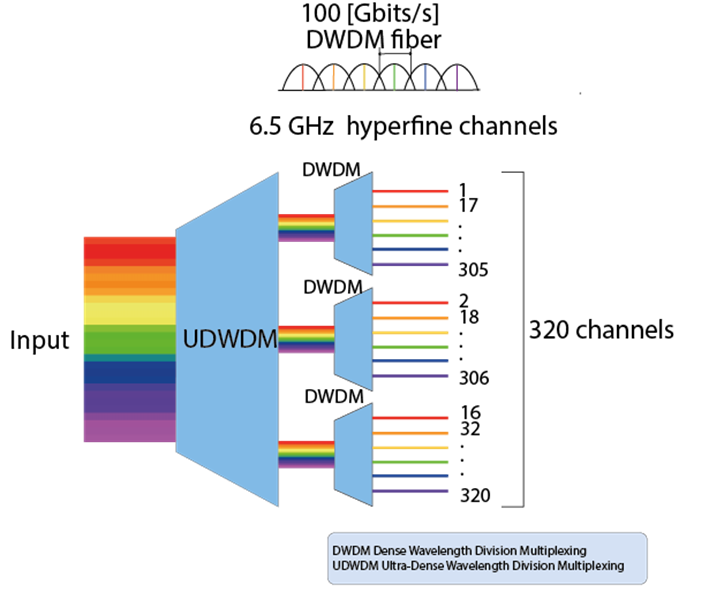
In UDWDM, coherent detection can be inserted to obtain better sensitivity and high selectivity in the receivers of the OLTs and ONTs. Regarding the receiver’s sensitivity, it should be noted that this important aspect allows for a high division factor in the power divider, which means that several ONTs can share the same distribution network. Likewise, high selectivity allows for greater spectral efficiency compared to other architectures, such as WDM, whose usability may be limited by factors such as the available bandwidth of the optical fiber and the quality of the light sources, used to generate optical signals (20). Fig. 7 shows the separation of 320 channels transmitted by an optical fiber. Initially, a device is observed with 16 UDWDM channels separated at 6.25 GHz, where each group has a capacity of 100 GBits/s. From channel 1 to channel 16 there are different outputs, while channel 17 is routed to the same output of channel 1, this is done consecutively. Each set of 16 channels has a capacity of 100 Gbps. Following this, conventional DWDM systems separate multiple channels, entering each of the 16 ultra-dense outputs, resulting in 20 separate outputs on their channels at 100 GHz (21).
Table I summarizes the WDM, CWDM, DWDM, and UDWDM technologies. The most notable differences include channel spacing, wavelengths per fiber, transmission capacity, and distance
D. Raised cosine filter
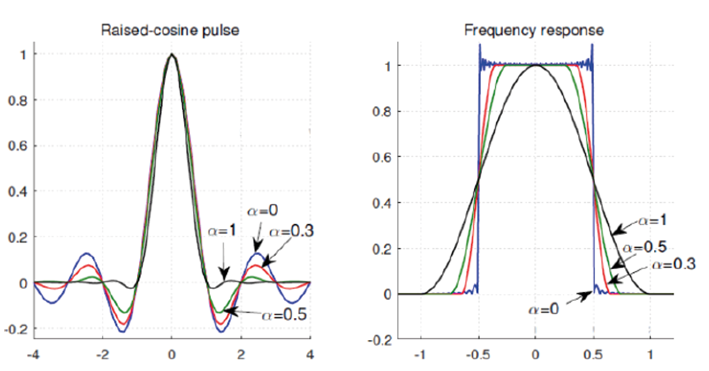
A raised cosine filter is used to modify a signal’s waveform before its transmission. This tool is commonly applied in digital modulation systems, where its main function is to prevent the effect of Inter Symbol Interference (ISI) by limiting the bandwidth of the transmitted signal. The frequency response and impulse response of the raised cosine filter are important characteristics of this type of filter. Therefore, it is necessary to understand how it behaves at different frequencies and how it affects the amplitude and phase of the processed signal. Fig. 8 shows the impulse response (left) and the frequency response (right) of a raised cosine filter. The filter’s frequency response is wider than that of the ideal low-pass filter due to the transition band present in the filter. This excess bandwidth is controlled by a parameter known as the roll-off factor. The frequency response can be graphically visualized for different values of the roll-off factor: 0.3, 0.5, and 1. The impulse response exhibits similar characteristics to the impulse response of the sine function, where zero crossings occur at intervals of time T, so that the signal with smaller amplitude lobes has a larger excess bandwidth or a broader spectrum (22).
E. Gaussian Filter
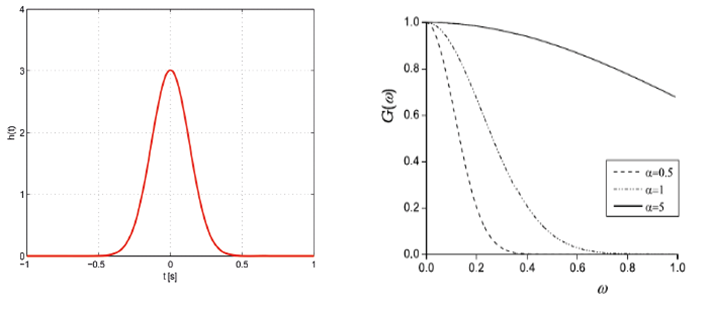
Gaussian filter is used in signal processing, information theory, and signal encoding. Gaussian function is an optimal solution to maximize the information transmitted through a communication channel with additive Gaussian noise. Fig. 9 shows the impulse response (left) and frequency response (right) of the Gaussian filter. The impulse response of the Gaussian filter closely approximates a Gaussian function. These filters possess the property of reducing the overflow effect. Simultaneously, they minimize the rise and fall times. This behavior is largely attributed to the Gaussian filter having the minimum possible group delay. Group delay is the time it takes for a wave of a certain frequency to propagate through the filter. On the other hand, the frequency response refers to the filter’s behavior when a sinusoidal input signal is applied in the frequency domain. One of the characteristics of the Gaussian filter is its standard deviation, represented by the symbol sigma (a), which determines the shape of the filter’s impulse response and frequency response. A larger standard deviation results in a wider impulse response and a smoother frequency response, while a smaller standard deviation leads to a narrower impulse response and a higher attenuation of higher frequencies in the frequency response (24).
These filters reduce the overflow effect or overflow on a step function input while minimizing the rise and fall time. This behavior is largely because the Gauss filter has the minimum possible group delay. The group delay is the time it takes for a wave of a certain frequency to propagate through the filter. On the other hand, the frequency response is the filter’s response when a sinusoidal input signal is applied to it in the frequency domain. Frequency response is measured in terms of the amplitude and phase of the output signal as a function of the input frequency (24).
One of the characteristics of the Gauss filter is its standard deviation, represented by the sigma symbol cr, which allows for determining the shape of the filter’s impulse response and its frequency response. A larger standard deviation produces a wider impulse response and a smoother frequency response. A smaller standard deviation produces a narrower impulse response and a frequency response with greater attenuation of higher frequencies (24).
F. Electrical bessel filter
It is a frequency-selective device that passes signals in a desired frequency band, called the pass band, and blocks signals of other frequencies related to the stop band, which is the area where the input signal is completely suppressed. It allows the linearity of the phase-frequency characteristic within the bandwidth. Among the main advantages is the flat and frequency-proportional shape of the phase response in the transmission region, as it lowers distortion of signals with components at different frequencies (26). The methodology used to design and simulate the UDWDM PON network is presented below.
III. METHODOLOGY
This section presents the design and simulation of a UDWDM-based PON implemented using Optsim software. UDWDM is a technology still under research and does not yet have a standard from the ITU or any other organization. Therefore, we have considered the ITU G.694.1 recommendation for this work, which standardizes DWDM. This recommendation establishes all the requirements for the interoperability of DWDM networks, including transmission power parameters, wavelength ranges, signal spectrum, attenuation, and optical noise levels. Additionally, it provides guidelines for the design of DWDM networks, encompassing parameters for optical fiber links, safety requirements, and nominal central frequencies.
The first step in designing the PON is to calculate the budget of the optical link, which includes analyzing factors such as transmission distance, fiber type and attenuation, transmitter power, and losses from connectors and splitters. This calculation is essential to determine the amount of optical power reaching the receiver and to ensure it is sufficient for high-quality transmission. The system requirements are also described, considering the transmitter, receiver, and communication channel. Subsequently, network simulations are conducted under different scenarios. In the first scenario, the PON network is simulated without signal filtering at the optical level. In scenarios two and three, a raised cosine filter and a Gaussian filter are used to optimize the results of the first scenario, both applied at the optical level. The channels in this study are separated by 25 GHz, 20 GHz, and 15 GHz, and for each separation, transmission rates from 10 Gbps to 17 Gbps are configured at various distances ranging from 10 km to 20 km.
A. Calculation of Optical Link Budget
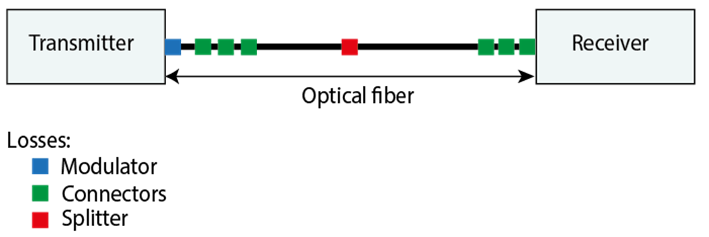
The optical budget is the maximum allowable link attenuation from the OLT to the furthest ONT. This is a crucial indicator in PON network design because it helps determine the maximum possible length of the optical line in the transmitterreceiver section during the design phase. The optical power budget consists of the difference between the power from the transmitter and the receiver’s sensitivity at the ONT (27). The optical budget calculation is performed for a case where the distance is 10 km. The number of splices should be considered for greater distances, each contributing an additional attenuation value ranging from 0.1 dB to 0.5 dB, with 0.3 dB being an acceptable average value. This means that if there are more splices in the transmission, an additional value must be added to the optical budget calculation to account for the increased attenuation. Fig. 10 presents a diagram indicating the losses of each network component, such as connectors, splitters, and modulators, which contribute to signal attenuation. Table II provides the values for the optical budget calculation obtained from the manufacturer’s datasheet (28) (29).
Equation 1 tato the formula used to calculate the link budget, in which we sum all the predefined losses. To obtain the losses from the fiber, we calculate the product of attenuation by the length of the optical fiber (30). Additionally, we consider the losses introduced by elements such as the modulator, splitters, and connectors. The operational margin is an increment that we budget in advance, anticipating possible additional losses due to fiber degradation, connector deterioration, cable accidents, etc.
where:
Ptx - Transmitter Power
Lt - Total Link Loss
G - Gain
M - Margin
S - Receiver Sensitivity
By replacing the values into Equation 1, the sensitivity S of the receiver is (Eq. 2):
According to ITU G.984.2 recommendation, the standard sensitivity in PON is -30 dBm or 0.001 mW for OLT and -26 dBm or 0.0025 mW for ONT, respectively (31). The calculated receiver sensitivity of -22 dBm falls within the standardization limits.
After calculating the optical link budget, the next step is to utilize simulation tools to analyze and optimize the network design further. The following section details the tools and methodologies employed in this study.
B. Simulation Tools
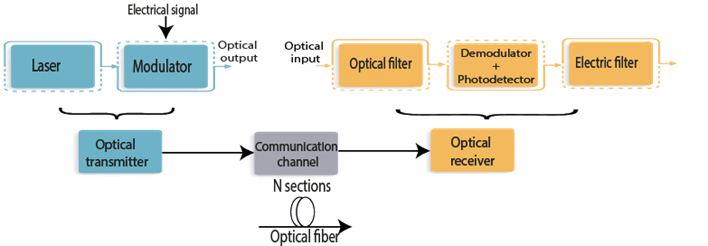
OptSim, developed by RSoft, is used for the simulation. It is a leading tool in the simulation of optical communications and is widely used. This software offers an intuitive graphical interface and an extensive library of optical, electrical, and digital components, facilitating precise parameter configuration and efficient simulation of complex systems. The simulated data were then processed and represented in MATLAB. Combining these tools allowed for a detailed analysis and precise graphical representation of the results obtained. The optical communication system simulation comprises a transmitter, a receiver, and a communication channel, as depicted in Fig. 11.
Once the tools to be treated were known, various simulation techniques were employed to explore different scenarios and optimize the network design. The following sections detail the different simulated scenarios, each with its respective configurations and analysis of results. These scenarios provide a comprehensive view of the system’s feasibility and performance under various operational conditions.
C. First scenario: Simulation without using a filter on transmission side
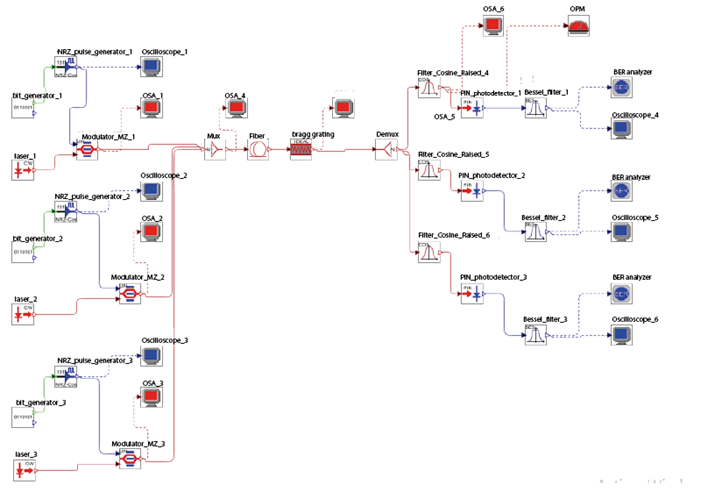
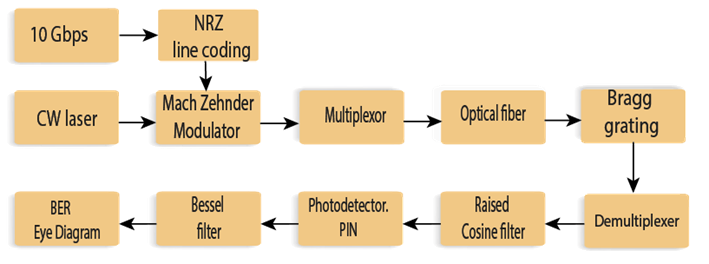
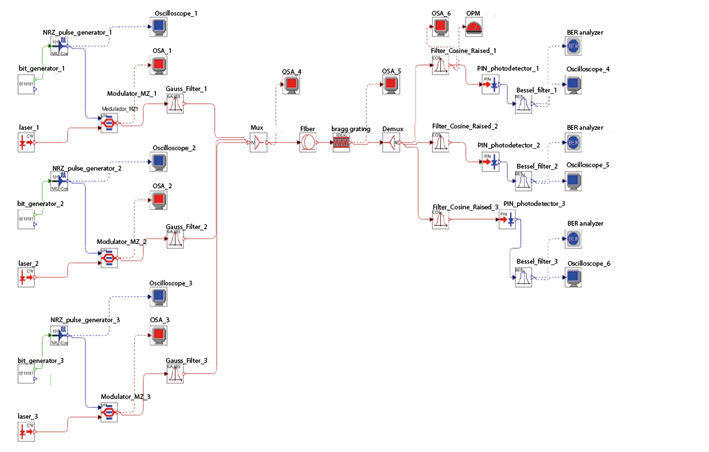
The first scenario is represented in Fig. 13 through a block diagram and in Fig. 12 in the simulator. In the transmitter, a CW laser is incorporated with a different central frequency depending on the channel spacing, and the configuration parameters are specified in Table IV. The signal is modulated using a Mach-Zehnder modulator. The configuration parameters of the modulator are provided in Table III. Excessive losses and reduction in average power due to modulation must be considered when calculating the optical budget, as they cause attenuation in the link. These values are obtained from the manufacturer’s data sheets (33).
A pseudo-random bit sequence (PRBS) generator is also used at a data rate of 10 Gbps, depending on the bit rate (between 10 Gbps and 17 Gbps), and NRZ pulse generation for the encoding technique. The multiplexing process is carried out with an insertion loss of 3.5 dB, where the signal is transmitted through the communication channel composed of optical fiber and a Bragg grating, with a length of 10 km, as appropriate (between 10 km and 17 km).
Table V presents the most important configuration parameters of single-mode optical fiber that comply with the ITU-TG.652D recommendation. This type of fiber allows improved performance in high bandwidth and long-distance applications in addition to transmission in an extended wavelength range of 1310-1550 nm (34).
Currently, the Bragg grating is used in multiplexing channels along the wavelength. It allows compensation for chromatic dispersion in the communication channel, obtaining greater efficiency, resource savings, better measurement precision, etc.
The optical receiver’s main function is to transform the optical signal received at the fiber output into the original electrical signal. It comprises a raised cosine optical filter, a PIN photodetector, a demodulator, and a Bessel electrical filter (transmitter).
Here, the signal is filtered through a raised cosine filter and detected by a PIN photodetector to obtain the optical signal. The resulting signal is then filtered again with a Bessel low- pass filter connected to the BER analyzer to verify the signal quality through the BER value and the eye diagram shape (35). The configuration parameters for the Bessel filter are specified in Table VI. Among the configuration parameters of the PIN photodetector shown in Table VII is the dark current, which is the current that flows through the load in the absence of optical radiation. This current causes shot noise and limits the sensitivity of the optical receiver. Quantum efficiency, on the other hand, is a factor that accounts for the fact that, generally, not all absorbed light quanta lead to the generation of current pulses (36).
In Table VIII, separations of 25 GHz, 20 GHz, and 15 GHz are considered, with three channels where different wavelengths are transmitted for the 3 scenarios. For example, for a spacing of 25 GHz, the center emission frequency of each CW laser is set as follows: λ1 = 193.100 THz, λ2 = 193.125 THz, and λ3 = 193.150 THz; where λi, λ2, and λ3 are the terahertz wavelengths for channel 1, channel 2, and channel 3, respectively. The same process is carried out for frequency distances of 20 and 15 GHz.
After completing the initial scenario, it has been decided to present two additional scenarios in the design of the PON network using UDWDM technology in conjunction with optical filters. This analysis with filters is crucial for evaluating and selecting the optimal solution. Critical factors will be considered, such as improving transmission quality, reducing data errors, expanding network coverage, and enhancing system reliability. The filter selection process will be conducted to ensure that the chosen solution meets the specific requirements of high efficiency and connection quality, which are essential in advanced optical communication environments.
D. Second scenario: Simulation using a Raised Cosine Filter
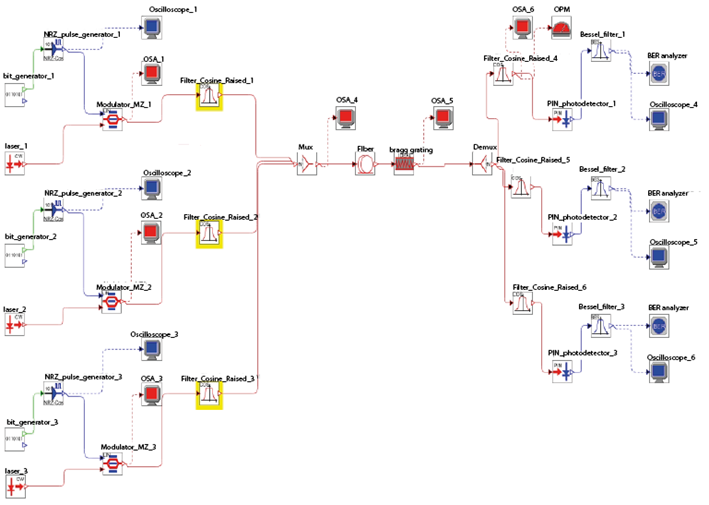
Similar to the previous case, this scenario is depicted in Fig. 15. To improve the results of the previous case, a raised cosine filter is applied at the optical level before the multiplexing process. This filter models the pulses in digital modulation due to its ability to minimize ISI. The lift constant is adjusted as a function of the signal’s symbol rate and amplitude ratio. No changes are made to the communication channel section. At the same time, at the receiver, a second raised cosine filter is set upstream of the PIN photodetector with the same center frequency for each channel. If the second filter has the same characteristic, the signal at its input will repeat its impulse response, which means the filter will adapt to the given signal.
Table IX displays the configuration parameters of the filter, with a roll-off factor of 0.5. This value allows controlling the degree of smoothing relative to the frequency response of an ideal filter, which corresponds to the level of the side lobes of the impulse response. The suitability of the filter’s usage is verified by using the BER analyzer to assess signal quality through BER and the eye diagram. The same procedure as in the first scenario should be followed to configure the channel spacing. Fig.14
E. Third Scenario: Simulation using a Gaussian Filter
In this scenario, a Gaussian filter is used, an electrical filter whose transient pulse function is Gaussian. It is designed to have no overshoot in the transient response and to maximize the time constant. In other words, there will be no temporal increase in the filter response that exceeds the input signal level, ensuring higher signal quality in the output (37). The filter is configured with the parameters from Table X and with the same central frequency as appropriate for each channel (Table VIII). In the communication channel and at the receiver, the configuration is the same as in scenarios one and two. Finally, the BER analyzer is also used, automatically calculates its value and displays the eye diagram.
The following section presents the results obtained from the methodology section.
IV. RESULTS
We present and analyze the results by simulating the three scenarios. Each scenario is described in detail, and the results are illustrated with graphs showing BER vs. distance diagrams. These graphs provide a clear understanding of how the bit error rate (BER) varies with distance in each of the simulated scenarios.
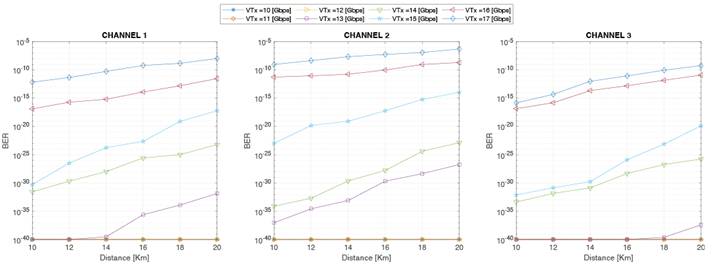
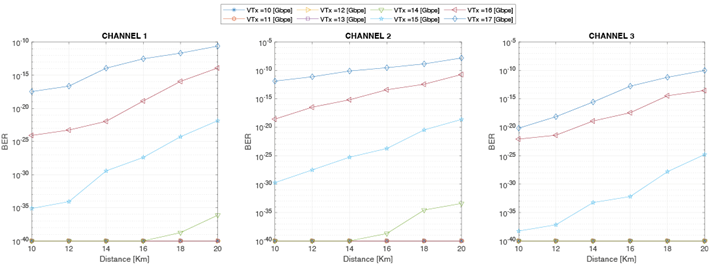
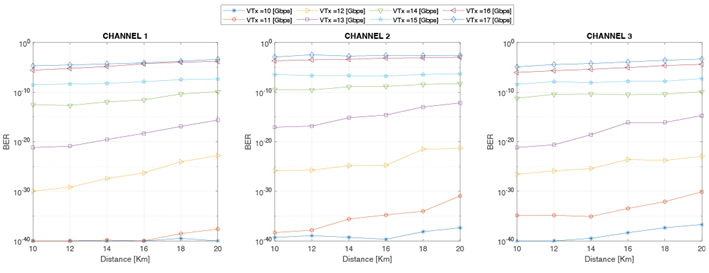
Channel Spacing of 25 GHz: Fig. 16 shows the performance of the three channels in terms of BER, where the lower BER curve indicates better signal quality and higher transmission capacity. It’s important to clarify that for this study, BER values of 10-9 have been considered, as recommended by the ITU, when no forward error correction is used. Below are the results obtained for the first scenario for each channel.
1. Results of the first scenario: Simulation without a filter on the transmission side:
Channel 1: For a distance of 10 km to 12 km at a transmission rate of 10 Gbps to 12 Gbps, a constant BER of 10-40 is obtained. However, for distances ranging from 14 km to 20 km at a transmission rate of 13 Gbps, the BER increases from IO-40 to 10-32. From a transmission rate of 14 Gbps to 17 Gbps, the error rate grows as it increases. Nevertheless, transmission is still possible up to 18 km, considering that 10-9 is an acceptable BER value, meaning that transmission limits are being approached. Beyond 20 km and transmission speeds exceeding 17 Gbps, attenuation and noise in the transmission medium significantly affect signal quality, increasing BER.
Channel 2: In the case of the second channel, it can be observed that channel 2 is the most affected by phenomena like attenuation, which increases with iber length and distance, affecting transmission. This means that signal intensity decreases as it propagates through the optical fiber, causing the signal to weaken. For example, at 16 Gbps and a distance of 10 km to 12 km, a BER of 10-23 is obtained, progressively increasing to IO-20. At a longer distance of 20 km, the BER increases to 10“14.
Channel 3: For this channel, at transmission speeds ranging from 10 Gbps to 13 Gbps and distances from 10 km to 18 km, the BER is 10-40 with a variation from 10-40 to 10-37 when the distance increases to 20 km, due to emerging optical phenomena in the channel. However, at 14 Gbps and 15 Gbps, despite increasing to 10-33 and IO-20, respectively, the BER remains within an acceptable range, meaning it is less than 10-9. The BER values in channel 3 indicate that it performs better than channels 1 and 2. In optical communication systems, a high BER of 10-8 indicates transmission errors, meaning that the received signal differs from the transmitted signal. This can result in decoding errors, transmission delays, and data loss.
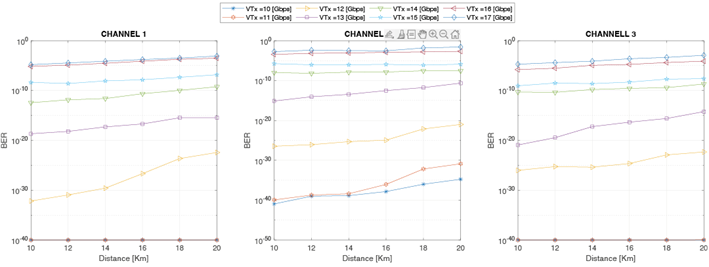
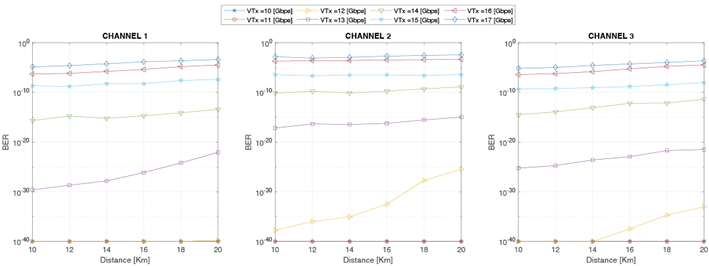
Channel Spacing of 20 GHz: To verify the behavior of the channels, their spacing is reduced from 25 GHz to 20 GHz. Fig. 17 shows the results of BER vs. distance for the three channels, and the following descriptions are provided for each channel:
Channel 1: When comparing the values in Fig. 17 with those in Fig. 16, it can be observed that the BER remains constant at 10-4° for transmission speeds of 10 Gbps and 11 Gbps. Similarly, the error rate progressively increases with distance and transmission speed at a 20GHz spacing, from 12 Gbps to 17 Gbps. The greater the distance between the transmitter and receiver, the more noise there will be in the signal. This affects signal quality, meaning that the BER increases from 10-33 to 10-3, where 10-3 is no longer considered an acceptable BER. These values allowed the BER figures to be drawn up, where it is observed that as the transmission speed increases, the chromatic dispersion of the signal becomes more pronounced. This means that the effect of chromatic dispersion on the signal becomes stronger as the transmission rate increases, resulting in a higher BER.
Channel 2: As mentioned earlier, Channel 2 is the most affected by attenuation and chromatic dispersion phenomena. While previously, at a 25GHz channel spacing, the BER remained constant at 10-40 for transmission speeds of 10 Gbps and 11 Gbps, this is no longer the case at 20GHz due to signal degradation as it propagates through the transmission channel, contributing to the increase in BER. For 12 Gbps and 13 Gbps transmission speeds, the BER is acceptable in the 10-27 to 10“10 at distances from 10 km to 20 km. However, from 14 Gbps to 17 Gbps, even at short distances like 10 km, the error rate is significantly high, ranging from 10-8 to 10-3. The transmission does not meet the maximum BER limit of 10-9.
Channel 3: Regarding Channel 3, for a bit rate ranging from 10 Gbps to 15 Gbps at distances from 10 km to 20 km, the UDWDM system is reliable because the BER is in the range of 10-40 to 10-9, allowing for stable transmission. This indicates that the channel can maintain signal quality without being affected by disturbances or noise. However, there is poor transmission performance for a bit rate of 16 Gbps and 17 Gbps because the BER is high, ranging from 10-6 to 10-4 at distances from 10 km to 20 km.
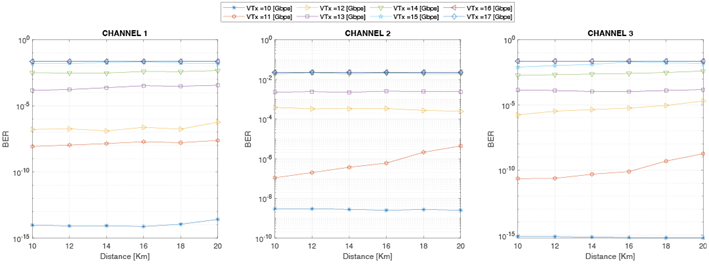
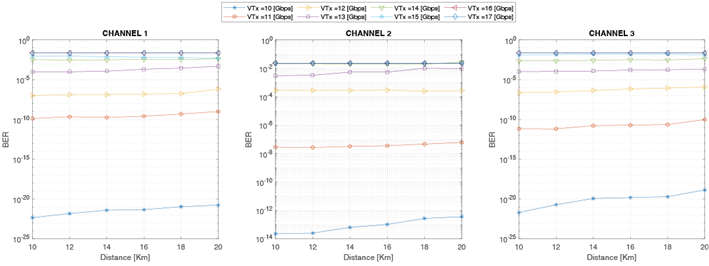
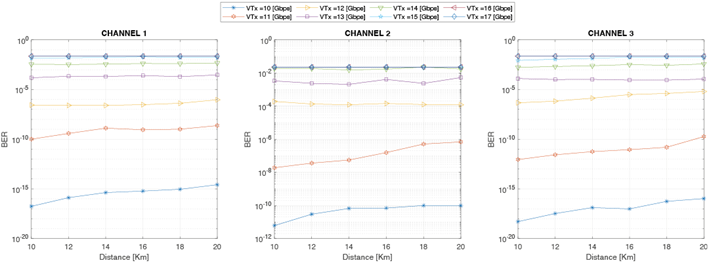
Channel Spacing of 15 GHz: Fig. 18 demonstrates that the BER values are worse than for the other channels’ spacing. There are some exceptions for each channel described below.
Channel 1: It can be observed that effective transmission is only achievable at a rate of 10 Gbps in a distance range between 10 km and 20 km, with an approximate BER value of 10-15. However, transmission is compromised for higher bit rates ranging from 11 Gbps to 17 Gbps because the signal quality deteriorates due to optical phenomena affecting the channel, reflected in the BER values increasing to 10-8. This 15GHz channel spacing impacts all three channels because the wavelength of each channel is slightly different and can cause distortion in the transmitted signal because the channels are relatively close to each other in frequency. This 15GHz spacing demonstrates that channel spacing significantly impacts transmission quality, meaning that distortion or interference in one signal can extend to adjacent channels and affect the signal’s quality.
Channel 2: After conducting the simulation for this channel, it can be observed that efficient transmission is not achieved for any of the transmission speeds (10 Gbps to 17 Gbps) because the signal is attenuated. The BER is 10-8, which is a high value. These results are due to interference from adjacent channels, attenuation, and chromatic dispersion, among other factors. In the case of adjacent channels in a multiplexing system like UDWDM, the spacing between them is critical to minimize interference and ensure transmission. Therefore, it is recommended that research efforts be continued to improve trans mission, especially at high speeds.
Channel 3: After analyzing the channel, the best BER value obtained for this case is 10-15 at 10 Gbps, progressively increasing from 10-11 to 10-9 when reaching 11 Gbps. For the remaining transmission speeds (12 Gbps to 17 Gbps), there is no reliable data transmission, meaning the BER is high (10-8 to 10-2). This means that a significant number of the transmitted bits are not received correctly at the receiver. Due to these values, the channel is not valid for these speeds.
2. Results for the second scenario: Simulation using a raised cosine filter:
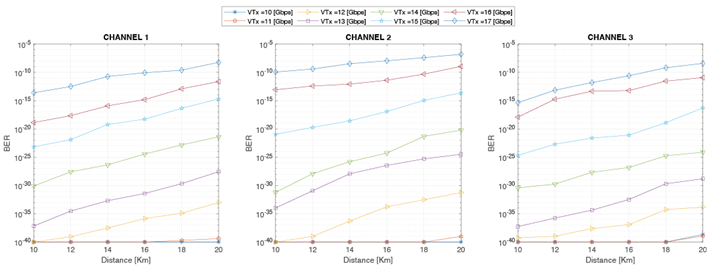
Using the raised cosine filter allows us to verify if the performance is adequate to optimize the results of the first scenario. The configuration is done for channel spacings of 25 GHz, 20 GHz, and 15 GHz. Fig. 19 presents the BER vs. distance values with a raised cosine filter and a channel spacing of 25 GHz. When comparing the BER results from Fig. 16 with the same channel spacing, it can be observed that the channel’s performance improved for all bit rates. In Channel 1, a BER of IO-40 is achieved for a transmission rate from 10 Gbps to 14 Gbps over distances ranging from 10 km to 20 km. It then gradually increases, and finally, a permissible BER of 10 10 is reached at 17 Gbps.
Similarly, for transmission rates from 10 Gbps to 15 Gbps, in channel 2, the BER value is improved in the range from IO-40 to 10“18 compared to the results in the BER vs. distance without a filter (Fig. 16), where the BER values range from 10-4° to 10“14. Meanwhile, within the range of 10 km to 18 km, at 17 Gbps using the filter, the BER values range from 10“12 to 10-9, in contrast to the results without a filter where the BER values are greater than 10-8 starting from 12 km. At 20 km, the signal quality is lost due to propagation over longer distances through the optical fiber, which experiences attenuation and distortion.
For channel 3, it exhibits proper functionality, significantly better than channels 1 and 2, as it achieves lower BER values for all transmission rates (10 Gbps to 17 Gbps) ranging from 10-4° to 10-1°. These lower BER values indicate fewer erroneous bits in channel 3.
Fig. 20 shows the BER vs. distance values using the raised cosine filter and a 20GHz channel spacing. When comparing the BER values in Fig. 17 with those in Fig. 20, we can see that for channels 1 and 2, the data transmission rates for which the filter is more effective range from 10 Gbps to 14 Gbps, achieving BER values between 10-4° and 10-1°. However, for channel 3, the filter is effective up to 15 Gbps, achieving BER values as low as 10-9 compared to the simulation without a filter. For the remaining transmission rates (16 Gbps and 17 Gbps), the BER is similar to not using the filter, with values ranging from 10-6 to 10-3. Therefore, the closer the channels are in wavelength, the more unwanted optical phenomena appear. Undesirable effects such as attenuation and chromatic dispersion impact the quality of the transmitted signal.
Comparing the results from Fig. 18 with the results from Fig. 21, it can be observed that, when using the raised cosine filter with a 15GHz channel spacing, all three channels improve the BER values at 10 Gbps. In the case of Channel 1, good performance is also achieved at 11 Gbps, with a range of BER values from 10-22 to 10-9. On the other hand, in Channel 2, when the filter is not used, there is no transmission for any bit rate, but with the filter at distances of 10 km to 20 km, transmission is achieved only at 10 Gbps, with a BER ranging from 10“14 to 10-12. Finally, at a transmission rate of 11 Gbps, Channel 3 shows improved BER values, decreasing from 10“15 without the raised cosine filter to 10-22 when using the filter.
From the simulation results with different channel spacings (25 GHz, 20 GHz, and 15 GHz) and for specific transmission rates, it is evident that the raised cosine filter yields better BER values than the first scenario. This filter optimizes the performance of the optical channel in terms of system efficiency and the quality of the transmitted signal. This is demonstrated when the BER values fall within 10-40 to 10-9. However, using the filter is not always beneficial, as observed in cases with transmission rates exceeding 15 Gbps and channel spacings narrower than 15 GHz, which result in increased BER.
There are several reasons why the raised cosine filter may be insufficient. First, signal dispersion in the optical medium can affect the filter’s frequency response, especially at high transmission rates exceeding 17 Gbps. Another reason is the long fiber span; if the signal travels a long distance through an optical fiber (more than 20 km), the raised cosine filter may not compensate for chromatic dispersion. Additionally, the highspeed optical signal and noise in the optical medium can affect the efficacy of the raised cosine filter. As the signal speed increases, the duration of each bit of the signal decreases. This can lead to bit overlap or ISI, distorting the signal waveform. Under these conditions, the signal may experience significant attenuation, and the BER would also increase, ultimately impacting transmission quality.
3. Results of the third scenario: Simulation using a Gaussian filter:
In this section, we compare the results using the Gaussian filter (Fig. 22) and without a filter (Fig. 16). The objective is to analyze the efficiency within the optical channel compared to the first scenario. When analyzing the quality of transmission in the channels 1, 2, and 3 separated by 25 GHz, it is observed that the use of the Gaussian filter results in an increase in BER compared to when it is not used, especially for transmission speeds between 10 Gbps and 15 Gbps. This is because the Gaussian filter has a wider bandwidth than the raised cosine filter, which could cause more ISI between nearby channels and reduce signal quality. However, the BER slightly improves when using the filter for 16 Gbps and 17 Gbps transmission speeds. In conclusion, the filter is not always very efficient under these conditions, and its use will depend on the specific characteristics of the application and the optical transmission system.
Fig. 23 shows the BER values vs. distance with a Gaussian filter and 20 GHz channel spacing. The BER values for channels 1 and 2 increase compared to the BER values from Fig. 17 without using a filter. For example, in Fig. 23, for channel 1, at a transmission rate of 12 Gbps and a distance of 10 km, the BER value is IO-30, whereas for the same transmission rate and distance without using the filter (Fig. 17), the BER value is 10-32. Comparing these two values, it is observed that the BER increases when the filter is used. The same applies to channel 2 and the other transmission rates.
In channel 3, at a transmission rate of 11 Gbps without using the filter, as the distance varies from 10 km to 14 km, the BER values increased from 10-40 without a filter to 10-35 with a filter. The analysis for other distances and transmission rates is similar. Therefore, using the filter, instead of reducing bit errors, increases them, while at transmission rates of 15 Gbps to 17 Gbps, the BER values are similar.
In the last test with the filter, a 15GHz channel spacing was used (Fig. 24). In channel 1, when comparing the BER values from Fig. 18 where no filter is used with the BER values from Fig. 24 using the Gaussian filter, it can be observed that at a transmission rate of 10 Gbps and a distance of 10 km, the BER values decrease from 10“16 to 10“14 compared to when the filter is not used. In channel 2, although the BER value decreases slightly when transmitting at 11 Gbps, it does not reach the threshold recommended by the ITU of 10-9; the same happens for the rest of the transmission rates.
Regarding channel 3 in Fig. 24, for transmission rates of 10 Gbps and 11 Gbps, they achieve the best BER, meaning that this value is less than 10-9, while for the rest of the transmission rates, the BER value is greater than 10-9, indicating more errors in data transmission and, consequently, a decrease in the quality of the transmitted signal.
A. Filter Comparison
The performance of the Gaussian filter raised cosine filter, and no filter is evaluated below by estimating the BER to determine which is more suitable for this specific application in a UDWDM system. Table XI shows the obtained BER results at a distance of 10 km, a transmission speed of 10 Gbps, and a channel separation of 25 GHz. The green color highlights that the BER values for all three channels in all three scenarios are acceptable, meaning they are less than 10-9. When looking at the BER values in the scenario with a raised cosine filter, it is observed that the number of erroneous bits is lower compared to the values in the scenario without a filter and the scenario with a Gaussian filter. However, when using the Gaussian filter, the BER values increase compared to the scenario without a filter and the scenario with the raised cosine filter. Although the BER values for all three channels fall within an acceptable range, for Channel 1, achieving a BER of 10-36 is preferable to a BER of 10-31 or 10-24, as it means fewer erroneous bits are received. Meanwhile, a BER of 10-24 implies that the number of erroneous bits increases compared to the other two BER values.
The possible causes of the previous results are interference between adjacent channels due to the narrow channel spacing and signal attenuation due to transmission distance. It’s also important to consider that the Gaussian filter has a smoother and wider frequency response, allowing more energy at higher frequencies. Still, it can also cause more interference with nearby channels. In comparison, the raised cosine filter has a tighter frequency response and higher attenuation outside the channel’s bandwidth, reducing interference with adjacent channels but potentially causing more signal distortion. Therefore, the choice of the appropriate filter will depend on the specific needs of the communication system in terms of bandwidth, channel spacing, transmission rate, receiver sensitivity, and other factors. Conducting tests and evaluations to determine the most suitable filter for a particular communication system is essential. Table XI
TABLE XI Values of BER for filter comparison at a transmission speed of 15 Gbps, with a channel spacing of 25 GHz.

TABLE XII Values of BER for filter comparison at a transmission speed of 15 Gbps with a channel spacing of 20 GHz.

1. User simulation: After analyzing the obtained results, the raised cosine filter was observed to perform better. To characterize the network’s performance, a variable optical attenuator is used as users connected to the network in channel 1, configured at 1 dB. It’s important to note that this value doesn’t directly represent a real user, as the attenuator value doesn’t correlate with the number of users connected to the network. Instead, it adjusts the network’s load to evaluate its performance. User simulation is a tool used to assess network performance. By simulating different levels of connected traffic, one can determine how the network behaves under various conditions and how efficient it is in terms of capacity and quality of service. Table XII
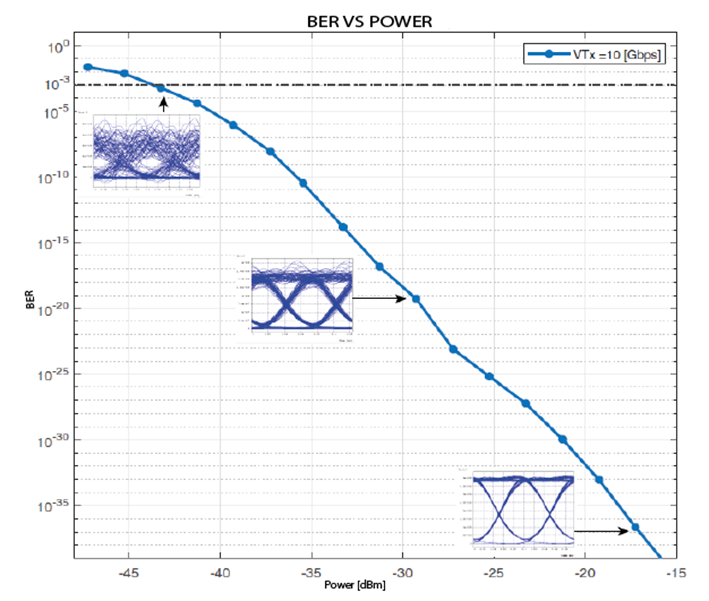
To simulate a heavier load on the network, the attenuator is configured to the necessary value, and the received power and BER are checked. It’s important to mention that when the attenuator was set between 1 and 14 dB, there was no variation in the BER. Therefore, the results shown in Fig. 25 simulate user presence starting from 15 dB, which is gradually increased in 2 dB increments up to 47 dB to simulate the presence of more users.
IV. CONCLUSION
This paper analyzes the performance of UDWDM technology in a PON network for which OptSim software has been used and considers three evaluation scenarios. For each scenario, transmission distance varied from 10 km to 20 km, users were connected to the network, transmission speed was 10 Gbps to 17 Gbps, and channel spacing was 25 GHz, 20 GHz, and 15 GHz. Simulation results indicate that UDWDM technology can significantly enhance the capacity and efficiency of the PON network, enabling a greater number of users and higher data rates, provided that proper channel spacing is considered
Analyzing the simulation results reveals that certain transmission parameters significantly influence the performance of UDWDM systems. As the distance between channels increases, several phenomena can affect the performance of the optical communication system, such as i) optical interference between channels, leading to increased error rates and affected by the optical power level of the channels, ii) wavelength, iii) signal-to-noise ratio, iv) modal dispersion, and v) chromatic dispersion.
The three simulation scenarios provide valuable insights into how distance, transmission speed, and channel spacing can alter the BER, particularly impacting channel 2, which is most affected by attenuation and chromatic dispersion from adjacent channels. Using raised cosine and Gaussian filters helps mitigate these effects to some extent and improves signal quality. However, for transmission rates exceeding 15 Gbps and distances greater than 16 km, the effectiveness of filters diminishes as the BER value becomes equal to or lower than when no filters are used.
The channel approach in UDWDM can offer benefits such as increased data transmission capacity and the potential to boost transmission speed by utilizing more bandwidth. However, considering that this approach can also lead to undesired optical phenomena, such as interference between channels and increased optical noise, is essential. Therefore, careful system configuration and design are crucial to ensure optimal performance. Referring to the above, a channel spacing of 25 GHz and distances between 10 km and 20 km results in the most suitable channel performance in all scenarios, while at 20 GHz and especially at 15 GHz, the BER increases to a greater extent.
Simulation results showed that the choice of the filter is an important factor affecting the performance of a UDWDM system. In particular, it was found that the raised cosine filter provides better overall results compared to the Gaussian filter and no filter. The number of users used on a specific channel also significantly impacts signal quality and, consequently, the BER. As more users are added, the reception power varies, and the eye diagram exhibits interference, indicating that the signal is more susceptible to noise and other interferences. This can be explicitly observed when the BER value is 10-3, and the reception power is -43 dBm.
It is recommended that future research on UDWDM employ machine learning techniques, such as neural networks, to develop predictive models that anticipate system performance under various conditions. The goal is to provide advanced tools that allow systems to be optimally configured without the need to perform exhaustive simulations for each new configuration, thus optimizing the design process and improving the operational efficiency of networks.
Energy models could also be developed to evaluate the energy consumption of the UDWDM system in a PON network under different configurations. The goal is to optimize signal quality transmission parameters and improve active components’ power efficiency, such as the OLT and ONT, core network equipment, and enduser devices. This will allow a more sustainable and efficient configuration of UDWDM systems, contributing to the reduction of total energy consumption in optical communications, which is especially relevant in longdistance networks.


