Inglés (pdf)
 Articulo en XML
 Referencias del artículo
 Enviar articulo por email
 Citado por SciELO
  Similares en
SciELO
Similares en
SciELO 
 Permalink
(1. INTRODUCTION
The development of the tanning industry in Ecuador has been driven by the growing market for leather products such as handbags, belts, shoes, and jackets. These industries generate wastewater contaminated with a significant concentration of chromium (Zhao & Chen, 2019) that has not fully reacted during the leather tanning process. The increase in leather production generates significant amounts of wastewater. This metal can be recovered through chemical reactions. However, if the water is not properly treated, it becomes an environmental problem.
Tanning is an industry whose main activity consists of subjecting animal skins, mainly bovine and ovine, to chemical treatments using chromium salts (Zhou et al., 2018). These processes aim to modify leather to obtain a material that is hardly waterproof, durable, soft, and flexible (Nashy et al., 2012; Wang et al., 2022b). Over time, many methods of hide preservation have been perfected, but the use of chromium salts, such as Cr(OH)SO4, in the tanning process has always remained the industrial standard. This approach guarantees a product that does not deteriorate under different environmental conditions. It also protects against the degrading action of microorganisms such as fungi, insects, and other microscopic life forms (Rathore, 2015).
Chromium is a highly toxic pollutant, especially in its hexavalent (IV) state, which forms chromates, dichromates, and acids. The total chromium concentration limit for industrial effluents is 1 mg/L. There are significant risks to humans, including a high risk of cancer, dermatitis, nephritis, and respiratory problems, from elevated levels of chromium (III) or (VI) in water (Kirti Shekhawat, Sreemoyee Chatterjee, 2015; Tumolo et al., 2020). It also leads to contamination of soil, water, and air (Shore & Shemesh, 2016; Zhao & Chen, 2019). Although the trivalent form of chromium is considered to be less toxic and more stable, it can be converted to its hexavalent form in the presence of oxidizing agents, for example, oxygen in the air or other oxides (Chávez, 2010).
Therefore, it is essential to explore various strategies for the recovery of residual chromium, such as chemical precipitation, ion exchange, reverse osmosis, or adsorption processes (Minas et al., 2017). Recovery by precipitation and subsequent thermal treatment to convert it into Cr2O3, a useful product that can reduce its environmental impact, is a promising route for its utilization. Because of the problems associated with the direct discharge of chromium into the environment, this study aims to take advantage of the high concentrations of chromium present in the wastewater. Chromium levels in tanning industry water may be as high as 1300-8000 mg/L (Minas et al., 2017), especially in small-scale industries in countries where there are no environmental regulations to control the discharge of contaminated water.
An important alternative to reduce waste and reduce direct and indirect effluent contamination is the recovery of the chromium salts used in the process. The obtained chromium (III) hydroxide is subjected to high temperatures to facilitate the fragmentation of the particulates and to obtain the corresponding oxide (Huang et al., 2016). Cr2O3 has remarkable properties, including high hardness, low friction, high wear resistance, corrosion resistance, and good optical properties (Golosova et al., 2017). These properties enable a wide range of applications, such as protective coatings, optical and electronic applications, solar energy protective films for windows (Zhao et al., 2018a), catalysts (Yin et al., 2019), dyes and pigments (Tsegay et al., 2022), solar energy applications (Tsegay et al., 2022) and sunscreens (Talavari et al., 2018).
As mentioned above, trivalent chromium oxide is a compound with a wide range of industrial applications. This green solid is used as a pigment in the production of emerald green paint for glass and ceramics. In the manufacture of glass, the green color is achieved by combining cobalt, zinc, and chromium oxides during the melting of the glass. When the glass cools, the green color is obtained (Chua et al., 2022). In ceramics, the colorant is added in powder form to the frits. The frits are then fired at high temperatures to achieve the desired color (Gayo & Lavat, 2018). Calcined Cr2O3 can be used in coatings for various materials. In addition to its solubility in water, it contains chromophores that give the characteristic green color to various industrial paints (Wang et al., 2022a; Zhang et al., 2014). Catalysts, on the other hand, are substances that speed up reactions without changing the chemical composition of the elements involved, thus obtaining optimum results without affecting the reaction as a whole (Gao et al., 2019; Zhang et al., 2022). These include chromium and iron metal oxides used in hydrocarbon processing.
The main objective of this work is to develop a simple method for the synthesis of Cr2O3 particles by aqueous precipitation with ammonia as a precipitant (Huang et al., 2016). This approach involves an economical one-step synthesis process. The use of ammonium hydroxide is targeted due to its high solubility and the generation of alkaline conditions (pH > 11) by the formation of OH- ions (Zhang et al., 2014). However, the possibility of using other bases, such as sodium hydroxide or calcium hydroxide is not excluded.
In this research, chromium oxide was synthesized to be used as a colorant. Precipitation-calcination processes were applied using wastewater from the tannery industry. Calcination was carried out at three different temperatures: 400, 600, and 800º C. The Cr2O3 is characterized by various analytical techniques, including X-ray diffraction (XRD), scanning electron microscopy (SEM-EDX) coupled with energy-dispersion spectrometry (EDX), and Fourier transform infrared (FT-IR). This oxide can be reused as a colorant in the glass industry, in paints, in jewelry, and as a corrosion inhibitor.
2. METHODOLOGY
2.1 Chromium oxide synthesis using synthetic water
Solutions of industrial-grade basic chromium sulfate [Cr(OH)SO4] at a concentration of 0.2 mol/L and a 96% solution of ammonium hydroxide (NH4OH) were prepared. A volume of 500 mL of the Cr(OH)SO4 solution was placed in three beakers, and aqueous NH4OH was added dropwise while stirring constantly at 120 rpm until pH values of 9, 10, and 11 were achieved in each experiment. The samples were allowed to stand for 24 h, after which the precipitate was removed via vacuum filtration. The filtered material was then dried at 70°C for 24 h. Finally, the dried samples were calcined at 400 °C, 600 °C, and 800 °C for 5 h in each experiment and then crushed.
2.2 Synthesis of chromium oxide using wastewater
The method used for the extraction of chromium oxide from synthetic water will be replicated. Place 500 mL of tannery wastewater in a beaker. Add aqueous NH4OH drop by drop with constant stirring (120 rpm) until pH = 10. The samples are allowed to stand for 24 h, then vacuum filtered and dried at 70°C for 24 h. Finally, the dried samples are calcined at 400, 600, and 800°C for 5 h and then crushed.
2.3 Determination of chromium concentration in wastewater
Using atomic absorption spectrophotometry, the concentration of total chromium in the tannery effluent is calculated both before and after chromium oxide synthesis. The percentage of chromium removed from the water is calculated from these data. Acidify the samples with nitric acid (HNO₃) to a pH below 2 to avoid chromium precipitation and preserve its soluble form. Heat the samples and add hydrogen peroxide (H₂O₂) to oxidize organic compounds that may interfere. For the calibration curve, chromium standard solutions are prepared using potassium dichromate (K₂Cr₂O₇).
Total chromium is determined by the Standard Methods 3111 B direct air-acetylene flame method. A Perkin Elmer AAnalyst200X atomic absorption spectrometer is used. It is equipped with a chromium-specific hollow cathode lamp at a wavelength of 357,9 nm. An air/acetylene mixture is used with flow rates of 11.5L/min for air and 6.5 L/min for acetylene.
2.4 Characterization of chromic oxide
The Cr2O3 dye samples were characterized by Fourier transform infrared spectroscopy (FTIR) using a JASCO FT/IR-100 model spectrophotometer. This analysis allows the detection of possible organic remnants of the tanning process present in the sample, in addition to the identification of the chromium oxide. Scanning electron microscopy with a field emission gun (FEG-SEM) is used to study the morphology of the particles, their size distribution, and composition. The instrument used is a TESCAN model MIRA3. The compositional analysis is performed by an energy dispersive spectroscopy (EDX) with a BRUKER XFlash 6130 detector. The resolution is 123 eV for Mn alpha. A double adhesive layer of carbon tape is used on the sample holders during the SEM analysis. A 20-nanometer gold layer is applied using a QUORUM Q150R sputter coater to ensure the conductivity of the samples. X-ray diffraction (XRD) is used to determine the crystal structure parameters and the crystal structure of the Cr2O3 dye crystals. The analysis was performed with a PANalytical Empyrean diffractometer in θ-2θ configuration (Bragg-Brentano geometry), equipped with a Cu X-ray tube (Kα radiation λ = 1.54056 Å) operating at 40 kV and 40 mV.
3. RESULTS AND DISCUSSION
3.1 Synthesis of Cr 2 O 3 dye samples
To evaluate the effectiveness of the precipitant with the mass of precipitate, the experimental phase of this research began with the preparation of synthetic water samples. This will determine the optimum pH to be used in the experiments with the tannery effluent sample. The selection of the appropriate pH value is based on the amount of precipitate that is obtained from synthetic water. Dry precipitate masses of 3.87 g, 4.79 g, and 4.22 g are obtained for pH 9, 10, and 11, respectively. However, the masses of precipitate at different pH did not show scattered values. It was found that samples treated at pH 10 produced more precipitates, so this pH (10) was chosen for further studies with tanning water.
In addition, the initial and final measurements of the total chromium content in the wastewater were carried out to determine the percentage of chromium removal. These concentrations are 315 and 164 mg/L, respectively. This indicates that 47.94% of the chromium originally present in the water was removed.
Tanning wastewater contains a complex mixture of contaminants including heavy metals and organic compounds like grease and oil. The presence of these compounds can form emulsions. This makes them difficult to separate and affects the precipitation of chromium. Furthermore, the ions present can interact and form complexes, making chromium separation difficult. Normally, wastewater has an acidic pH of about 3.5. The solubility of the trivalent chromium (Cr(III)) is favored, but it is difficult to precipitate it as Cr(OH)₃. For effective precipitation, therefore, pretreatment to remove organic matter is required.
Although 100% removal of chromium from the wastewater was not obtained, this process could be used as a preliminary step before applying specific treatments, such as filter absorption or ion exchange, to remove the maximum amount of chrome so that the wastewater can be discharged into the sewer system.
For example, the recovery of chromium by precipitation with NaOH and Ca(OH)2 achieved a removal of 99.9%, starting from an initial concentration of 5000 mg/L of chromium in the water of a tannery (Murgueitio et al., 2015). Likewise, the removal of chromium by chemical precipitation with lime and cement achieves a removal of 97% from an initial concentration of 2350 mg/L of chromium (Engy et al., 2016). Similarly, 98% removal was achieved in 2 h of treatment with water containing 3250 mg/L of total chromium using lime and cement in combination with biological treatment (Hesham & Engy, 2016). Moreover, using water from a tannery with 2000 mg/L chromium, 99.7% of chromium was removed from wastewater by a chemical process using NaOH and electrochemical treatment (Mella et al., 2016).
3.2 Characterization of the dye with FTIR
Characteristic peaks at 536 and 613 cm-1 are observed in the FT-IR spectra in Figure 1 corresponding to the oxide prepared from synthetic water (standard sample) and calcined at 800ºC. These peaks indicate the presence of Cr2O3 crystals which give transmissions below 1000 cm-1 and are indicative of stretching of the O-Cr-O bond.
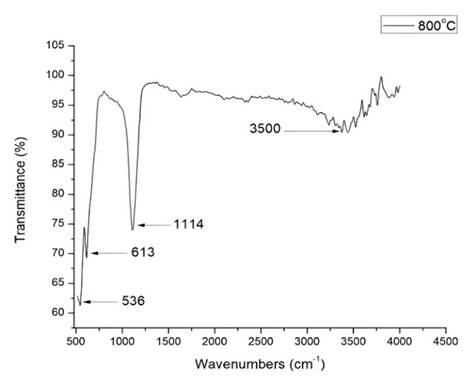
Figure 1 FT-IR spectra obtained for the synthetic water samples (standard samples) were calcined at 800ºC
The FT-IR spectra in Figure 2 show the absorptions of metal oxides. Absorption bands below 1000 cm-1 are due to interatomic vibrations (Kamari et al., 2019). The sample calcined at 400ºC shows peaks at 506 and 520 cm-1, characteristic of O-Cr-O bond stretching, indicating the presence of Cr2O3 crystals (Abdullah et al., 2014). The sample calcined at 600º C shows a lower percentage of transmittance with peaks due to stretching of the M-O (O-Cr-O) bond at 506 and 519 cm-1.
The sample calcined at 800ºC shows a higher transmission percentage and peaks, indicating the stretches of the M-O (Cr-O) bond at 519, 544, and 614 cm-1, confirming the formation of Cr-O bonds in the chromium oxide (Gibot, 2020; Zhang et al., 2014).
3.3 SEM-EDS morphological analysis
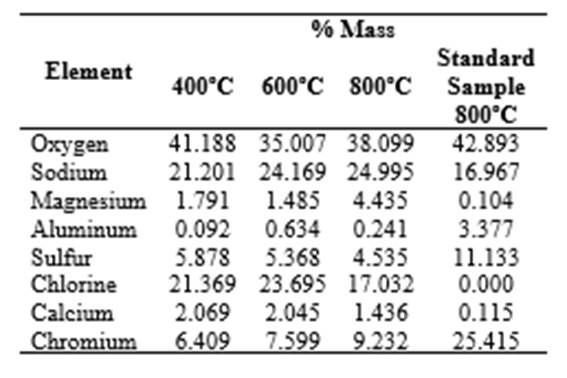
Figure 3 shows the sample synthesized using synthetic water at pH 10, which was then calcined between 400 and 800 °C. The image shows that the sample contains particles with sizes ranging from 0.303 to 0.521 mm. The particles have irregular shapes and large sizes. EDS spectra show the presence of chromium, oxygen, and other elements such as calcium, chlorine, sulfur, and aluminum.
Morphology and compositional analyses are carried out by scanning electron microscopy coupled with energy-dispersive spectroscopy. Samples synthesized at pH 10 and calcined at 400, 600, and 800 °C are shown in Figure 3. The micrograph of the samples at 400 °C, with particle sizes ranging from 28 to 97 mm, is shown in Figure 3a. Samples calcined at 600°C, Figure 3b, show sizes between 25 and 44mm. Finally, the samples calcined at 800 °C with particle sizes ranging from 33 to 76 mm are shown in Figure 3c. All micrographs show that the Cr2O3 dye particles do not have a defined or uniform morphology (Wang et al., 2019; Yahyazadehfar et al., 2020). In addition, it is observed that as the temperature increases, the size of the particles decreases, but the agglomeration of the particles is quite noticeable in all the cases.
In the EDS spectra in Figure 3, in addition to chromium and oxygen, distinct peaks can be seen. These peaks indicate the presence of elements such as calcium, chlorine, sulfur, aluminum, magnesium, and sodium. It is assumed that these elements were present as co-precipitated ions in the synthesis process. They probably originated from the products used in the tanning process and were still in solution in the effluent. All of the samples show a distinct peak at 5.8 keV, which corresponds to the presence of chromium oxide (Abdullah et al., 2014; Kadowaki et al., 2018). However, the EDS spectrum of the sample treated at 800ºC shows 9.232% by mass. This is higher than the 6.409% and 7.599% of the samples treated at 400ºC and 600ºC, respectively. Furthermore, faint peaks corresponding to other oxides (CaO, Al2O3, MgO, Na2O) are present in the sample, as shown in Figure 3 (Zhao et al., 2018b).
Figure 4 shows the X-ray diffraction (XRD) pattern of the Cr2O3 dye obtained from synthetic water. The dye was calcined at 800°C. The presence of impurities is responsible for the observed non-indexed peaks, which do not correspond to the crystal structure of Cr2O3. The non-indexed peaks observed, which do not correspond to the crystal structure of Cr2O3, are attributed to the presence of impurities. During Cr(OH)3 formation, these impurities co-precipitate in the solid phase and on calcination also produce oxides reflected in the diffraction pattern. Comparing the XRDs of the standard with those obtained from the effluent, the presence of Miller indexes (104) and (202) are observed in both diffraction patterns, confirming the presence of Cr2O3, in addition to other oxides.
3.4 XRD analysis
X-ray diffraction (XRD) patterns of Cr2O3 dyes calcined at different temperatures are shown in Figure 5. The indexed peaks correspond to the crystal structure planes of chromium oxide with lattice parameters a=4.953 Å, b=4.953 Å, c=13.588 Å and angles α=90º, β=90º, γ=120º. These parameters are indicative of a compact hexagonal crystal structure with a cell volume of 288.69 pm3 (Cao & Zuo, 2017). As confirmed in Table 1 of the EDX spectra, the non-indexed peaks observed, which are not consistent with the crystal structure of Cr2O3, are due to the presence of impurities. In addition to Cr3+, other cations have been identified which form oxides and can distort the diffraction pattern of the pure dye. The morphological properties of the dyes, analyzed by Cu-Kα radiation (wavelength 1.5406 Å) in the 2θ range (10-80º), show clearly distinguishable peaks of higher intensity at angles 32.60, 46.30 and 57.80, corresponding to Miller indices (104), (202) and (018), which support the crystalline structure of Cr2O3 (Wang et al., 2018). Using these three peaks as a reference, an average crystal size of 78 nm is estimated using the Debye-Scherrer equation (Afzal et al., 2016; Gibot, 2020; Wang et al., 2019). In addition, the intensities of the indexed peak (104) at temperatures of 400, 600 and 800ºC, are 12249.478, 7429.045 and 18415.296 respectively. This confirms more Cr2O3 at 800ºC, corresponding to the highest intensity obtained.
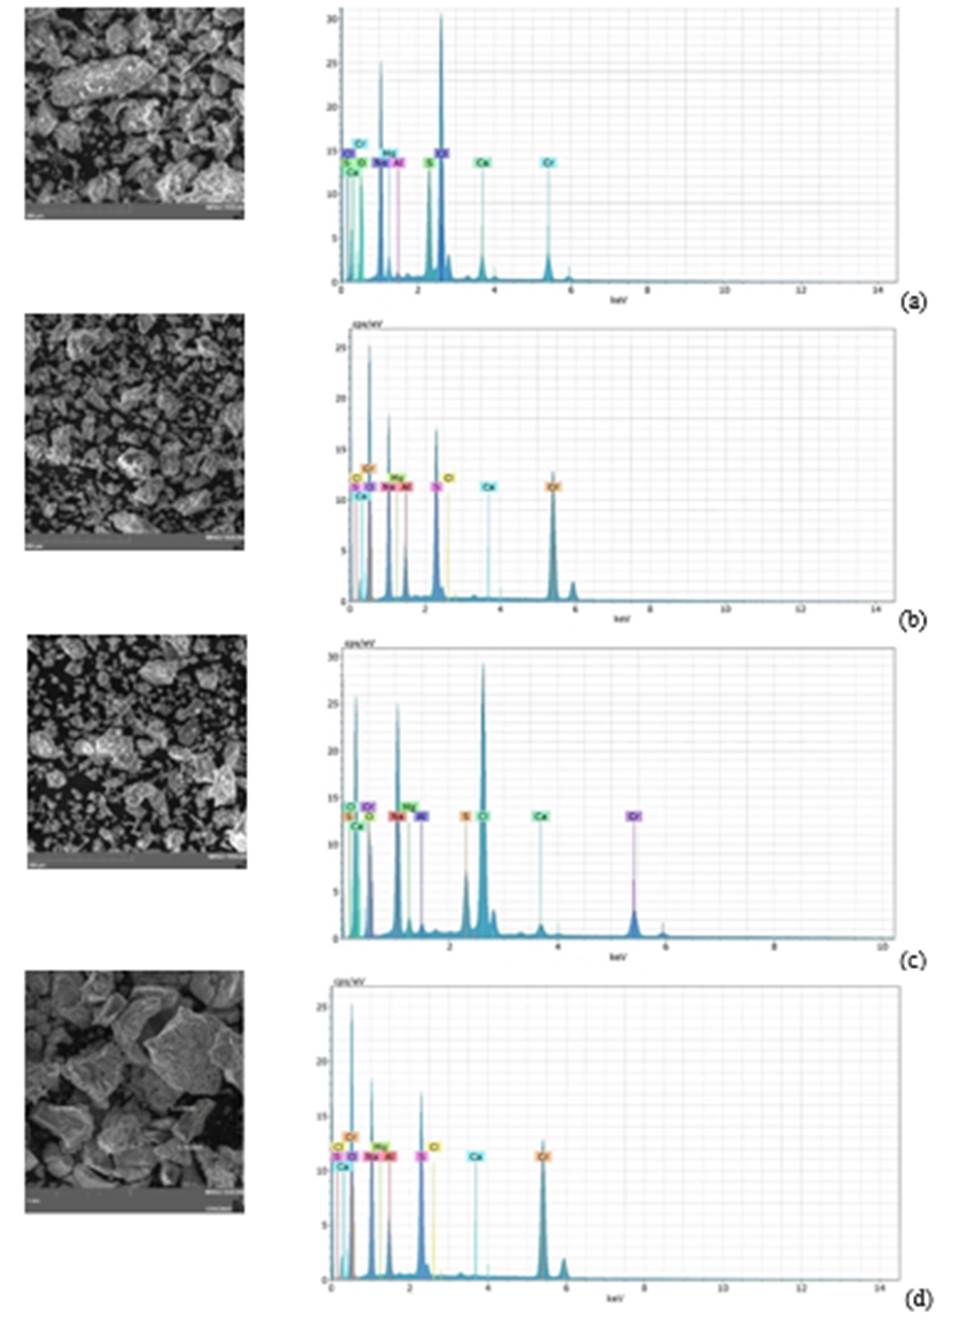
Figure 3 SEM micrographs of wastewater sample calcined at (a) 400ºC, (b) 600ºC, (c) 800ºC and (d) (standard sample) calcined at 800°C
3.5 Staining test
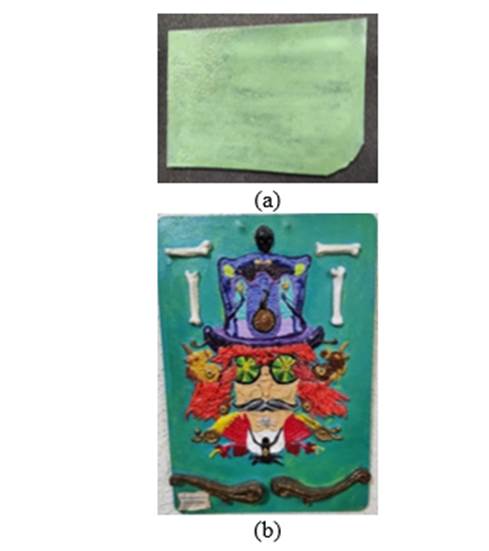
The staining test evaluated the effect of the dye and was carried out on a fragment of glazed glass that had been melted at 900°C. Figure 1(a) shows a green tint, but further experiments are needed to improve the distribution of the tint across the glass surface. Furthermore, other tests should also be carried out with different percentages of Cr2O3 added to the glass during the melting process. According to the literature, it is indicated that the chromium oxide, as a refractory pigment, should be in the range of 1 - 3 % by mass in order to obtain an optimum green color. Similarly, the dye dissolved in water was used in staining tests on canvas and porcelain-based reliefs. Figure 6 shows(b) an optinal green staining.
4. CONCLUSIONS
Precipitation proves to be a straightforward process with significant potential for remediating the environment. The recovery of chromium (III) oxide from wastewater is its main advantage. This is an excellent coloring agent for various materials. Characterization of the recovered material confirms that the particles correspond to Cr2O3. The FTIR shows a characteristic stretching of this oxide. Furthermore, morphological analysis by SEM-EDS shows that the particles do not have a defined shape and have sizes below 76 µm when calcined at 800°C. This is the temperature that gives the best results in this study. Despite the co-precipitation of other oxides identified in the compositional analysis, the Cr2O3 content is predominant at 13% by mass. XRD analyses confirm the presence of chromium oxide, showing the characteristic peaks of the compound and its hexagonal crystalline structure. The results will provide a basis for future research into the recovery and re-use of toxic chemicals for the environment, such as chromium (VI).