Español (pdf)
 Articulo en XML
 Referencias del artículo
 Enviar articulo por email
 Citado por SciELO
  Similares en
SciELO
Similares en
SciELO 
 Permalink
INTRODUCTION
Fiber-reinforced polymers (FRP) are composite materials in which the polymeric matrix is embedded with fillers in the form of fiber (long longitudinal, chopped fiber). Fiber fillers significantly enhance the properties of polymers. For instance, carbon fibers increase strength and stiffness (Masuelli & Masuelli, 2013), as well as thermal and electrical conductivity (Shi et al., 2021). Other fillers, such as barium ferrite, can be incorporated to impart magnetic properties to the polymer matrix (Fulco et al., 2016), while natural fibers like jute, flax, ramie, hemp, and kenaf are lightweight and biodegradable (Elfaleh et al., 2023). As a result, these composites are used in a wide range of high-tech and engineering applications, including those in the automotive, aerospace, electrical, biomedical, and electronics industries (Rajak et al., 2019; Waghmare et al., 2022). Parameters such as fiber orientation and distribution, chemical stability, and interface bonding define the mechanical behavior of fiber-reinforced composites. Commercially, thermosetting polymers, such as epoxy or polyester resins are commonly reinforced with glass or carbon fibers due to their availability and reliability in various industrial applications. Conversely, thermoplastic polymers might be preferred for their moldability compared to epoxy resins (Alberto, 2013). Additionally, research into natural fibers like bamboo, jute, kenaf, flax, and hemp has expanded significantly due to growing environmental awareness and the need to reduce the use of synthetic fibers
(Faruk et al., 2012). For example, the automotive industry utilizes natural fiber-reinforced polymers (NFRPs), particularly in car interiors. BMW, for instance, incorporates NFRPs in seat backs, door panels, and noise insulation panels (Mohammed et al., 2015; Sen & Reddy, n.d.). Nevertheless, it is important to note that NFRPs are affected by moisture absorption, have limited processing temperatures, and exhibit variable quality, all of which impact their mechanical performance and may restrict their applications (Gallo et al., 2013). Consequently, mechanical tests are conducted to determine properties such as tensile strength, Young’s modulus, ductility, and other significant features of the material. Although experiments are often the most accurate method for characterization, they may involve with issues such as high costs or the requirement for specialized equipment.
Therefore, analytical prediction of mechanical properties using micromechanical methods can be a valuable and cost- effective approach. However, it is important to consider that the mechanical behavior of fiber-reinforced composites is influenced by factors such as the fabrication process, fiber orientation, distribution, and aspect ratio. These factors can make accurate prediction challenging, even for aligned fiber composites, due to their multi-parametric nature (Henry & Pimenta, 2017). Despite this, micromechanical methods still provide a useful reference point for composite materials. The simplest approach to predict properties like Young’s modulus is by using parallel and series models derived from the rule of mixtures (Loos, 2015). Other methods, such as Halpin-Tsai (Affdl & Kardos, 1976) and the shear lag model (Cox, 1952), lso consider fiber geometry and shape, offering potentially more accurate predictions.
Facca et al. (2006) applied micromechanical models to predict the stiffness of various natural fiber composites, including hemp, hardwood, rice hulls, and E-glass fibers blended with high-density polyethylene. The study compared the experimental Young’s modulus of these composites with predictions from the rule of mixtures, Halpin-Tsai, Nairn's generalized shear-lag analysis, and Mendel's stress transfer models. Among these, the Halpin-Tsai equation provided the most accurate predictions based on a sum of squared errors criterion. In a related study, Sudheer et al. (2015) evaluated the Young’s modulus of Epoxy/Glass composites at various volume fractions using analytical methods, including the Rule of Mixtures, Halpin-Tsai, Nielsen, and Chamis models. The results indicated a good agreement between the analyzed models and the experimental data. Furthermore, Alam & Chowdhury (2020) conducted a micromechanical analysis of glass fibers (E-type and S-type) and found that the Halpin-Tsai equation was effective for predicting mechanical properties. In addition, Huang et al. (2023) analyzed various models, including the Mori-Tanaka method, Bridging Model, and Fu- Lauke scheme, through finite element analysis (FE). By introducing a probability function that links the length and orientation distribution functions with fiber volume fraction, they improved prediction accuracy for carbon and glass fibers bonded with different resin matrices.
As demonstrated in the literature, micromechanical prediction is a crucial aspect of determining mechanical properties of fiber-reinforced composites. This study focuses on comparing various micromechanical approaches, including the Halpin- Tsai equations, series and parallel models, Nilsen equations, and Cox equations, for predicting the elastic modulus of fiber- reinforced composites. The predicted elastic moduli will be compared with experimental data from literature for E-glass, carbon, and Kenaf fiber-reinforced epoxy composites to evaluate the accuracy of the different methods.
2. THEORETICAL BACKGROUND
2.1 Series and parallel model
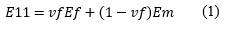
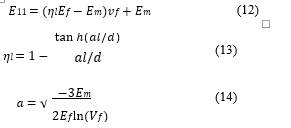
Series and parallel models are derived from the rule of mixture (ROM) based only on the properties of the matrix and the filler as a function of the volume fraction. The series model or upper bound assumes that the tension is uniform for matrix/fiber phases whereas the parallel model or lower bound assumes as constant the deformation. According to these models, Young’s modulus of the analyzed composite should lie between these limits (Loos, 2015). By using the series model the longitudinal modulus 𝐸11 can be determined by the equation below.
By using the parallel approach, the transversal modulus 𝐸22 can be calculated by the expression:
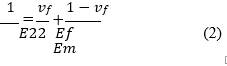
where 𝐸𝑚, 𝐸𝑓 stand for matrix, and fiber Young’s modulus respectively, and 𝑣𝑓 is the volume fraction.
2.2 Effective modulus
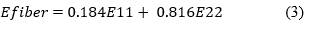
The effective modulus model relies on a combination of the longitudinal and transversal elastic modulus approaches and can be applied to randomly oriented fiber composites by using the equation given (Van Es et al., 2001).
2.3 Halpin-Tsai model
The semi-empirical Halpin-Tsai model can be used to predict Young’s modulus for aligned short fibers (Loos, 2015). When 𝑣𝑓 is relatively small compared to the total volume of the composite, a simplified Halpin-Tsai model describes the modulus of elasticity as (Budarapu et al., 2019):
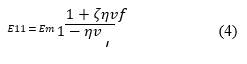
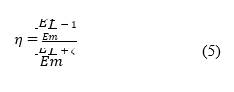
where ζ in equations (4) and (5) is defined as the shape-fitting parameter of the filler, which is dependent on the geometry and loading direction. In the case of fibers, the longitudinal (𝜁11) and transversal (𝜁22) shape parameter is defined respectively as follows:
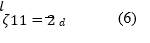
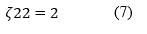
where 𝑙 is the length of the fiber through the direction of the load and 𝑑 represents the fiber diameter (Aruan Efendy & Pickering, 2019a). When 𝜁 → 0 the Halpin-Tsai model reduces to the series model whereas for 𝜁 → ∞ the model reduces to the parallel. In the case of the random orientation of the fibers, the Halpin-Tsai equation takes the following form (Loos, 2015):
2.4 Cox model
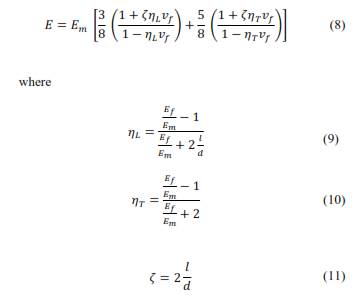
Cox model (Cox, 1952), a simplification of the Halpin-Tsai model, is used to predict Young’s modulus of discontinuous fiber-aligned composites, assuming a perfectly elastic and isotropic interface between fiber and matrix. Additionally, it is considered that the load transfer takes place without yielding or slipping (Aruan Efendy & Pickering, 2019b). By considering these assumptions, the classic shear-lag equation for longitudinal modulus is given by
where 𝜂𝑙 is known as the length efficiency factor which increases with the aspect ratio, highlighting the effect of high aspect ratio fillers. When it comes to fibers randomly aligned composites Young’s modulus can be determined by the equation given below (Krenchel, 1964; Loos, 2015):
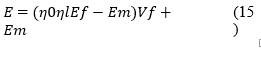
where 𝜂0 is related to the orientation of fibers, taking values 1 for aligned composites, 3/8 for alignment in the plane, and 1/5 for randomly oriented (Carman & Reifsnider, 1992; Krenchel, 1964).
2.5 Nilsen model
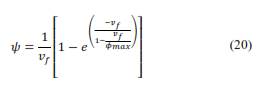
The Nilsen model is a modification of the Halpin-Tsai model, considering not only the aspect ratio of the filler but also the packing factor (fiber arrangement) as it is shown in the equations below (Aruan Efendy & Pickering, 2019b; Loos, 2015):
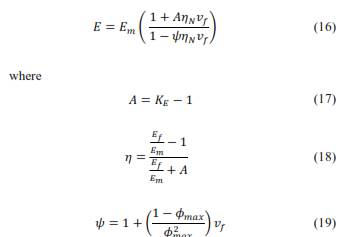
where 𝜙𝑚𝑎𝑥 is the maximum fiber packing fraction and the parameter 𝐴 depends on the aspect ratio and orientation of the filler. Additionally, Nilsen proposed an alternative equation to determine the packing parameter (Loos, 2015).
The values of 𝐴 and 𝜙𝑚𝑎𝑥 need to be known to determine the elastic modulus through the Nielsen model. For a random distribution of fibers, A has a value of 0.838 for a high aspect ratio and 𝜙𝑚𝑎𝑥 is equal to 0.52 for a three-dimensional random arrangement. Other values can be found in (Loos, 2015; Nielsen, 1974). Other models, such as the Hashin-Shtrikman (Hashin & Shtrikman, 1962), Mori-Tanaka (Motohashi et al., 1974), Hill models (Hill, 1965), and improved Voigt and Reuss model (Kiselev et al., 2022) are also commonly used to determine the elastic properties of reinforced polymer matrix composites. However, they will not be considered in this study.
3. EXPERIMENTAL DATA
For this research, experimental data on the Young's modulus of fiber-reinforced epoxy composites were collected to compare with the predicted values obtained using the micromechanical models described in section 2. The fillers selected for this comparison were E-glass, carbon, and Kenaf fibers.
3.1 Carbon fiber/epoxy
The experimental data for carbon fiber/epoxy composites has been taken from the following works: Capela et al. (2019) utilized short carbon fibers, 0.5 mm in length and 7 µm in diameter, embedded in Biresin CR83 epoxy resin at various volume fractions (5 %, 10 %, 15 %, 17.5 %, and 20 %). The carbon fibers were treated with dichloromethane, and during processing, they were dispersed using ultrasound techniques. Sample plates, measuring 150x100x5 mm, were then subjected to tensile and fatigue tests, with results presented in Section 4. The Young's modulus of the fibers and matrix were 230 GPa and 3.6 GPa, respectively. Khun et al. (2014) investigated the tribological and mechanical properties of short carbon fiber (SCF)-reinforced epoxy composites, using SCFs with average diameters and lengths of approximately 14.5 µm and 90 µm, respectively. The epoxy resin Epolam 5015 from Axson (with a Young’s modulus of 3.25 GPa) was mixed with SCFs (M-2007S from Kreca, with a Young’s modulus of 230 GPa). The mixture was processed in a Fixiform cup mold (Struers) and cured at room temperature. Yu et al. (2014) introduced the HiPerDiF method to obtain discontinuous aligned fibers, using carbon fibers TENAX C124 (E = 225 GPa) with a length of 3 mm and a diameter of 7 µm to reinforce an epoxy matrix (Redux, Hexcel, E = 4 GPa). Tensile tests were conducted with fiber volume fractions of 41 % and 55 %.
3.2 Glass fiber/epoxy
Rejab et al. (2008) investigated the effect of different fiber volume fractions on glass fiber-reinforced plastic composites. The composite matrix used a resin with an elastic modulus of 2.4 GPa, similar to the epoxy resin EPIPHEN RE 4020 reported by Ciprian et al., 2015. Additionally, the Young's modulus of the glass fibers was determined to be 73 GPa, with an aspect ratio (𝑎𝑟 ) of approximately 25.
3.3 Natural fiber/epoxy
Andre et al. (2016) analyzed nonwoven kenaf fiber/epoxy composites manufactured by resin transfer moulding (RTM). The tensile modulus of the fiber and the matrix are 26.06 and 1.93 GPa, respectively. Tensile tests were carried out and the results are shown in the next section.
4. RESULTS AND DISCUSSION
To illustrate the agreement between analytically determined values and experimental data, the results were plotted as a function of the volume fraction from glass, kenaf, and carbon fiber-reinforced epoxy.
4.1 Carbon fiber/epoxy
Figure 1 provides information on Young’s modulus as determined by analytical models and derived from experimental data. As shown in Table 1, the model that best aligns with the experimental results is the Halpin-Tsai model for a random distribution of fibers (Loos, 2015). This may be because the model accounts for both the longitudinal and transverse elastic moduli, as well as the aspect ratio and shape of the filler. The Cox model for randomly dispersed short fibers underestimates the elastic modulus by approximately 30 %. Overall, the stiffness of a short fiber-reinforced composite (SFRC) highly depends on fiber orientation, the gap between fibers, and the packing arrangement, in addition to other parameters such as the aspect ratio. The packing parameter plays an important role in determining the elastic modulus, being important if the packing is hexagonal, cubic, or random. By using the equation given in (Facca et al., 2006), one may obtain a better approximation, by trying different packing factors. Another issue may be related to the aspect ratio (𝑎𝑟 ) which has proved to be a significant parameter in prediction since as higher the aspect ratio the better models work (Loos, 2015). A similar underestimation regarding Cox model is reported in Sk & Chakraborty (2004). The other prediction models are also unsuitable due to the inherent randomness in several parameters of short fiber-reinforced composites, such as fiber geometry, orientation, volume fraction, spacing or gap, packing arrangement, fiber-matrix bonding interface, and curing conditions related to the fabrication process. These factors introduce significant uncertainty in the values predicted by analytical models (Sk & Chakraborty, 2004).
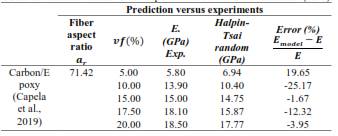
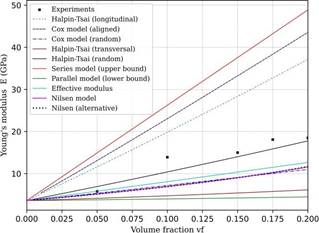
Figure 1 . Comparison between experimental data (Capela et al., 2019) and predicted values of Young’s modulus as a function of volume fraction of carbon fiber-reinforced composite
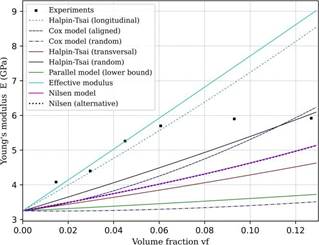
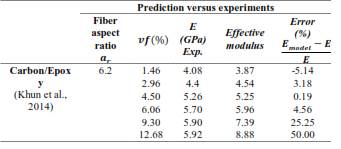
Figure 2 Comparison between experimental data (Khun et al., 2014) and predicted values of Young’s modulus as a function of volume fraction of carbon fiber-reinforced composite
The experimental data presented in Figure 2 shows an upward trend in the elastic modulus up to a volume fraction of approximately 6 %. Beyond this point, the elastic modulus appears to remain constant despite further increases in the filler volume fraction. This plateau in elastic modulus may be attributed to the formation of agglomerates, which create areas of stress concentration. The closest predicted values for these higher volume fractions exhibit errors of about 50 %. The series model, or upper bound, was not plotted due to its significant deviation from the experimental data. The effective modulus theory provides the closest prediction, with a mismatch of approximately 5 %, as shown in Table 2. It is also notable that the values calculated by the Halpin-Tsai longitudinal model are similar to the experimental data, despite the fibers being randomly distributed within the matrix (Loos, 2015). This may suggest that some degree of fiber alignment occurred in the direction of the load during the tensile test. Figure 3 compares the experimental elastic modulus of aligned carbon fiber/epoxy composites with predicted values obtained using different approaches for various sets of experimental data (Yu et al., 2014). It is worth noting that models considering random and transverse fiber orientations do not predict the elastic modulus satisfactorily, primarily due to the alignment and distribution of the fibers.
On the other hand, the Halpin-Tsai (longitudinal), Cox (aligned), Nilsen models, and the upper bound show the smallest errors. Among these, the Halpin-Tsai method provides the best approximation, with a mismatch of about 10 %, as shown in Table 3. These results are consistent with those obtained by (Huang et al., 2023). This slight overestimation of the elastic modulus may be attributed to factors not accounted for by these models. Such factors include the fabrication process, fiber distribution (including the formation of clusters that act as stress concentration points), and porosity, which can contribute to premature failure.
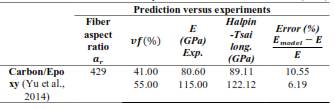
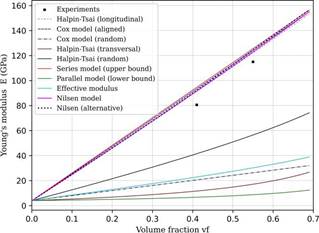
Figure 3 Comparison between experimental data (Yu et al., 2014) and predicted values of elastic modulus as a function of volume fraction of carbon fiber-reinforced composite
4.2 E-glass fiber/resin
Figure 4 compares the predicted elastic modulus, estimated using the aforementioned micromechanical models, with the experimental values reported by Rejab et al. The Halpin-Tsai model for randomly distributed fibers, along with the two Nilsen models, are the most accurate in representing the experimental data, with a maximum error of approximately 7 % (as shown in Table 4). The minor discrepancies between the experimental data and the model predictions can be attributed to various factors, such as anisotropy, fiber distribution, the presence of defects like voids, and weak bonding between the filler and the matrix. In cases where the model slightly underestimates the values, this may be due to the assumption of a completely random fiber distribution, whereas, in practice, some preferential orientation may occur along the load axis (Loos, 2015).
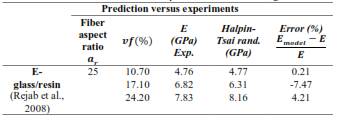
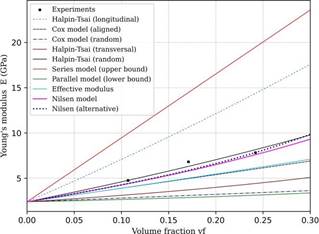
Figure 4 Comparison between experimental data (Rejab et al., 2008) and predicted values of elastic modulus as a function of volume fraction of E-glass fiber-reinforced composite
4.3 Kenaf fiber/epoxy
Figure 5 presents the results for Kenaf fiber-reinforced composites. The most accurate approximations are provided by the effective modulus and the Halpin-Tsai (transversal) approaches, with the highest error being approximately 11.21 % compared to the experimental data, as shown in Table 5. Regarding the effective modulus, it is evident that this empirical relation is more influenced by the transverse modulus (Equation 3). Additionally, the results from the Halpin-Tsai model for the transverse direction suggest a preferential distribution of fibers in that direction. This may be due to the anisotropic behavior of the material, as indicated in Epaarachchi et al. (2010). While random short-fiber composites can be considered quasi-isotropic, the Halpin-Tsai model for random distribution shows high error levels. Better results are achieved when the transverse component is used to determine the transverse elastic modulus of the fibers, as demonstrated in Andre et al. (2016). However, it is not always possible to obtain both elastic moduli for the fibers, and the determination of these values can be affected by factors such as moisture absorption or delamination in natural fibers. These parameters can contribute to the variability in calculations by these models.
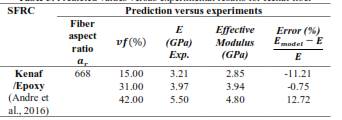
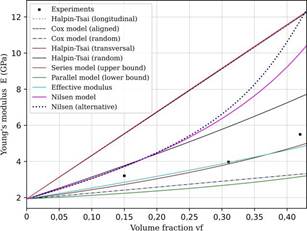
Figure 5 Comparison between experimental data (Andre et al., 2016) and predicted values of elastic modulus as a function of volume fraction of kenaf fiber-reinforced composite
5. CONCLUSIONS
This work compared the accuracy of various analytical micromechanical models in predicting the Young's modulus of fiber-reinforced composites. The models analyzed include the Halpin-Tsai equations, Nilsen method, Cox approximation, series and parallel approaches, and effective modulus. The analytical results were compared with experimental data from the literature for carbon, E-glass, and Kenaf fiber-reinforced epoxy composites. Overall, the effective modulus approach and the Halpin-Tsai equations demonstrated superior alignment with experimental data across all composite types examined. This is particularly true for composites with random fiber distributions, such as those reinforced with carbon and Kenaf fibers, where these models achieved error levels of approximately 10 % or less. In the case of carbon/epoxy composites with aligned fibers, all models based on the longitudinal fiber distribution successfully predicted Young's modulus, maintaining an error margin of approximately 10 % relative to the experimental data. For aligned E-glass epoxy composites, the Halpin-Tsai method and the Nilsen models for randomly aligned fibers, provided sufficiently accurate predictions of Young's modulus, with errors less than 10 %. The effective modulus approach proved to be the most accurate in determining the Young's modulus for Kenaf fibers, with error levels around 12 %.