1. INTRODUCTION
The study of floods has been a great challenge in different parts of world, which has been approached from different points of view over time. However, its analysis and prediction has generally focused on the great potential that it can cause a river to overflow (Zheng et al., 2018). It is for this reason that is one of the most effective methods that has been applied in the flood routing (Lee et al, 2018). Because it is a technique that allows to determine the discharge and flood hydrograph in a river section of any hydrographic basin, using for this purpose the historical records of the flow upstream of said basin (Bazargan & Norouzi, 2018); previously using the hydrometric and pluviometric information available in the study area (Kang & Zhou, 2018). In this sense, the optimal prediction of flows is required to allow the necessary measures to be taken not only for the protection, evacuation and warning systems of potential vulnerable areas in the short and medium term, but also for water resources management and territorial planning (Ayala et al., 2018). Another relevant aspect is the evaluation of the hydraulic infrastructure, since when maximum flows occur, these directly affect the useful life of the hydraulic infrastructure, generating uncertainty, especially in emergency situations (Guachamín et al., 2019; Matovelle et al., 2022).
There are various procedures for estimating flows in basins using the flood routing. Among these methodologies those of hydrological type, those of hydraulic type and those that are complemented with physical and numerical models stand out (Fenton, 2019). However, most of them are complex and require specialized software to obtain optimal results. Likewise, in some cases they require a large amount of information from the study area (Hernández-Andrade & Martínez-Martínez, 2019). That is why within these techniques a common and practical methodology stands out, called the Muskingum method, since it stands out as a simple and precise procedure for the study of maximum flows and evaluation of hydrographs (Bozorg-Haddad et al., 2020; Farzin et al., 2018).
The Muskingum method is a simple type of hydrological approach to the general scheme of flood routing and its variation is given in relation to the arithmetic average storage (Vatankhah, 2021). Therefore, its application in hydrographic basins has shown good fits and significant correlations for flows compared to other methods (Bozorg-Haddad et al., 2019; Gąsiorowski & Szymkiewicz, 2020). However, the Muskingum method has been scarcely explored in the extension and determination of flows, despite the fact that it does not require specific knowledge of the transverse and longitudinal geometry of river (Alhumoud &Almashan, 2019).
In this context, the purpose of studying the Muskingum method is to quantify flood routing that may occur in the basin to prevent subsequent disasters that could harm human life (Akbari et al., 2020; Katipoğlu & Sarıgöl, 2023). Additionally, this method has contributed to the development of innovative hydrological models based on estimating the basic parameters of flood routing (Zang et al., 2020; Pashazadeh & Javan, 2020). Such parameters are commonly known as the linear type, which are represented in the proportionality of volume, the weighting of routing in time intervals and the duration of flood routing (Norouzi & Bazargan, 2020). Furthermore, significant improvements have been incorporated into these parameters and the original method itself, commonly known as optimization algorithms and machine learning for quantifying output flows using hydrographs (Khalifeh et al., 2020; Okkan & Kirdemir, 2020; Qiang et al., 2020).
In Peru, the flood routing has been scarcely studied, there are only two investigations published by Ayala et al. (2018) and Arriola et al. (2021), who point out the great capacity of Muskingum method for the estimation of flows based on the available climatic information. For these reasons, the importance of its application in other river basins arises, being the northwestern zone of Peru, a very important area to study, mainly the La Leche basin.
Because due to the effects of the intense rains and maximum floods that occurred in the first months of the years 1982, 1998, 2017 and 2023, the basin of this river has suffered major floods, and this affected a large part of the population, farmland and local infrastructure, so it is necessary to address its study in terms of the extent of flows, for prediction and prevention purposes.
In this sense, the objective of this research was to generate flows through the application of a simple method of flood routing known as Muskingum to monthly level, in the La Leche basin of Peru. The use of Muskingum method, as indicated by the previously cited investigations, has demonstrated the great performance of this methodology in flow forecasting and in the determination of outflow hydrographs in basins, while being a simple method under the approach of flood routing makes its application practical and very accurate in the generation of flows from the data available at a hydrometric station, without the need to incorporate complex procedures and complementary elements to the climatic data of the study area.
2. MATERIALS AND METHODS
2.1 Study zone
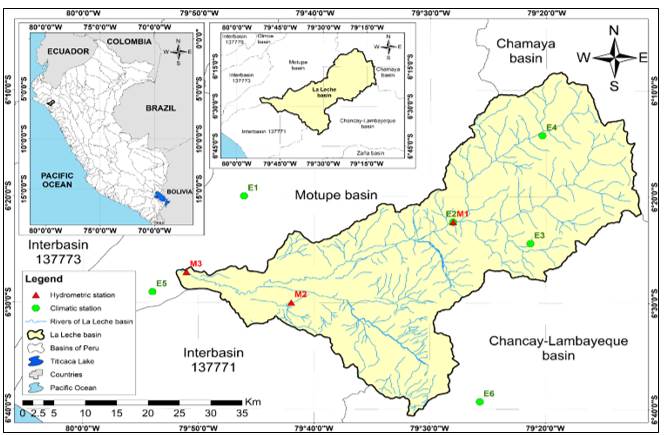
The La Leche basin is located in Peruvian northwest (Figure 1), between the geographic coordinates 80°00´ to 79°10´ west longitude and 6°00´ to 6°40´ south latitude. It also covers part of Lambayeque and Cajamarca Regions, which makes its location a strategic area in Peruvian northwest for the development of the population in the social, economic and tourist sectors. Likewise, the basin belongs to the Pacific 5 hydrological region, as it is one of the 17 basins that comprise this area (SENAMHI, 2017).
The contributing rivers from the sources of this basin correspond to the Sangana and Moyan sub-basins, where the Sangana River stands out as the main contributor, since it originates in the Andes mountain range of Peru. The basin area is 1606.61 km2, it has a perimeter of 297.25 km, with an average width of 16.03 km and the length of river is 100.25 km.
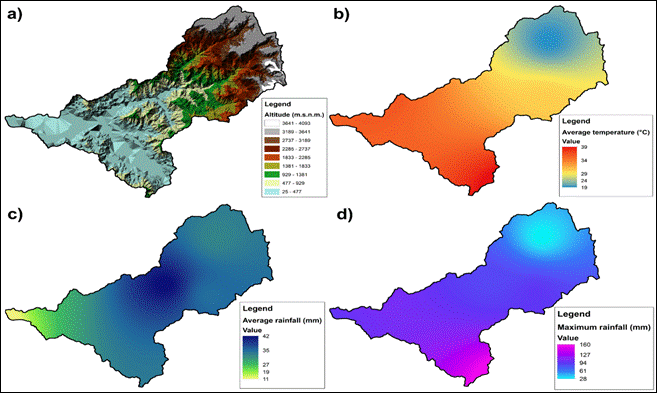
Regarding the altitude (Figure 2a), La Leche basin presents two zones with marked elevations. The first, commonly called the medium-low zone, whose extension is smaller, ranging from 25 m.s.n.m. up to 1833 m.s.n.m. The second part, known as the high zone, its surface is larger, varies from the upper level to 1833 m.s.n.m. up to 4093 m.s.n.m. Concerning to the average temperature (Figure 2b), the medium-low zone exceeds 30°C, even reaching 39°C and the high zone, its temperature drops to 19°C.
The average rainfall (Figure 2c) and the maximum rainfall (Figure 2d) are variable throughout the year; however, the maximum values are concentrated in the central part of the basin and due to its altitudinal characteristics, the concentration of rainfall tends to be generated in the upper zone and therefore discharges increase in the lower part of the basin.
2.2 Collection and analysis of information
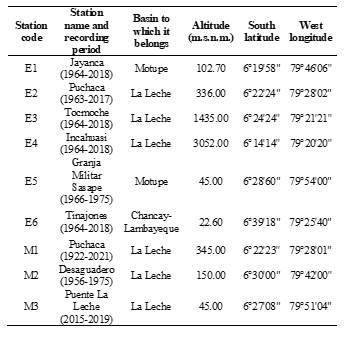
The collection of information made it possible to establish that the La Leche basin has three climatic stations (code E) and three hydrometric stations (code M) within its expansion area, while the other three climatic stations belong to the surrounding basins (Table 1). The available records of the mentioned stations were obtained from the free access virtual pages of Servicio Nacional de Meteorología e Hidrología (SENAMHI) of Peru and the Autoridad Nacional del Agua (ANA) of Peru. The period of records in each station was variable since a homogeneous length of data is not available for both rainfall and flows, as shown in the second column of Table 1.
To evaluate possible erroneous data, which could result from existing records or from some operational problem, a quality control was applied to the data from each station, starting initially with visual analysis using box diagrams at 95% of probability, to identify outliers (Lavado et al., 2013); also excluding the months that varied at least three standard deviations from the monthly average (Luna-Romero et al., 2018). As a reference, the box diagrams per month are shown (Figure 3), for the rainfall considered in the present study.
As indicated in Figure 3, the distribution of rainfall throughout the months is seasonal in this area of Peru, since in the first four months of year there is an increase in rainfall, while in the following periods it decreases gradually. The most notorious cases occur in the Puchaca climatic station (Figure 3c), Granja Militar Sasape climatic station (Figure 3d) and Tocmoche climatic station (Figure 3e).
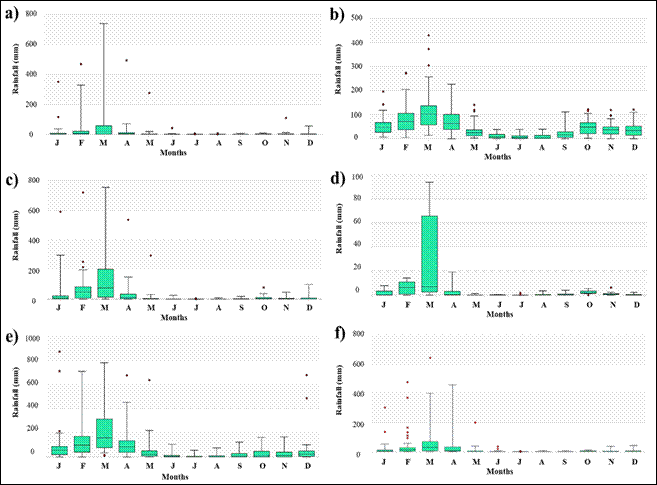
Figure 3 Box diagrams by month for each climatic station that registers rainfall: a) Jayanca, b) Incahuasi, c) Puchaca, d) Granja Militar Sasape, e) Tocmoche and f) Tinajones
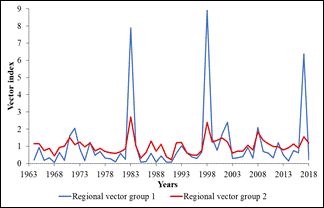
Another important aspect is the analysis of regional vector for the grouping of climatic stations according to the rainfall pattern (Arriola et al., 2022), since groups of stations can be conveniently formed in order to relate rainfall behavior in the La Leche basin. Therefore, this procedure is justified since, unlike other techniques, the regional vector has the particularity of considering a fictitious station, commonly called the vector index, which represents the average of all the other climatic stations. In that sense, it is possible to better represent a group of stations as homogeneous in relation to their location, altitude and rainfall within the basin or geographical area.
As indicated above, the regional vector was applied to La Leche basin, as shown in Figure 4, establishing two regional groups. The first group is made up of Granja Militar Sasape, Jayanca, Puchaca and Tinajones climatic stations, which are located in the lower-middle zone of the basin. While the second group 2, is made up of Incahuasi and Tocmoche climatic stations, which are located in the upper part.
The comparison of the vector indices shows that in both groups there is a marked difference in terms of the years 1983, 1998 and 2017, where extreme events were directly related to the El Niño Phenomenon, as shown in their results by Arriola et al. (2022), Carrizales et al. (2022) and Peña et al. (2023).
Regarding the availability of hydrometric information, as mentioned above, the La Leche basin has three stations that record daily flows, whose distributions are shown in Figure 5. The Puchaca hydrometric station (Figure 5a) stands out for having a longer recording period than the other two stations. Because it is an important station not only for forecasting possible floods, but also for the use of water for irrigation purposes of the main crops in the Lambayeque Region, which is why it is always under constant maintenance.
In addition to the range of flows, a peak value close to 160 m3/s stands out as a result of the rains that occurred in 1998. In the case of the Desaguadero station (Figure 5b), there are only records up to the end of 1975 and they have consecutive peaks of up to 50 m3/s. Regarding the Puente La Leche station (Figure 5c), information is available since 2015. Consequently, only the extreme value recorded in mid-march of year 2017, whose maximum flow was 250 m3/s, is shown.
2.3 Methodology and application of Muskingum method
The methodology was of applied type and of comparative non-experimental design, since it sought to simultaneously examine similarities and differences in the generation of flows, both from historical records and those obtained through hydrological simulation with respect to those generated by the flood routing applying the Muskingum method for the La Leche basin.
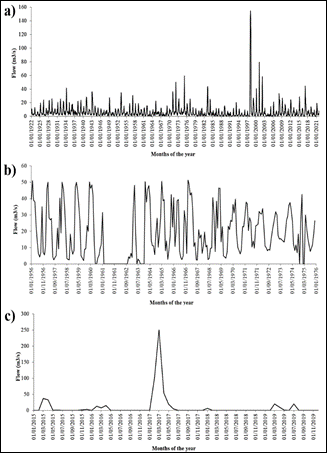
Figure 5 Historical record of flows of the hydrometric stations belonging to the La Leche basin: a) Puchaca, b) Desaguadero and c) Puente La Leche
The Muskingum method had its origin in the study and control of floods in the areas surrounding the Muskingum River and was proposed by The United States Army Corps of Engineers (USACE) in 1938, so it turned out to be a very practical and precise procedure for the evaluation of flood routing (Aboutalebi et al., 2016; Akbari et al., 2021).
In this context, the researchers Pazos & Mayorga (2019) indicate that this flood routing is also very simple, since it is developed by analyzing the total routing (S) or also called as storage in a section of channel of a basin; which is affected by the volume proportionality constant in a certain interval of time (K j ) and the weighting constant of routing along the river (X j ).
The practical utility of this methodology is evident, for example, the catastrophic nature of a flood is directly related to the highest point of a hydrograph, so it is essential to calculate how that peak flow decreases as it progresses in time. The basic expression of flood routing is described as shown in Equation (1), as stated by Ehteram et al. (2018); Alhumoud & Almashan (2019) and Arriola et al. (2021).
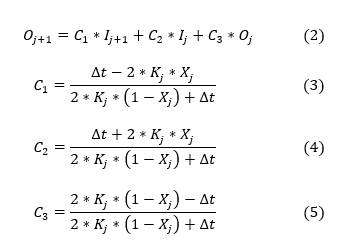
Where S is the total routing, K j is the volume proportionality coefficient, X j is the weighting of routing along the river or section analyzed in the basin; I j is the input flow and O j is the output flow in a certain time interval (∆t). Subsequently, the Muskingum method itself indicates the general formula for flood routing for flow generation, as indicated in Equation (2), which in turn considers three dimensionless constants called C 1 (Equation 3), C 2 (Equation 4) and C 3 (Equation 5), it should also be noted that these constants when added must be equal to unity (Norouzi & Bazargan, 2022).
Where O j+1 is the outflow after the initial outflow and I j+1 is the inflow of the next position in the analysis of flood routing.
2.4 Hydrological modeling
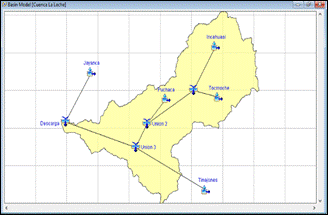
The process known as rainfall-runoff is one of the most complex hydrological phenomena, however, when historical meteorological information is available, the simulation results are very useful for flood control and water resource planning (Rad et al., 2022; Sayed et al., 2023). Therefore, the hydrological modeling applied to the La Leche basin, was of the rainfall-runoff type, using the HEC-HMS software (Figure 6).
Then, the output hydrographs were obtained in each hydrometric station of the La Leche basin for the return periods of 5, 25, 50 and 100 years, and subsequently compare the flows simulation with respect to the flood routing equations using the Muskingum method.
3. RESULTS AND DISCUSSION
Regarding the results obtained from the parameters of Muskingum method per month and for each hydrometric station (Figure 7). It can be noted that in all cases, the highest values correspond to the parameter K j reaching close to 1.00 and the lower range corresponded to X j oscillating in 0.10. Likewise, the dimensionless constant C 2 is the that present variation, reaching up to 0.44, while the constants C 1 and C 3 were around of 0.29.
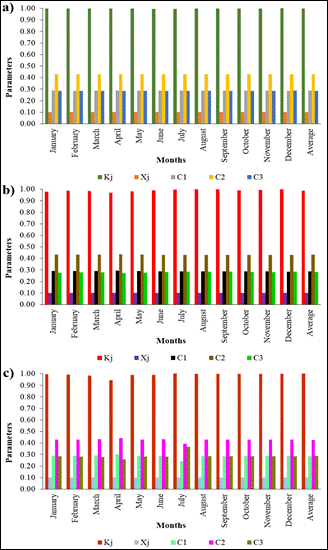
Figure 7 Parameters of Muskingum method for each month for hydrometric stations: a) Puchaca, b) Desaguadero and c) Puente La Leche
Subsequently, the general flow equations for each of the hydrometric stations were determined from the balance of the flow records and using the average parameters of Muskingum method to monthly level. The final Equations (6), (7) and (8) correspond to the Puchaca, Desaguadero and Puente La Leche stations, respectively.
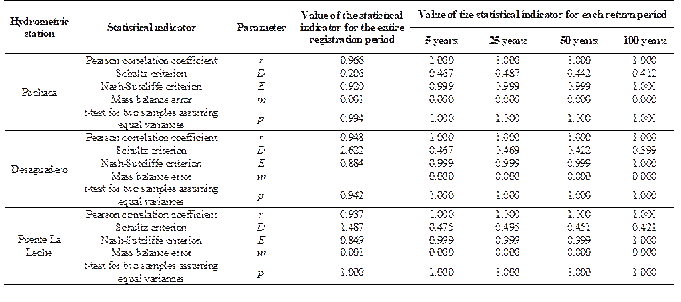
After obtaining the equations of Muskingum method, the flows were generated from the historical records available at each hydrometric station, for which it was necessary to use five statistical indicators to optimize their comparison (Table 2), achieving very significant results in each of the cases analyzed.
The statistical indicators applied in the present research are some of the most recommended for the evaluation and comparison of observed and calculated data, especially in cases where flows and precipitations from some hydrological modeling for basins are analyzed, as recommend Oñate-Valdivieso et al. (2016), Balcázar et al. (2019), Hernández-Romero et al. (2022) and Colín-García et al. (2023).
The Pearson correlation coefficient (r) was obtained by applying Equation (9):
Where n represents the number of data from the respective hydrometric station, x represents the flows obtained with the Muskingum method, and y represents the flows recorded at said station.
The statistical indicator called the Schultz criterion (D) was obtained by applying Equation (10):
Where Q sim is the flow obtained with the Muskingum method of the respective hydrometric station, Q i is the flow registered in said station, Q max is the maximum flow of the historical record of said station and n is the available number of historical records of the respective station.
The statistical indicator called the Nash-Sutcliffe (E) criterion was determined by Equation (11):
Where Q sim is the flow obtained with the Muskingum method of the respective hydrometric station, Q i is the flow registered in said station and / is the average flow of the historical record of the respective station.
Regarding the statistical indicator mass balance error (m), Equation (12) was applied:
Where Q sim is the flow obtained with the Muskingum method of the respective hydrometric station and Q i is the flow rate recorded at that station.
The t-test for two samples assuming equal variances, as represented by Equation (13), was employed for statistical analysis.
Where/is the average value of the flows obtained with the Muskingum method in the respective hydrometric station,/is the average value of the flows registered in said station, n
1
is the quantity of flows obtained with the Muskingum method in said station, n
2
is the quantity of flows registered in the respective station,
 is the variance of the flows obtained with the Muskingum method and
 is the variance of the flows registered in the respective station.
Also, Table 2 shows the values of the statistical indicators for each return period, which were established from the comparison of the flows of the output hydrographs of hydrological modeling in each hydrometric station in relation to the flows generated with the flood routing of Muskingum method to monthly level, which is consistent with what was done by Badfar et al. (2021), Alhumoud (2022), Kadhim et al. (2022) and Rad et al. (2022).
The results of these indicators generally show very good correspondences. The Pearson correlation coefficient (r) had a minimum value of 0.937 and a maximum of 1.000 (very high to perfect correlation). Regarding the Schultz criterion (D), it varied between 0.206 and 2.622 (very good correlation). For the Nash-Sutcliffe (E) criterion, the range was from 0.849 to 1.000 (excellent correlation). In relation to the mass balance error (m) it ranged from 0.000 to 0.502 (very good to perfect correlation). Finally, the ranges of the t-test for two samples assuming equal variances exceeded 5% of significance, as the values ranged from 0.942 to 1.000 (very significant equality of flows).
Consequently, these results of the statistical indicators point to the high accuracy that exists between the flows of the historical record of each station with respect to the generation of flows through the application of flood routing. These ranges are analogous with the results reported by Arriola et al. (2021) and Kadim et al. (2021).
Then, the flood routing distribution maps were generated (Figure 8), in order to adequately visualize the flow ranges obtained for the return periods of 5 years (Figure 8a), 25 years (Figure 8b), 50 years (Figure 8c) and 100 years (Figure 8d). An interpolation method based on inverse distance weighting (IDW) was used for this analysis (Wang et al., 2022).
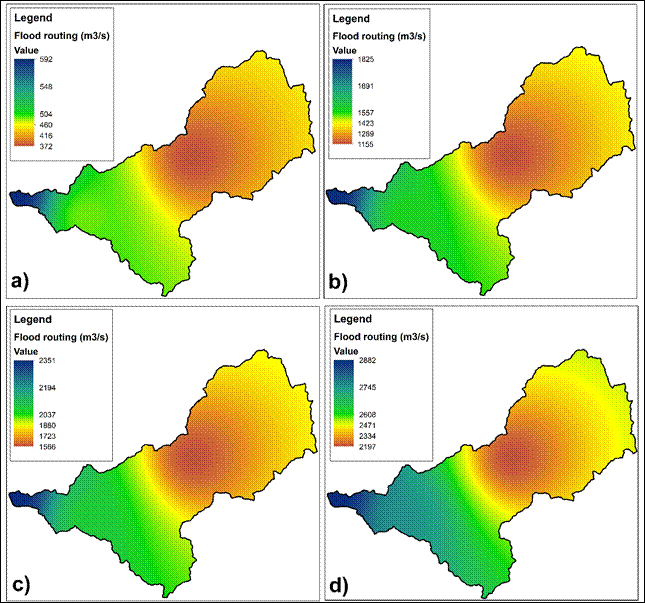
Figure 8 Flood routing generated from the monthly flows for the La Leche basin in different return periods: a) 5 years, b) 25 years, c) 50 years and d) 100 years
This IDW technique is appropriate when there is a need to quantify values in areas where data are not available, as it correlates them with stations that do have complete values, much wider ranges of the meteorological variable under study can be obtained (Arriola et al., 2022; Tan et al., 2021; Vargas et al., 2021). In addition, the application of IDW in the La Leche basin is justified because it is a simple and accurate methodology for determining the required flows and also, additional information is not needed beyond that available at each hydrometric station.
However, as could be observed in the previous findings, the interpolation with the IDW method cannot be exceeded for return periods of more than 100 years, since the flows in the lower zone tend to decrease. This is due to the fact that the “Puente La Leche” hydrometric station, which is located downstream, at the discharge point of the basin, has few years of records, which, unlike the other hydrometric stations, do present higher ranges of flow records. Therefore, an extension of the monthly flows applying the Muskingum method specifically in this area of the La Leche basin would represent a much greater extrapolation to the available data.
The results of flood routing for the La Leche basin, as shown in Figure 8, also indicate an increase in flow in an east to southwest direction as the return period progresses. This pattern is characteristic of the North Pacific basins of Peru, as reported by the investigations of Arriola et al. (2021), Rollenbeck et al. (2021) and Arriola et al. (2023). Furthermore, this sequence of hydrological behavior has been influenced in recent years by extreme events due to the El Niño Phenomenon (Aguirre et al., 2019; Carrizales et al., 2022; Peña et al., 2023).
On the other hand, these results confirm the findings by Tahiri et al. (2022) and Moradi et al. (2023), since, as demonstrated in the present investigation, the Muskingum method is an efficient technique in terms of flow generation from historical records available from hydrometric stations, especially in the data processing time, the application equations and flood routing estimation parameters.
4. CONCLUSIONS
The flow data were generated by means of a simple flood routing using the Muskingum method to monthly level from the analysis of the information available of three hydrometric stations and hydrological modeling of the La Leche basin of Peru, whose comparison criteria were based on five statistical indices. This showed in all the cases studied very significant results and very good correlations, which leads to the conclusion that the method is valid for its application in various hydrographic basins.
The Muskingum method can also be used to validate simulated discharges in a basin, where meteorological and hydrometric information is available, from which maximum flows can be predicted for different return periods using the general equation of flood routing and their respective parameters, as it could be verified in the present investigation.


