INTRODUCTION
One of the most notorious advances of today's society is the development of technology, with the consequent increase in the demand for electrical energy, in its different forms, establishing a progressive complexity of electrical power systems in terms of generation, transmission, subtransmission and distribution of energy and, therefore, reconsider mechanisms to reduce electrical energy losses and thus have more efficient power electrical systems.
In this sense, Acevedo & Pimentel (2014), Reinoso & Salazar (2017) and Pérez, Garcia & Díaz (2020) affirm that electricity is a public service, that is available all the time, in most places and that has a wide range of applications. Since it cannot be stored on a large scale, it is generated at the same time and in the same amount that is consumed and has to be transmitted instantly from generation to consumer through transmission lines. As a consequence of these special characteristics, the electric power system must be designed to satisfy the maximum expected demand. Furthermore, depending on the type of generating plants that are in operation at different times of the day, the production efficiency and the cost of fuel burned in thermal plants can change significantly.
In addition, electrical energy losses are common and inherent to electrical companies and often become a serious problem when they exceed certain logical and pre-established limits. These increase the consumption of total electricity generation; therefore, it is necessary to generate more, with the consequent loss of energy resources. Energy losses are an indicator of efficiency of any electrical energy system.
For example, Fernández (2017) emphasizes that in Spain these losses represent approximately 8.9% of the energy in the network, in the United Kingdom, the losses are 7.92%, in Germany 6.74%, in France 5.40%, Austria 6.29%, the United States 6.29% and Australia 5.06%.
According to statements from the Ministry of Energy and Mines and the studies of Cruz, Escalante & Pérez (2021), as a whole, in Cuba, the losses in the transmission and distribution systems represent 14.45% of the total electrical energy produced. Typically, the losses are approximately 3.5% in the transmission system and 10.95% in the subtransmission and distribution system. These electrical losses vary according to the configuration of the network, determined by the location and production of the generators, the location and demand of the clients. In particular, electrical power losses during periods of high demand or on overloaded lines are often much higher than under lower load conditions. This is because there is a quadratic relationship between the electrical losses and the current flow in the line.
In correspondence, Horta (2007), Morales, Alvarado & González (2021) and Dávila, Trujillo & Jaramillo (2022) assure that it is important to classify the most common causes that make electrical systems to be inefficient, essentially, they are associated into four groups:
Deficient design: due to a misconception from a design point of view, materials, manufacturing process, equipment and/or systems lead to wastage of electrical energy, for example, the use of inefficient light bulbs or their use of wrong way before the principles of the rational use of energy;
Inefficient operation: even when electrical power systems are well designed, they can be operated irresponsibly, for example, keeping an idle room unnecessarily lit;
Inadequate maintenance: a part of the electrical losses could be minimized through adequate corrective and preventive maintenance procedures, which includes the correct adjustment and control of the systems, so that they maintain, as far as possible, the performance of the conditions originals.
Operation of loads during peak hours: when all loads operate at times when the kWh cost is higher, losses in energy generation are caused.
In this sense, Ojeda (2010) and Borges, Puch & Frías (2017) state that it is of vital importance in the current economic situation of any country to reduce the costs associated with the consumption of electrical energy and with the capital investments in the electrical equipment used in the industrial and service facilities. In addition, this need is enhanced by the environmental impact of the dominant energy technologies.
As already mentioned, the levels of electrical losses constitute an important measure of efficiency and financial sustainability of the electrical sector. The losses in the transmission of energy are a reflection of the level of efficiency of the infrastructure in the transmission and distribution of electrical energy. Electricity delivered but not billed, which translates directly into financial losses and serves as an indicator of the operational performance of electric companies, is also closely linked to the concept of electric losses.
Therefore, reducing the levels of electricity losses can contribute to achieving the objective of universal access to modern energy sources, and would translate into additional income for electricity companies with consequent improvements in cost recovery and financial sustainability. In the medium term, they would contribute to improving the capitalization of the electricity sector and its investment capacity.
Also, as Pérez, Santos & Llamo (2021) state that the reduction in loss levels would imply a decrease in greenhouse gas emissions, as well as a reduction in electricity rates for the final consumer. The increase in billing would not only increase the income of the electricity sector, but would also send a signal to the market to discourage excessive consumption and encourage energy conservation practices.
The analyzes show that, if high growth and development prospects are to be achieved, great attention must be paid to reducing energy losses and improving energy efficiency in companies, industries, public institutions and for all energy actor players. In this context, it is absolutely essential to promote and monitor government programs to consistently evaluate actions and estimate results.
There are different measures to consider for savings in electrical systems of industrial or service companies. One of the most used is the control of the maximum demand (MD) and the consumption of electrical energy.
Authors such Cañizares, Rivero, Pérez & González (2014), Hurtado & Escamilla (2015), Borges, Puch, & Frías (2017), Luben (2020) and Álvarez, Montelier, Oviedo & Bello, (2021) suggest that carrying out a good control of the maximum demand and the consumption of electrical energy, by manual or automated methods, allows to reduce the costs associated with consumption by means of guaranteeing a lower energy expense in peak hours where the value of the electric power is higher, the reduction of transformation losses, the reduction of the payment for maximum demand if the tariff considers this aspect, as well as the improvement of the system's operability in general.
In addition, the authors themselves refer that effective control makes it possible to determine optimal investment policies in the electrical system, in order to guarantee greater security and quality of electrical supply.
On the other hand, Rey (2013) and Borges, Puch & Frías, (2017) argue that, in Cuba, the residential sector represents approximately 50% of energy consumption at the country level. For this reason, the hours of greatest demand are recorded between 5:00 p.m. and 9:00 p.m. and the electricity tariff system establishes for its main clients, higher costs of the energy consumed in this period, considered as peak hours, for which displaces the loads towards other periods of the day, mainly at dawn. This produces a considerable decrease in the national maximum demand and increases the minimum, called valley, which is also beneficial, since the cost of energy production is much lower at that time while allowing greater stability to the electrical energy system.
Correspondingly, according to Luben (2020), the National Office for the Control of the Rational Use of Energy insists on the need to increase savings in electricity consumption, especially during times of maximum demand in Cuba, where the generation is from diesel. Therefore, it is necessary to activate the managers of the companies to carry out load accommodations, which consists of establishing the operating itinerary of the auxiliary receivers, in such a way that minimum energy consumption is obtained during peak hours, with minimum demand, maximum and minimum discontinuity of the chronological load curve, thus helping to save electricity in the country.
In this sense, the study of electrical load accommodation constitutes a manual demand control procedure that can be modeled by means of an optimization problem with a discrete search space, which allows knowing the behavior of the connected load, its working regime. and the hours in which the different loads coincide. With these elements, the company can establish its limits of demands and consumption at the different hours of the day, elaborated on technical bases and in accordance with its real possibilities.
Consequently, when analyzing the way to put load accommodation into practice, care must be taken not to affect production and study the different variants that allow consumption to be transferred from peak hours to other more appropriate hours.
Traditional methods for this type of problem do not ensure an effective solution since in most cases they are based on empirical criteria.
Based on the above, the objective of this research is to implement in the free software Scilab a program with a graphical interface that allows the analysis of the arrangement of electrical charges in industrial systems and in turn provide energy engineers with a tool to educate themselves on the subject. As a case study to validate the proposal was taken the Company Pintura Vitrales located in San José de Las Lajas, Mayabeque, Cuba.
MATERIALS AND METHODS
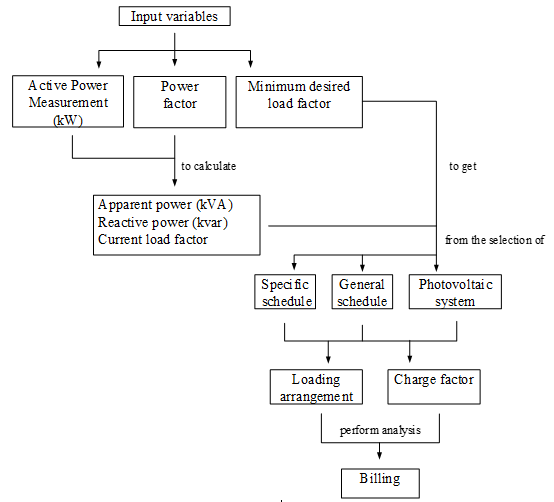
In order to develop the objective of this research, it was necessary to verify existing theoretical studies and search for accumulated scientific knowledge regarding the analysis of demand control in industrial electrical systems and the use of free professional software. For which, it was consulted a total of 14 bibliographical references, in addition to catalogs and technical standards, which allowed together with the case study to develop the application proposed here using the methodology presented in the conceptual map of Figure 1. Correspondingly, for a better understanding of the algorithm programmed in Scilab, a flow chart is shown in Figure 2 where the input variables and the results of the proposal are explained.
The software used for the proposal through simulation is the free software Scilab, which incorporates a large group of packages for scientific computing, mainly oriented to numerical calculation, to matrix operations that are very useful for the development of engineering applications.
While it is possible to use it simply as a calculator, its potential lies in the hundreds of built-in functions and its graphical capabilities. It is, in itself, its own programming language, which allows us to use libraries from other languages through an intermediate layer of software. It is very close to high-level languages such as Fortran, C and similar, giving users the possibility of developing their own scripts.
It should be noted that within the benefits of the software is the development of simulations from the creation of scripts for the programs, functions or own libraries, in the simulation that is proposed the benefits used from the graphical environment through a graphical interface.
In this sense, the methodology used was successive iterations based on the selection of the schedule to carry out the load adjustment and the desired load factor.
DISCUSSION AND RESULTS
As already mentioned, the accommodation of electrical charges is legally required of older consumers and constitutes a source of saving energy and financial resources. This procedure has as objectives the smoothing of the load graph, the reduction of the demand particularly in the peak hours, the
improvement of the power factor and the reduction of the energy costs through a group of technical and organizational measures of management of the loads.
Its implementation requires a previous study that includes the inventory of all loads, the collection of primary data referring to electricity billing, obtaining the consumption rates that can be applied, the behavior of the power factor and the maximum demand.
The study of load accommodation allows to know the behavior of the connected load, its work regime and the hours in which the different loads coincide, with these elements the companies can establish their limits of demands and consumption at the different hours of the day, elaborated on more technical bases and according to their real possibilities.
The adequate statistical processing and its analysis with the help of chronological curves of daily load and Tables, allow
highlighting the most important consumers and discovering regularities, which can help decision making.
Chronological load curves and demand factor
According to what was stated by Pérez, Núñez & Ramos (2022) the preparation of the chronological load curve can be used as one of the tools to characterize the consumption of electrical energy of independent receivers, groups of receivers or an installation in general. Under operating conditions, it can vary arbitrarily over time, considering the requirements of the flow of production or services.
In the solution of most of the problems of the exploitation of electrical systems, load curves are essential. Its use requires measurement during at least one characteristic activity cycle.
In this sense, authors such as Pérez, González & Martínez (2013) and Borges, Puch & Frías (2017) define that in an industrial system, a characteristic activity cycle depends on the type of consumer, for example:
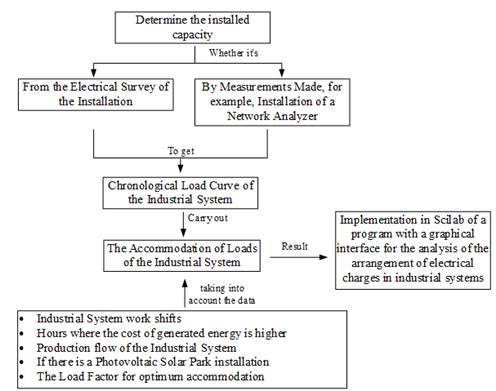
Figure 1 Proposed methodology for the implementation in Scilab of the proposed software (Source: self-made)
For productive entities, such as industries, it is merely the time that elapses from the input of the raw material to the process, until the latest output of production, under normal operating conditions, that is at normal productive capacity and at the time of the year and days of the week where there is traditionally the greatest demand and consumption of electricity. Sometimes the productive entities constantly process their raw material in the different stages of production development. In this case, the cycle can be shortened by taking this aspect into consideration.
For service entities such as commercial establishments or others, it is the total duration of the services provided at normal availability and at the time of the year and days of the week where there is traditionally the greatest demand and consumption of electrical energy. In this case, the unit of business day, 24 hours, of the entity is almost always sufficient.
Currently, to obtain the chronological load curve, the most suggestive method results from the use of network analyzer instruments, which make it possible to monitor the behavior of the variables that characterize consumption, both permanently and occasionally.
Another important aspect is to determine the load factor (FC) of the installation, it is important to note that if all the electrical devices were to operate at their maximum capacity simultaneously, the maximum demand would be equal to the connected load. Experience shows that the actual maximum demand of a consumer is less than the connected load because all electrical appliances never operate at full load at the same time, so it can be defined mathematically in terms of power as shown in Equation 1:
Being less than or equal to one because all electrical devices never operate at full load at the same time.
In this sense, it is important to highlight that, for groups of receivers, this coefficient is an indicator of the discontinuity of the chronological load curve, since to the extent that it is greater, close to unity, the group regime of operation of the receivers expresses more continuous operation at that level, which is not always, means each running continuously, but can be used to indicate an operating regime accommodation.
Therefore, the greater the difference between demand and minimum demand, the less use will be made of the installed capacity of the industrial system.
In correspondence, the problem statement is that from a graph of hourly active power basis of a cycle of activity characteristic of a company, move the operation in time of the auxiliary electrical receivers, so such that minimum energy consumption is obtained during peak hours, with minimum maximum demand and minimum discontinuity of the daily load chronological curve. Therefore, we want to minimize the inverse of the coefficient of load desired by the user
Presentation of the design of the developed application
Based on the previous analysis and taking as reference the investigations of Pérez, López & Ramos (2021) and Ramos, Pérez & Silvério (2023), it was developed in the free software Scilab version 6.1.1, the Application of Load Accommodation in Industrial Systems for its first version, which aims to provide a work tool, from simulation, for electrical engineers in industries, allowing them to carry out load accommodation, and thus be able to be implemented.
Figure 3 shows the graphical interface of the application where a column is shown with the hours of the day and the other two columns correspond to the company data.
It should be noted that the application shows a set of data by default, which can be edited in correspondence with the analysis of the industrial electrical system to which the load accommodation is going to be carried out, these are:
P(kW): Power in kW that must be taken during each hour of the day at the Industrial System meter or by installing a network analyzer.
fp(pu): It is the power factor recorded in each measurement.
In addition, the application allows carrying out load accommodation analysis with or without the incorporation of a photovoltaic system. It also provides the possibility of carrying out load accommodation from a minimum load factor selected by the user.
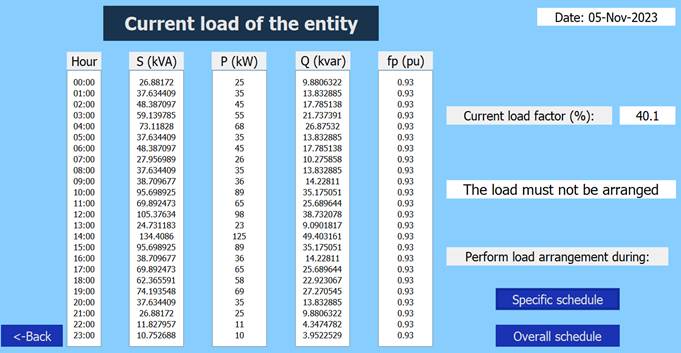
Once the data of the industrial system has been updated, the engineer must press the Calculate Load Factor button, showing the window of Figure 4. In this, it can be seen that the application shows the calculation of the current load factor of the Industrial System and informs the user if the load must be accommodated or not, making it possible to choose the time in which the load accommodation will take place.
In the event that the user chooses to accommodate loads at a specific time, the application allows them to make this selection, which can be the hours in which the entity where the study is carried out, works or the electrical peak hours predefined by the electrical power system.
It is important to point out, by way of summary, that within the practical potentialities that the application presents are:
Carry out load adjustment based on the daily load chronological curve, allowing the user to select the time in which he wants the load adjustment to be carried out.
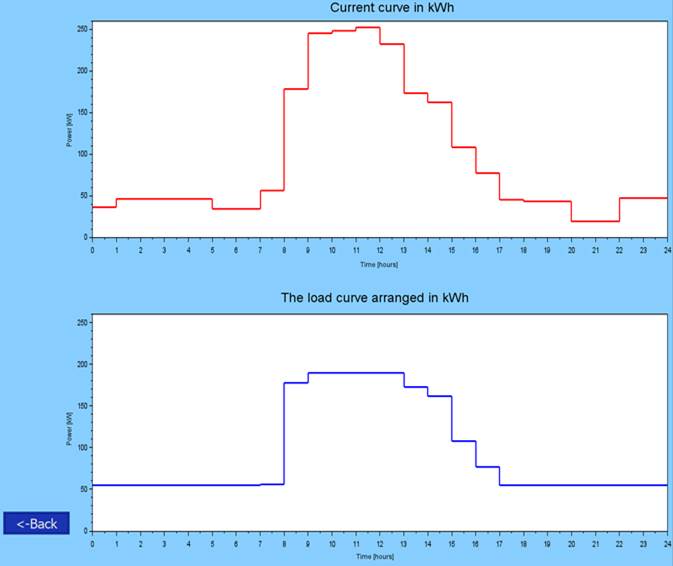
Once the load accommodation is done, it shows the chronological curve of daily load before and after the accommodation.
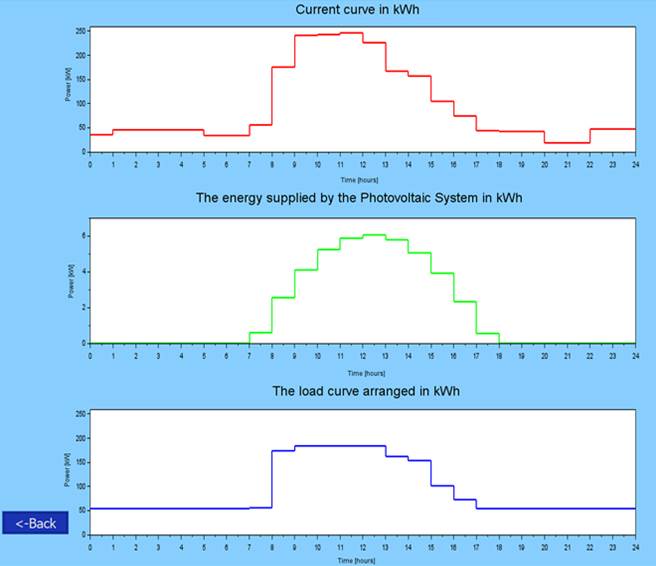
Provides the possibility of carrying out the same study, but now with the inclusion of photovoltaic solar panels.
Based on the billing studies carried out by Pérez, Santos & Llamo (2021), the application suggests after the study has been carried out, whether or not the maximum demand should be contracted and provides a value for its re-contracting.
On the other hand, it executes an analysis of savings for electricity billing after carrying out the accommodation of loads.
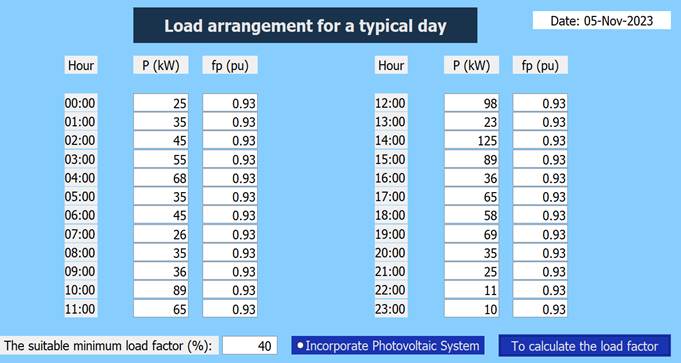
Figure 3 Graphical interface of the Load Accommodation in Industrial Systems application (Source: self-made)
Validation of the application from the case study
In order to verify the usefulness of the tool, it will be applied to the industrial system of the UEB Pinturas Vitral located in the municipality of San José de las Lajas, Mayabeque province, which has 2 work shifts, one of 24 hours, which is the resin plant - varnishes and another 8 hours that is the painting plant.
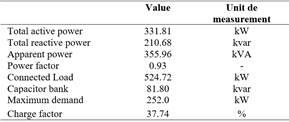
From the installation of a network analyzer, it was possible to obtain the data shown in Table 1.
Obtaining the chronological curve of daily load before carrying out the load accommodation, the maximum demand occurs at 11:00 am.
Based on these values and considering that the peak hours of the Cuban Electroenergetic System are from 11:00 a.m. to 1:00 p.m. and from 6:00 p.m. to 10:00 p.m., the application is used to carry out load accommodation in three (3) variants, it should be noted that an adequate minimum load factor of 50% was chosen for all variants:
Variant # 1: considering only peak hours from 11:00 a.m. to 1:00 p.m.
Variant # 2: considering the peak hours from 6:00 pm to 10:00 pm
Variant # 3: considering 24 hours a day.
Table 2 shows the summary results for each of the variants. It should be clarified that the minus sign in the comparative values of the maximum demand means that there was a reduction in it.
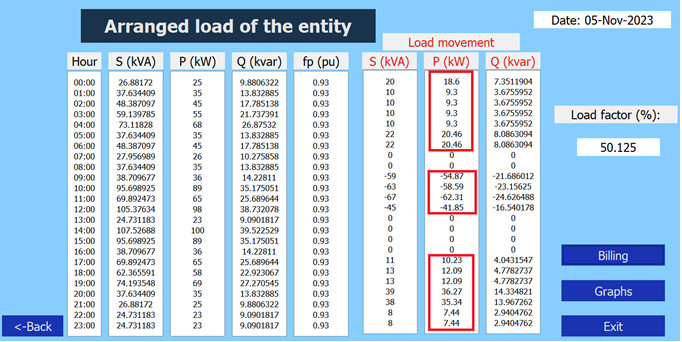
As can be seen, the best variant is variant # 3 since it is possible to reduce the maximum demand by 24.6% and increase the load factor by 32.5%.
For which it was necessary to move 234 kW from the time between 09:00 and 12:00, distributed in, 104 kW for the time between 00:00 and 06:00 and 130 kW for the time between 17: 00 hours and 23:00 hours respectively, as shown in Figure 1 of the annexes highlighted in red.
On the other hand, in the other two variants analyzed almost no significant changes were obtained.
Based on these results and the entity's own production flow, the following recommendations are made:
It is recommended that all air conditioners be turned on from 8:00 a.m. to 11:00 a.m. and from 1:00 p.m. to 4:00 p.m. in order to reduce the peak between 11:00 a.m. and 1:00 p.m.
The ball mills work 16 hours a day, but to eliminate their influence during peak hours, they start working at 2:00 pm, they are disconnected from 6:00 pm to 10:00 pm, until 6:00 am, thus achieving that they do not influence peak hours.
It is recommended that all equipment that is on unnecessarily be turned off, especially during peak hours.
Based on the load accommodation study, it is recommended to analyze the recontracting of the maximum demand to reduce this and thus, save a budget for billing.
In addition to the results shown, as already mentioned, the application offers the option of graphing the chronological curve of daily load before and after carrying out the load adjustment, these results are shown in Figures 2 of the annexes.
Now, to carry out the billing studies, the user must select the rate to which the industry is subject, in this case it is the M1-A. It is important to note that in this first version of the application they have implemented four types of rates according to the current resolutions.
Once the rate is selected, the engineer must provide the software with the maximum contracted demand and the K factor, which is expressed as a coefficient whose value reflects the proportion in which the weighted average of the prices of all fuels occurs, in this case it is equal to 4.2143.
The result obtained from the billing study, when carrying out the run with the application, was that it is recommended to recontract the demand to 229.0 kW, which will mean a saving for fixed charge of 23.67%.
On the other hand, with the objective of demonstrating the potential of the application to conduct studies on the installation of photovoltaic solar panels and to know how these will influence the load accommodation of the industry, the same study will be carried out, but now with the inclusion of solar panels.
If, when carrying out the load arrangement, the item incorporate photovoltaic system is selected, showing the direct irradiance and diffuse irradiance data obtained from the web page: https://www. renewables.ninja/ and it is loaded in an Excel file from which the app takes the data.
In addition, the application requests as additional data the efficiency of the panels to be installed as well as the area occupied by them and their form factor.
As a summary, Table 3 shows the effect that the inclusion of solar panels has on the industrial system.
In addition, with the inclusion of the panels, the application recommends that the maximum demand be recontracted to 220.0 kW, which represents a saving of 26.33% for fixed charge.
As additional data, the application provides the daily load curve of the photovoltaic solar panels, as shown in Figure 3 of the annexes.
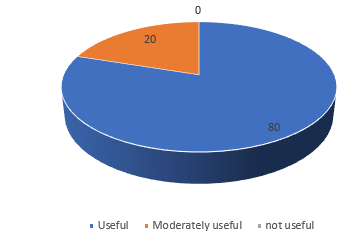
To compare the results obtained, five (5) electrical engineers were consulted with the aim of assessing the usefulness of the software as useful, moderately useful or not useful, the results are shown in Figure 4 of the annexes.
As can be seen, the application is considered useful by 80.0% of the specialists consulted and only one that represents 20.0% of those consulted refers to "modernly useful" because he considers that improvements could be made to the application in the future in terms of the inclusion of analysis of power factor and billing, in addition that it should be shown as soon as the maximum demand of the company decreased in a way
more explicit, aspects that will be considered for future versions.
Moreover, with the objective of assessing the utilities from the didactic point of view and how it can help to improve the teaching-learning process of electrical engineering students, 56 4th-year students of the electrical engineering career were interviewed. from the Technological University of Havana, which represent 85% of the current enrollment of the year.
The form that served as a guide for conducting the interview was structured as follows:
Question No. 1. In your opinion, do you consider that the proposed application helped you reinforce the theoretical-practical contents, as well as the development of skills?
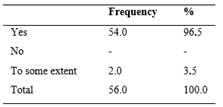
The responses to this question are shown in Table 4.
Analysis and interpretation: It is observed that 96.5% of the interviewed students consider that the application developed from the features of the free software Scilab helped them understand the theoretical contents taught in the conferences and to develop practical skills related to the subject of quality energy and load accommodation in industrial systems. On the other hand, only 3.5% state that the activities helped them to some extent, mainly basing it on the lack of skill when carrying out the simulations, an aspect that should be studied in future research to correct it. From these results it can be inferred that the developed application greatly helped improve the teaching-learning process of electrical engineering students.
Question No. 2. In your opinion, does the use of the application help you be more motivated by the race?
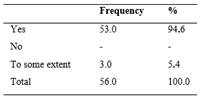
The responses to this question are show in Table 5.
Analysis and interpretation: the 94.6% of the students state that the use of the tool helped them be more motivated by the career, since the theoretical-practical knowledge acquired with the application is applied to real case studies of the profession.
Question No. 3. In your opinion, has the use of the application helped you exchange knowledge and skills with your peers?
The responses to this question are shown in Table 6.
Analysis and interpretation: 100.0% of the students emphasize that the use of the proposed application in the resolution of real case studies of the profession helped them to exchange information regarding the decision-making of load accommodation and fostering debate in equipment. This result shows that the integration of information and communication technologies from the conception of learning and knowledge technologies and technologies for empowerment and participation in the teaching-learning process through simulation improve collaborative learning. of students, especially when applied in problematic situations related to the profession.
Question No. 4. From the use of the application, do you consider that professional skills were developed?
The responses to this question are shown in Table 7.
Analysis and interpretation: the 71.4% of the students state that the use of the proposed application in the resolution of real case studies of the profession helped them develop professional skills, since it helped them understand the phenomenon of workload accommodation. In a visual and real way, experience is also gained from the simulation, since it allows selecting the best variant from the technical point of view.
CONCLUSIONS
With the completion of this work, it was possible to verify that the tool developed in its first version presents great practical utility for industrial engineers and students, since it not only helps engineers carry out different scenarios before implementing load accommodation of the best variant, but it helps students from their training stage develop technical skills from problem-based learning, which is considered of great practical utility. On the other hand, access to this tool is allowed free of charge, to support a greater reach, of those who cannot afford similar tools.


