1. INTRODUCTION
The growth in the number of cars has caused a drastic increase in traffic incidents worldwide mostly due to risky and irresponsible driving behaviors (Han et al., 2018; Thomas et al., 2017). The speed with which a vehicle is traveling is an important factor in traffic incidents. Traveling speed directly influences the risk of collision as well as the probability of serious injuries and death (Vadeby & Forsman, 2018). Car occupants traveling at speeds greater than 65 km/h have an 85% risk or more of dying in a collision between cars (Jurewicz et al., 2016).
Around 1,35 million people worldwide die each year because of road accidents, and it is estimated that another 50 million suffers serious injuries. Traffic incidents generate an annual cost to governments of approximately 3% of their Gross Domestic Product (GDP) (Dalve & Pinto, 2015). Traffic injuries is the second cause of death among young people in Latin America and the Caribbean each year. It was predicted that by 2022, there will be around 1,9 million people who will die from traffic accidents around the world (Organización Panamericana de la Salud & Organización Mundial de la Salud, 2019).
According to official data from the InterAmerican Development Bank (IDB), between 2005 and 2014 the vehicle fleet had an annual increase of 11.7% in the Andean Region (Colombia, Ecuador, Peru and Bolivia) which represents around 19,19 million more units. A total of 347 018 traffic incidents and 13 479 deaths accompanied the increase in car units in the Andean region during the referenced period (this represents 127 deaths per million inhabitants) (Organización Panamericana de la Salud & Organización Mundial de la Salud, 2019). The dramatic picture in the Andean contrasts with the one in the European Union (EU) where the number of deaths from traffic incidents felt to 50 deaths per million inhabitants between 2015 and 2016. The encouraging news come mainly thanks to the deployment of the so-called Intelligent Transport Systems (ITS) across the EU (Festag, 2014).
The world has witnessed great advances in autonomous technologies that form part of the ITS in the recent years. Artificial Intelligence (AI) is a fundamental part of such advancements since it helps controlling systems autonomously with minimal human intervention. The detection and monitoring of objects that interact on the roads as well as the automatic detection of traffic incidents are among the promises of AI for traffic research (Kyamakya, 2006). In South America, most high-speed highways have almost total coverage by Closed Circuit Television (CCTV), so videos can later be used as valuable input data for the creation of new AI applications (Dhaya, 2020).
In the present work, we focused on the detection of traffic incidents specifically of car collisions captured by static video cameras. Intelligent car collision detection systems allow transport systems to become simpler to use, more reliable and at the same time safer (Granada, 2018). The literature reports previous algorithms that use CCTV images for anomalies detection (Szegedy et al., 2019). Detected anomalies in car trajectories trigger Comprehensive Traffic Incident Management whose main objective is to respond safely and quickly to events that occur on the roads to avoid new incidents and to resume normal traffic conditions as fast as possible (Owens et al., 2010). To this end, several algorithms and machine learning techniques are being tested for the detection of traffic incidents. A set of such techniques uses a supervised learning approach to make decisions based on labeled data as part of a typical classification task.
Labeled data in the context of traffic incidents detection can be a set of video fragments where no incidents occurred (i.e. the null class) and a set of video fragments where incidents did occur (i.e. the positive class). Some of the most important algorithms used in supervised learning are K Nearest Neighbors (KNN), Logistic Regression and Support Vector Machines (SVMs) (Géron, 2017; Haydari & Yilmaz, 2020).
An important part of the traffic incidents detection task is the detection of objects involved in traffic, namely the cars. Today car detection in traffic videos is being solved with deep learning models which are based on special configurations of a basic convolutional neural network (Szegedy et al., 2019). One of the most used models for visual computing in open environments is the MobileNet Single-Shot multibox Detection (SSD) network intended to perform object detection. The MobileNet SSD algorithm is known for its good trade-off between latency and precision. Another lightweight convolutional model is ‘You Only Look Once’ (YOLO) which is described as extremely fast and accurate (Cheng et al., 2016; Kurdthongmee, 2020).
Another part of the traffic incidents detection task is speed calculation of the detected cars. Most of the available traffic incidents detection applications obtain car speed from dedicated sensors. The necessity for extra sensors drastically impacts the ubiquity of traffic incidents detection applications. Therefore, algorithmic based cars speed detection from video only data is desired. The so-called tracking algorithms can come to hand for the task since they are being actively used in video surveillance. Bi-directional tracking (forward and backward) has become a popular approach among tracking algorithms due to a higher reliability. MedianFlow, resistance to scale by correlation filter (MOSSE) and Kernelized Correlation Filter (KCF) are widely used examples of bi-directional tracking algorithms. MedianFlow, MOSSE and KCF can handle variations of scale in complex images sequence (Danelljan et al., 2014) and have greater robustness with respect to occlusion and displacement of the image contour using object centroids (Nascimento et al., 1999).
An important characteristic of transport systems is that they operate in a domain that is not simple. Modeling factor interactions, representing generalizations and then solving a particular classification task (i.e. the occurrence of an incident or not) pose many challenges. On top of that, labeled data of incidents that occur on the road is very scarce. For these reasons finding appropriate structures or modeling approaches with low labeled data requirements could help to solve the existing void in traffic incident detection (Haydari & Yilmaz, 2020).
Here we describe the creation of VARVO that stands for Vehicle Accident Recorder from Video Only. VARVO is a novel algorithm for the detection of traffic incidents that does not rely on sensors for cars speed detection. VARVO performs a supervised classification task based on the sequential use of convolutional network-based object detection and bi-directional tracking. VARVO is publicly available at: https://github.com/sbrgmoreno/VARVO.We believe that the deployment of VARVO linked to static surveillance traffic cameras can significantly reduce the negative impact of car accidents in the Andean region.
2. METHODS
The diagram in Figure 1 shows the research flow followed in the present study.
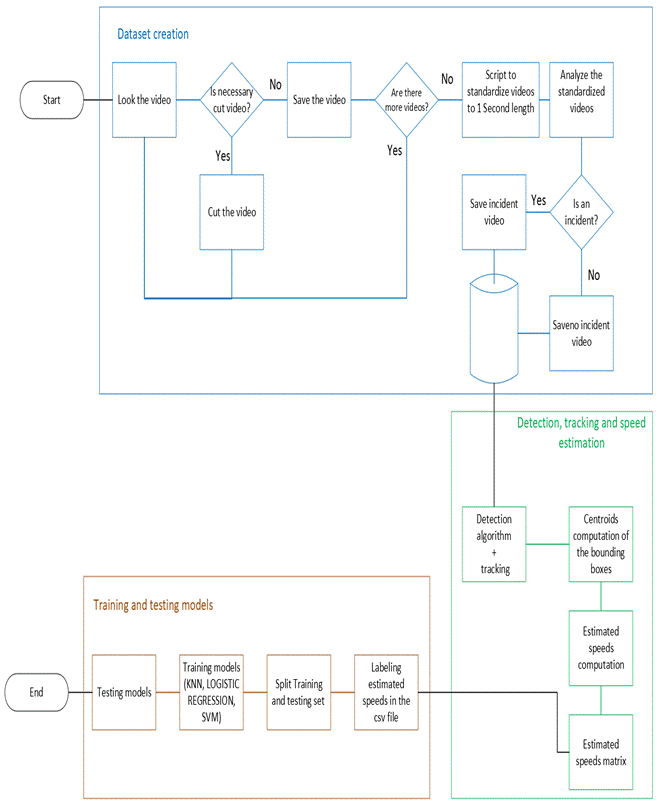
Figure 1 Flow diagram showing the steps followed in the present study. The entire rationale that started with Dataset creation and that ended with training and testing the resulting models
Traffic videos
A custom dataset of traffic videos including or not incidents was built from two open sources: i) the Anomaly Detection Dataset (ADD) (Sultani et al., 2018) and ii) the Car Accidents Detection and Prediction Dataset. (ADPD) (Shah et al., 2018). Both sources contain videos from static security cameras. The ADD contains raw surveillance videos covering 13 abnormalities such as: abuse, arrests, robbery among others and traffic accidents. Videos in the ADD have been collected and curated from YouTube and LiveLeak to discard manually edited videos and those taken by cell phone cameras. The ADD videos were downloaded from: Dr. Chen Personal Webpage (2023).
The ADPD contains videos collected from YouTube that report road accidents involving different vehicle types (e.g. buses, cars, motorcycles, and others). Videos in the ADPD were downloaded from: Shah. (2017).
Traffic videos trimming
All videos gathered from the ADD and the ADPD were trimmed to a total duration of 1s including the traffic incident. The remaining seconds of the video that did not include the incident were also trimmed into multiple 1s long control videos. As a result of the trimming step, our final dataset had the following composition:
27 999 1s long videos that do not contain traffic incidents (label = control class).
353 1s long videos that do contain a traffic incident (label = positive class).
Vehicle detection
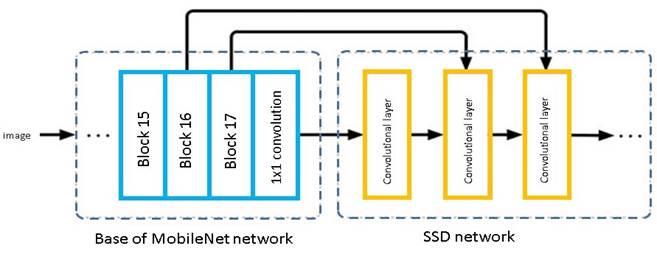
Vehicle detection on the 1s long videos was performed using either MobileNet SSD or YOLO v3 through a custom python script. MobileNet was run with the default parameters. MobileNet SSD network architecture is depicted in Annex 1. YOLO v3 was run using the settings shown in (1) to limit object detection to cars.
Vehicle tracking and speed estimation
For speed detection, each detected car in the video was tracked by one of the following algorithms: centroid, scale, KCF, MOSSE or MedianFlow. We used a custom implementation of the centroid algorithm. The scale algorithm was executed via the python module ‘dlib’. Implementations of MedianFlow, KCF and MOSSE were accessed via the python module ‘cv2’.
Tracking allowed us to obtain the coordinates that each detected car follows in the video. Vehicle speed was calculated by the following expression:
as reported in (Rajib et al., 2017). The distance in expression (2) corresponds to the Euclidian distance between two points: ( x 1 , y 1 ) and ( 𝑥 2 , 𝑦 2 ). Since all videos used in this work have 30 frames per second and because the first frame in the video was used as a reference, we estimated 29 speed values for each video and per each detected vehicle in the video. This corresponds to one estimated speed value per frame. The time it takes to move from one frame to the next is 1s / 30 frames = 0,033 seconds and was therefore the time value used in the expression in (2).
A set of vectors of 29 values each, corresponding to the estimated speed values per detected vehicle was used as input set for building a model that could classify each 1s long video as 0 (containing no incident) or 1 (containing an incident). In this stage each vehicle was treated as an independent instance. At the end, if a video contained at least one vehicle classified as involved in an incident, the video was classified as containing an incident. Videos were classified as containing no incident otherwise.
Model training and evaluation
Our dataset of 1s long videos containing 27 999 no traffic incident videos and 353 traffic incident videos was partitioned according to a 70% training / 30% validation ratio. The proportion of labels in the original dataset was kept in the partitions. As the reader might have noticed, our dataset shows an important class imbalance. Class imbalance is an intrinsic problem in the domain traffic incident detection since no incidents are a more common way than incidents.
Model training for the detection of traffic incidents was done using three classification algorithms, namely: K Nearest Neighbors (KNN), Logistic Regression and Support Vector Machines. A 10-fold cross-validation was conducted during model training thanks to the GridSearchCV function provided in the Scikit-learn python module. GridSearchCV is instrumental in obtaining models with improved accuracies. The hyperparameters used for model training in each case are described below.
KNN:
Number of neighbors: 1 to 10
Algorithm used: auto, ball_tree, kd_tree and brute
Distance calculation: manhattan, eculidean and mincowski
Logistic regression:
Penalty: l1 and l2
Inverse of the regularization force: 1, 10, 100 and 1000
Solution algorithms: newton-cg, lbfgs, liblinear, sag and saga
SVM:
Kernels: Poly, RBF and Sigmoid
A balanced dataset was also generated for training by using an over-sampling strategy via a bootstrapping algorithm available in the Scikit-learn python module. Model training on the balanced dataset was conducted as described above.
Model performance metrics
Classification accuracy and AUC-ROC curve were used as model performance metrics. The AUC-ROC curve metric was included in our analysis since it is considered the best way to establish the classification performance of the model.
VARVO implementation and availability
VARVO was implemented in Python. Detailed documentation including sample datasets and outputs are available at: https://github.com/sbrgmoreno/VARVO.
3. RESULTS
Model classification performance on imbalanced data
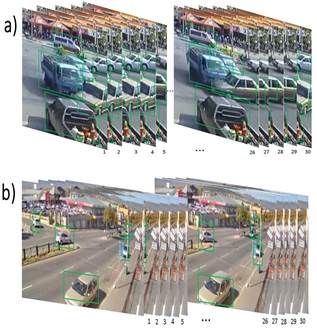
Figure 2 contains sample video frames that made part of the test set. Video frames in Figure 2a were properly labeled as positive cases by all used algorithms. Video frames in Figure 2b were properly labeled as negative cases by all used algorithms.
Table 1 shows the values of model classification accuracy obtained on the imbalanced dataset. As it can be seen, 0,98 was the highest classification accuracy which was achieved by various tools combinations.
Figure 3 shows the ROC curve that describe the performance of the best classification model trained on imbalanced data. AUC equals 0.96, model precision was 0.95 with a sensitivity of 0.96.
Table 1 Classification accuracy of models trained on the imbalanced dataset. LR: logistic regression. KNN: K Nearest Neighbors. SVM: Support Vector Machines

Table 2 shows the values of the AUC-ROC curve metric for each of the models trained on the imbalanced dataset. In contrast to the data shown in Table 1, the AUC-ROC curve data allowed us to pinpoint the YOLO v3, centroid and KNN combination as the best performing one.
Table 2 AUC-ROC curve values for the models trained on the imbalanced dataset. LR: logistic regression. KNN: K Nearest Neighbors. SVM: Support Vector Machines. The highest value is highlighted in bold

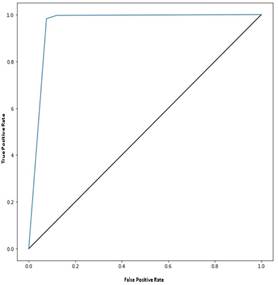
The confusion matrix for the best model trained on the imbalanced dataset (YOLO v3, centroid and KNN) is shown in Figure 4.
Model classification performance on balanced data
As mentioned before, we created a balanced dataset to compare the effect of class representation on model performance. Table 3 shows the values of model classification accuracy obtained on the balanced dataset. As it can be seen, 0,95 was the highest classification accuracy which was achieved by four models.
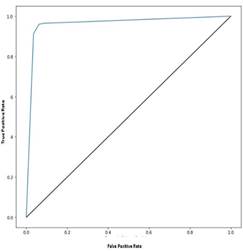
Table 4 shows the values of the AUC-ROC curve metric for each of the models trained on the balanced dataset. The best performing model corresponded to the combination of MobileNet SSD, MOSSE and KNN. Figure 5 shows the ROC curve derived from this model.
The confusion matrix for the best model trained on the balanced dataset (MobileNet SSD, MOSSE and KNN) is shown in Figure 6.
4. DISCUSSION
The growth in the number of cars has caused a drastic increase in traffic incidents. Intelligent Transport Systems (ITS) that are able to mine traffic information could help local authorities addressing traffic incidents more efficiently. However, several challenges are associated with such systems. One of such challenge is creating an effective classification model can be a challenging endeavor if the data used to train the model are imbalanced. Authors like Vallejos et al. (2021) proposed a system to mine social networks to detect traffic incidents to circumvent training and classification tasks. Other authors have proposed other types of ITS for Latin-American cities that do not rely entirely on classification models (Maldonado-Silveria et al., 2020; Salazar-Cabrera et al., 2019)
Despite the associated challenges, in the present work we decided to deal with class imbalance which is a problem that is common to many application domains, and it is especially present in traffic video research for the detection of car incidents. When examples of one class in a training dataset vastly outnumber examples of the other class, traditional machine learning algorithms tend to favor classifying examples as belonging to the overrepresented class. Typically, it is the examples of the positive class that carry the highest cost of misclassification (Mohammed et al., 2020).
Table 3 Classification accuracy of models trained on the balanced dataset. LR: logistic regression. KNN: K Nearest Neighbors. SVM: Support Vector Machines

Table 4 AUC-ROC curve values for the models trained on the balanced dataset. LR: logistic regression. KNN: K Nearest Neighbors. SVM: Support Vector Machines. The highest value is highlighted in bold

Our results showed a significant decrease in the misclassification of the positive class when a balanced dataset was generated. The percentage of misclassification of the positive class varied from 35,95%, shown by the best performing model on the imbalanced dataset to only 1,74% on the balanced dataset.
Although both under sampling and oversampling techniques have been proposed to alleviate the problem of class imbalance, we decided to use the oversampling approach. Oversampling does the task by adding examples to the minority class and therefore results in no loss of information compared to the under sampling which consist in removing examples from the majority class. It is worth mentioning however that while no information is lost during oversampling, it is not without its drawbacks.
The oversampling algorithm using in VARVO is based on the duplation of instances from the minority class. When oversampling is performed by duplicating examples it increases model training times. In our case oversampling doubled the time used for training which could pose technical challenges depending on the infrastructure available for the task. Despite the evident benefits we got from the oversampling algorithm that was used in terms of misclassification reduction, the computational costs associated with it make us think in alternatives for future versions of VARVO. In this direction, boosting appears to be an attractive alternative to improve classification performance. Algorithms like AdaBoost can be tested in coming versions of our application to investigate its application in the domain of traffic incident detection in presence of class imbalance.
Our results also showed that KNN was the best performing tool for the classification task even in the presence of class imbalance. This is a very convenient result since KNN demands less computational power than SVM algorithms. The classification performance of models based on Logistic Regression or SVM pointed to the fact that these tools are prone to over-fitting when the classifier were applied to the imbalanced dataset as it has been previously reported (Santos et al., 2018).
VARVO performance allowed us to properly answer the request question that guided our research and stated that it is in fact possible to detect car crashed accurately by means of supervised learning methods and from video-only data.
5. CONCLUSIONS
Overall VARVO appears to be an attractive and accurate alternative for the detection of traffic incidents from video only data which eliminate the dependency on sensors to detect vehicle speeds. The low data requirements of VARVO makes it amenable for practical applications in the domain of traffic video research, a domain where data scarcity, specially of the positive class have been extensively discussed. We believe that the deployment of VARVO could be linked to static traffic video cameras could be part of the foundations of Intelligent Transport Systems in Ecuador and other Andean countries where it is much needed.


