1. INTRODUCTION
Ecuador is one of the most biodiverse countries in the world, considering the number of species per unit area (Bravo, 2014). Its territory has a set of ecological, geographical and climatic conditions to denominate it as a megadiverse country (Finding Species, 2010). This diversity has become a strategic axis for Ecuador. Therefore, proposals are being implemented to conserve their wealth and to exploit resources in a rational way in order to ensure sustainable development (IGM, 2014).3 5 7 9 15 17 22
Every industrial process implies the generation of a certain impact on the environment that surrounds it (Escrig, 2008). However, activities such as exploration, production and transportation of oil are prone to cause major damage. Throughout the history of Ecuador, there have been several cases of environmental disasters related to oil industry, especially oil spills.
An oil spill represents the discharge (intentionally, by accident or by incorrect work practices) of hydrocarbons into the environment (Udoh, 2010). Oil spills are a major source of human contamination, as they can spread rapidly depending on the type of hydrocarbons and topographical and climatological conditions in the area (Zambrano, 2015). Effects produced by a spill can be persistent over time, putting lives of humans and species at risk (ITOPF, 2011).
Insufficient investment in infrastructure and research, lack of legislation and environmental education have been the main factors for developing countries not having considered the damaging effects generated by an oil spill (Lawler, Horst, & Champan, 2011). Specifically, in Ecuador, there are several historical causes that have caused oil spills such as natural disasters, technical and human failures, lack of environmental awareness of domestic and foreign companies, poor maintenance of oil facilities, sabotage and vandalism (Mohamadi, 2015).
Although we can not predict the occurrence of an oil spill, nor the degree of involvement that could cause in the ecosystem, we must be prepared by prevention and quick response tools to reduce possible environmental risks (Udoh, 2010). The updated contingency plans are the main procedures for dealing with oil spills (Mohamadi, 2015). A contingency plan is a program to achieve an immediate, organized and effective response to an emergency within the different phases of the oil industry; which details the actions, equipment and responsibilities of personnel to control, remedy and minimize the damage caused by an oil spill (Torres, 2011).
The areas where oil activities in Ecuador are developed, particularly protected areas, represent zones of immense ecological value worldwide. So, it is necessary to make environmental sensitivity maps that could be of vital importance for conservation of planet's biodiversity (OILWATCH, 2004).
These maps can be made using Geographic Information Systems (GIS), software used to manage geographic data that allows the integration of different types of information and communicate the results obtained visually (IPIECA, 2012). The advantage of GIS is that it improves the pre-contingency planning of an oil spill by establishing priority areas to be conserved and facilitates communication through a rapid information link (IPIECA, 2012). The use of GIS helps to minimize the effects that a hydrocarbon spill may cause on the environment and reduce the economic costs that should be incurred by companies in their remediation.
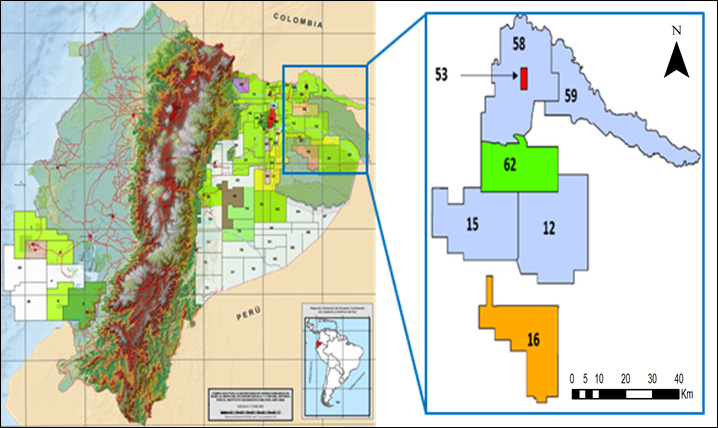
Secretary of Hydrocarbons, entity of regulation of oil activities in Ecuador, divided the country territorially into 83 areas called “oil blocks” (Figure 1). This division was carried out in accordance with Hydrocarbons Law, which establishes a space of no more than 200 000 hectares for the awarding of oil exploration and production contracts to operating companies. These oil blocks are designated by a number, a name and its operating company.
This research intends to identify areas prone to oil spills, to determine vulnerable areas that could be affected and establish optimal response times; analyzing patterns of occurrence of oil spills based on historical data in seven oil blocks of the Northeastern Ecuador. The results obtained in the present project will be of great relevance for state and private companies involved in the oil industry in Ecuador owing to the lack of similar studies in the area of analysis.
2. METHODOLOGY
2.1 Study Area
The zone of analysis is located in Northeastern Ecuador (Figure 1). The oil blocks studied were Block 12 (Eden-Yuturi), Block 15 (Indillana), Block 58 (Cuyabeno-Tipishca) and Block 59 (Vinita) operated by Petroamazonas EP, Block 16 (Iro) operated by Repsol, Block 53 (Singue) operated by Gente Oil and Block 62 (Tarapoa) operated by Andes Petroleum. These companies were in charge of the operation of the blocks of analysis at the time of the study.
2.2 Data acquisition
The Environmental and Social Reparation Program of the Ministry of Environment (PRAS-MAE) is the state agency that keeps the official count of oil spills in Ecuador. This institution makes a complete survey of information to determine its causes in situ and propose remediation programs. It is a legal obligation to operating companies to report oil spills and apply contingency measures to reduce possible environmental and social effects.
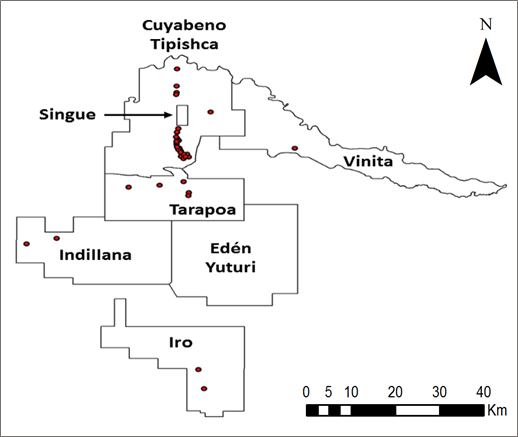
A total of 1168 oil spills have been registered from 1972 to 2015 in Ecuador by PRAS-MAE. Of this total, 61 oil spills are located within the investigated blocks, as shown in Figure 2.
Wells, platforms and production stations were obtained from PRAS-MAE database. Oil pipelines, roads, rivers, houses and villages were downloaded from the website of Instituto Geográfico Militar (IGM, 2015). The National Information System provided the layers of mass movements and flood zones (SNI, 2010). Finally, protected areas were drawn by georeferencing the map of the National System of Protected Areas of Ecuador. All these parameters will be used in later analyzes.
2.3 Data processing
Spatial analyzes were made using ArcGIS version 10.3. The processes and tools used in each of the stages of study are detailed below.
-
Causes of Oil Spills: Selections by attributes were used to establish the causes of oil spills in the study area and to determine what type of oil facility was associated (well, platform or oil pipeline). A generalized linear model for binary data was then performed using the program SPSS version 23. A total of 74 possibilities (61 oil spills, 14 random control points and 1 case excluded by the program) were taken, in which it is considered the probability that an oil spill occurs as a dependent variable and as categorical factors to its proximity to roads, houses, towns, rivers and flood zones. This statistical analysis allowed to determine if these environmental and social variables represent risk factors that could directly influence in the occurrence of oil spills.
Determination of Oil Spill Zone Prone (OSZP): The maximum impact radius reported in the 61 oil spills is approximately 100 meters, so that buffers of 300 meters were created around the points of location of these events. Then, areas with a pattern of occurrence prone to oil spills were drawn.
Determination of Vulnerable Areas: Vulnerable areas are the zones of primary protection when an oil spill ocurrs. For their identification, environmental sensitivity factors such as protected areas, flood zones, rivers, houses and villages in each block were superimposed on a map.
Response Times for Oil Spills: Information in the contingency plans by block was analyzed. Then, stations where it would be recommended to locate human and material resources, as well as the type of transport suitable to reduce response times against an oil spill were proposed. For a vehicle traveling by land, routes were drawn along the roads from the chosen station to the most distant points in which a particular oil facility is located. Also considering an average speed of 30 km/h (average speed of heavy transport on the roads in the East of Ecuador), maximum times of response were calculated. Finally, to determine the time it would take to arrive by helicopter at the most distant point of an oil facility in each block of analysis, trajectories of rectilinear flight were drawn and it was considered that in this type of emergencies the average speed is 180 km/h (Exxon, 2008).
3. RESULTS
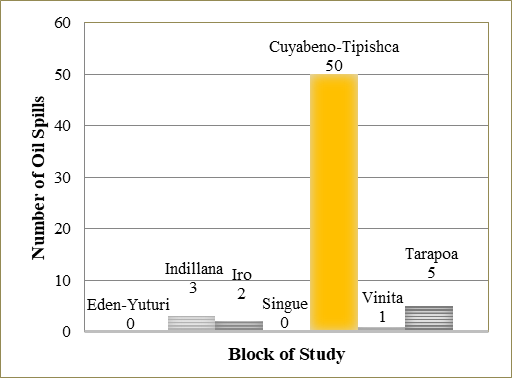
As can be seen in Figure 3, of the 61 oil spills occurred in the study area, 50 of them are registered in Cuyabeno-Tipishca Block, 5 in Tarapoa Block, 3 in Indillana Block, 2 in Iro Block and 1 in Vinita Block. While in Eden-Yuturi and Singue Block no oil spills have been recorded.
3.1 Causes of Oil Spills
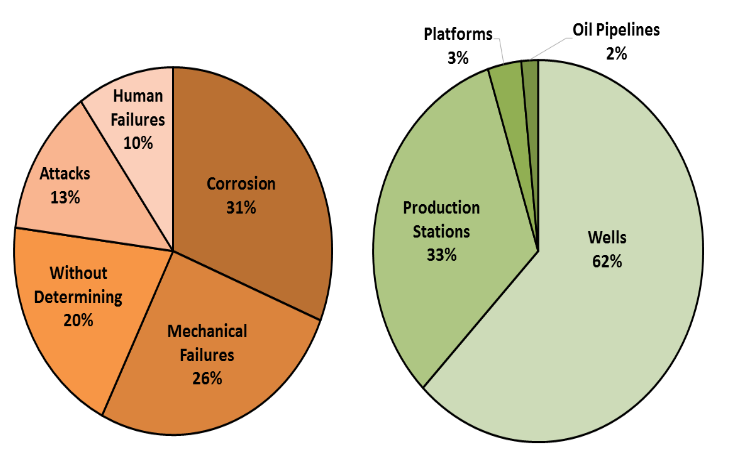
Of the total oil spills registered, 19 were caused by corrosion (31 %), 16 were caused by mechanical failures (26 %), 12 without determining their cause (20 %), 8 of them occurred by attacks (13 %), 6 for human failures (10 %) and there was no event that originated because of natural disasters. With respect to the oil facility associated to each oil spill, it was verified that 20 occurred in production stations (33 %), 1 originated in flow lines (2 %), 38 oil spills are associated to wells (62 %) and 2 of them occurred in platforms (3 %), as shown in Figure 4.
In the generalized linear model it was obtained that the significance values for each categorical factor are greater than 0,05 (ρ> 0,05), so it is deduced that at least for the socio-environmental factors considered there is no significant influence that explains the reason why oil spills occur in the study area. The ρ values are presented in Table 1.
3.2 Determination of Oil Spill Zone Prone (OSZP)
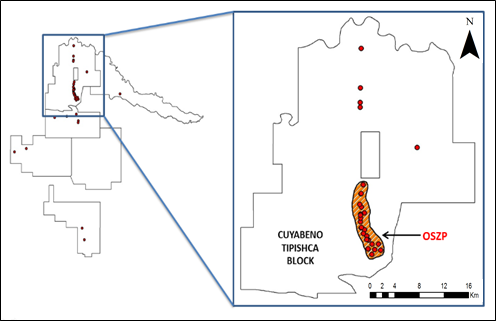
An OSZP was identified in the study blocks, whose approximate area is 52 square kilometers. This area is located in the Cuyabeno-Tipishca Block as shown in Figure 5. In this zone have occurred 43 of the 61 oil spills, that is, 70,5 % of total oil spills are recorded in this zone.
Of these, 43 oil spills were determined that 13 were caused by corrosion, 12 were caused by a mechanical failure, 7 spills have not been established, 7 of them occurred by attacks and 4 by human failures. Considering the petroleum facility to which they are related, 13 spills are associated with production stations and 30 occurred in wells.
3.3 Determination of Vulnerable Areas
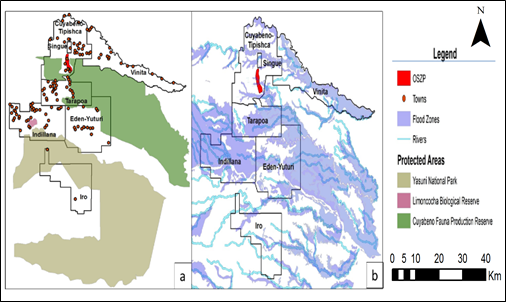
124 villages, around 6000 houses and 3 protected areas of global ecological importance (Cuyabeno Fauna Production Reserve, Yasuni National Park and Limoncocha Biological Reserve) were identified as shown in Figure 6a. In addition, flood zones and the rivers that cross the studied oil blocks proposed in Figure 6b.
3.4 Response Times for Oil Spills
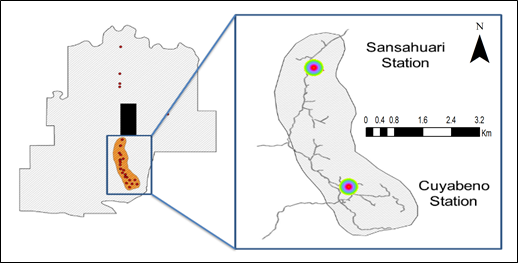
It was determined that Sansahuari and Cuyabeno Station, being within the OSZP and where 65 % of the events associated with production stations occurred, represent the best options for locating the equipment for oil spill response throughout this area. The use of vehicles of heavy transport by land constitutes the means of transport advisable for this zone. The maximum time it would take to get from both stations to the furthest point in this area is 13 minutes at an average speed of 30 km/h (Figure 7).
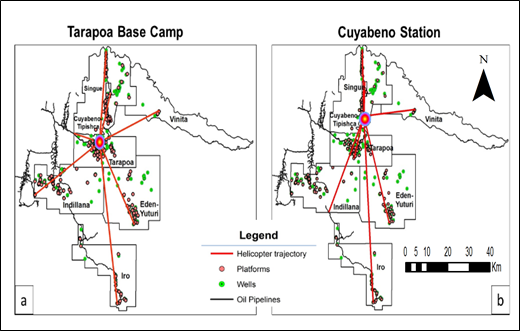
In addition, two alternatives are proposed by air for an effective response to all research blocks and areas without a likely pattern of occurrence, using a helicopter containing spill containment and remediation equipment (Figure 8a and 8b). One option is to locate the helicopter in Tarapoa Base Camp, which would achieve a specific point in an average time of approximately 17 minutes. The other alternative is to locate it in the Cuyabeno Station, taking on average 19 minutes to reach a future spill. This is a reasonable time considering the most distant point of the covered area and depending on the speed of the helicopter, this time could be reduced.
4. DISCUSSION
The area of study is a place of immense biological value because it presents unique ecosystems in the world and a high degree of endemism of species (Acción Ecológica, 2006), but also represents a site of economic interest because of oil reserves found. As a result, this research is of great importance for responsible oil exploitation in Ecuador because areas with the highest probability of occurrence of oil spills and vulnerable zones that are of priority conservation have been identified, thus improving response times.
The Cuyabeno - Tipishca Block registers the greatest number of spills (82 % of the total). This block represents one of the main mature fields of exploration and production of Ecuador, with an approximate production of 25 000 BOPD. However, it is verified that there is no relationship of dependence among the production of a given block with respect to the number of spills. An example is the Eden-Yuturi Block with a production of around 50 000 BOPD but does not record the occurrence of any emergencies caused by oil spills (ARCH, 2013).
4.1 Causes of Oil Spills
According to the BBC (2013), its study was to determine the causes of oil spills in Ecuador, it is estimated that 539 spills have been recorded from 2000 to 2010. The results showed that 27 % of them occured through corrosion, 26 % for attacks, 18 % for mechanical failures, 15 % without data, 12 % for human failures and 2 % for natural disasters. While in this investigation, it was obtained that corrosion and mechanical failures represent the causes with greater percentage. Consequently, the two studies agree that corrosion is the main cause of occurrence of oil spills in Ecuador.
In addition, the generalized linear model indicates that at least for the categorical factors considered (houses, towns, roads, rivers and flood zones) there is no direct risk relationship in the occurrence of oil spills. Oil spills in the study area are mostly caused by operational problems owing to the lack of adequate and constant maintenance of the equipment and installations by the operating companies.
Considering the oil facility in which oil spills have occurred, the largest percentage occured in wells and production stations. Contrary to what was presented in the analysis by Achebe et al. (2012), which determines that oil pipelines represent the facility with the highest number of associated oil spills and despite the fact that main oil pipeline of Ecuador, SOTE, has exceeded its optimal life (BBC, 2013), in the investigated blocks there are only 2 % of them occurring in flow lines.
The high percentage of oil spills for attacks is because of the proximity of the study area with respect to the border with Colombia, the possible presence of insurgent groups, settlements of uncontacted indigenous communities, that the operating companies dissociate themselves from any responsibility and possible sabotage of people to obtain compensation. In addition, most of the area presents lands of low susceptibility to mass movements so there is a low percentage of oil spills caused by natural disasters.
The number of oil spills related to human failures could be significantly reduced through adequate staff training and strong policies against alcohol and drug use during workdays (DeCola & Sierra, 2006).
4.2 Determination of Oil Spill Zone Prone (OSZP)
The OSZP is located in the southern part of the Cuyabeno-Tipishca Block, very close to the Singue Block. It represents only 3 % of the total territory of Block 58. Although its area is minimal compared to the total of the block, this zone has the most oil facilities and human settlements. In this zone has occurred a 70,5 % of the total events, which demonstrates an area with a high probability of occurrence of future oil spills. This identified area is the only one that presents a clear pattern of occurrence to oil spills.
4.3 Determination of Vulnerable Areas
Ecuadorian Amazon is a very fragile habitat and events like oil spills can cause ecological and economic consequences, affecting fauna and flora, tourism and the communities that inhabit it (BBC, 2013). This research found that the study area is highly vulnerable resulting from the large number of houses and villages near the oil facilities, the presence of 3 protected areas of global ecological importance and rivers that could cause emergencies of greater magnitude.
There are three fundamental problems that could lead to catastrophic consequences in the study blocks. The first is the fact that the oil spill zone prone is being limited to the Cuyabeno Reserve and that oil spills have been recorded within protected areas. The Yasuní National Park, with almost one million hectares, is the most biodiverse place on the planet and a symbol of preservation for its ecological and cultural wealth (Larrea, 2011). Likewise, the Cuyabeno Fauna Production Reserve and the Limoncocha Biological Reserve are sensitive and priority conservation areas in case of the occurrence of oil spills, as they are home to one of the largest concentrations of wildlife, both in flora and fauna, many of them in danger of extinction (Acción Ecológica, 2006).
The second problem is that there are 124 villages in the area under investigation, including uncontacted indigenous communities (such as Huaoranis, Tagaeris and Toromenanes), who would be seriously affected by the occurrence of an oil spill. In addition to causing diseases in people, depending on the impact of the spill, communities that depend on fishing and rivers as a source of drinking water would have great implications for their survival (Chang et al., 2014).
Finally, it was observed that the Cuyabeno River crosses the oil spill zone prone and flows directly into the Cuyabeno Reserve. Also, most of the blocks contain permanently flooded areas; this could generate a rapid dispersion of the spilled oil and cause further environmental damage.
4.4 Response Times for Oil Spills
The great vulnerability of the study area altogether with environmental conditions that favor a rapid spread of hydrocarbons, it is necessary a prompt and effective response to reduce the impacts that oil spills could generate. For this, all information of the contingency plans, such as equipment and personnel necessary to deal with these events, should be carefully analyzed. But, despite being a requirement for the award of the environmental license prior to any operation in the oil industry in Ecuador (Constitution of Ecuador, 2008), it is incomprehensible that contingency plans of all the analyzed blocks are not available and they are not properly updated. For an adequate ecological protection, there is a need for localized GIS operations with local data to assist in immediate response.
This is the case of the Cuyabeno-Tipishca Block that is of special interest since in its territory is the OSZP and whose contingency plan establishes only the equipment required for the containment of spills, but their location is not specified. So, it has been recommended to locate them in strategic production stations that allow obtaining appropriate response times for this type of emergencies.
The best proposal to reduce the response time in the OSZP is to place the equipment in the Sansahuari and Cuyabeno Stations and to use vehicles of heavy transport by land. The maximum estimated time is 13 minutes; this improves the response time suggested in the contingency plan of the Cuyabeno-Tipishca Block. While two alternatives were proposed to contain oil spills by means of a helicopter, either to locate it in the Cuyabeno Station or in the Tarapoa Base Camp. In both cases response times are low (20 minutes on average) and it could reach any point where an oil spill could be generated. This approach was made in view of the fact that there are not enough roads to reach all oil facilities by land and it would take too long. The only limitation is that the blocks are operated by different companies, which requires the intervention of the national environmental authority to achieve a mutual agreement among them. In addition, it is more economically feasible to locate a helicopter in the whole area than one per block.
Through these proposals, it is possible to deal with oil spills effectively by reducing response times and involving all companies in order to achieve sustainable oil exploitation in Ecuador.
5. CONCLUSIONS
A total of 61 oil spills have been recorded in the study area. The main causes are corrosion and mechanical failures; most of the oil spills occurred in wells and production stations. It is concluded that the oil spills in this area are caused by operational problems because of the lack of adequate and constant maintenance of the equipment and installations by the operating companies. The best way to fight against the environmental impact of oil spills is through prevention. Therefore, government of Ecuador should invest more resources on continuous monitoring and supervision on oil infrastructure.
The OSZP is located in the southern part of the Cuyabeno-Tipishca Block and represents an area with a high probability of occurrence of oil spills. It occupies 3 % of the total territory of Block 58 with an approximate area of 52 square kilometers.
There are very fragile habitats, highly vulnerable areas and favorable conditions for a rapid spread of hydrocarbons, so an immediate response is required to minimize possible environmental risks that a spill may cause. In the OSZP, it is proposed to locate the containment equipment in the Sansahuari and Cuyabeno Stations and to use heavy transport by land; this reduces to a maximum response time of 13 minutes. For the remaining study area, two alternatives are proposed through the use of a helicopter. Placing it in the Cuyabeno Station or the Tarapoa Base Camp, the response time is 20 minutes on average for the entire investigated area.
This research should be extended to all oil blocks in Ecuador because it allows operating companies to update their contingency plans to respond effectively to the occurrence of oil spills. For the correct use of GIS will be necessary that the companies invest in a constant training of their personnel.
As a complement to this investigation, it is recommended to make a numerical model for the prediction and dispersion of oil spills in the study area.


