INTRODUCTION
“Bitcoin is a groundbreaking digital technology with the potential to radically change the way we conduct banking and commerce and to bring billions of people from the emerging markets into a modern, integrated, digitized, globalized economy” (Vigna and Casey 2015:4)
Recent advances in technology have changed the world and the way how the economic agents interact with each other. A clear example of this phenomenon is the different way to make transactions using new technologies. Nowadays, a considerable part of dealings, purchases, and payments are made through the Internet and concepts such as virtual money, electronic commerce “e-commerce”, and electronic business “e-business” are becoming more familiar. Smithin (2002) point out citizens are turning into a “cashless society”, however it does not imply society is transforming into a “moneyless community”. Actually, money is still the main part in all financial transactions; however, the number of agents using virtual money is increasing. Hileman and Rauchs indicates “the active users of cryptocurrency are predicted to be between 2.9 million and 5.8 million, and at least 1,876 people are working full-time in the cryptocurrency industry” (Hileman and Rauchs 2017:8)
The concept of money has not been always related to the perception of currency; it depends on social customs and needs (Malone 2014). Traditionally, money is described as an element generally accepted as payment for goods, services or debt settlement, whose main functions are to be a medium of exchange, a unit of account and a reserve of value. Money must be guaranteed or certified by the issuing entity. Governments through laws and other entities, such as central banks, regulate and control the monetary policy. Several authors and economic agents define bitcoin as money; however, this description may be inconsistent considering the money’s accurate definition. Then, what is bitcoin?
“Bitcoin is the first decentralized digital currency” (Brito and Castillo 2013:1). It was introduced in the financial market by an unknown person or group of people using the alias Satoshi Nakamoto in 2009. This new virtual currency does not depend on a country regulation because its use is anonymous, and it allows cheap and easy international payments employing a virtual bank account called “digital wallet”, which is located in the cloud or on a client´s computer. Brito and Castillo (2013) conceptualize bitcoin as a peer-to-peer mechanism between users, without an intermediary.
People can buy bitcoins as an investment in the bitcoin exchanges market, they can use any currency in these transactions. In addition, they can send bitcoins to other users through mobile applications or their computers, this process can be considered as “sending digital cash” where the names of buyers and sellers are never revealed, only their wallet IDs are displayed.
Bitcoin is not only a virtual currency but also a discovery of technological infrastructure that involves blockchain computing, which has a similar effect as the Internet in traditional computer networks. Blockchain computing is unique due to copies of the entire system can be maintained simultaneously on millions of computers located anywhere.
The most important characteristics of bitcoin are:
Decentralized: it does not depend on any governmental authority, and it involves mining and transaction verification by networks.
Anonymous: the bitcoin wallet is not associated with any personally identifiable information. Nevertheless, authorities could associate the anonymity of bitcoin transactions with drug trafficking, terrorism, and other illegal and dangerous activities.
Transparent: the blockchain (digitalized, decentralized and public ledger) saves all bitcoin transactions, however tracking a particular bitcoin address to a person is still almost impossible.
Fast: the bitcoin network processes payments instantaneously, it normally takes just a few minutes for users to receive money.
Non-repudiable: clients do not recover bitcoin transactions; it ensures the reception of payment.
The unit of account of the bitcoin system is bitcoin and the ticker symbols used to represent it are BTC and XBT (The popular ticker name ‘BTC’ violates ISO 4217 because it conflicts with Bhutan’s currency which is BTN [Bhutanese Ngultrum]. For that reason, some people use the alternative ticker name “XBT” which is not official). The long-term fundamental value of bitcoin is not statistically different from zero, and its market was estimated to be around - 3.3 billion of United State Dollars (USD) during 2015 (Cheah and Fry 2015). In addition, the bitcoin capitalization (using the current market prices of 2017) is around USD 67.8 billion. Most the researches agree that bitcoin prices incorporate a reasonable speculative component and their markets are directly affected by financial bubbles.
Authors summarize the advantages of bitcoin as (1) high portability, which means that it is easy to transport and employ because users only need Internet access to send and receive money using quick response code (QR-code) or online wallet, (2) voluntary commission fee, users can choose cost and the waiting time to send and receive transactions, (3) no Payment Card Industry (PCI), which implies lower commissions and administrative expenses for clients, (4) security and control through monetary protection using backup copies and encryption, also personal information is always saved, (5) transparent, predictable and neutral transactions, and (6) it cannot be counterfeited because it uses blockchain technology and algorithms.
Conversely, the disadvantages of bitcoin are: (1) legal status, which varies drastically from one country to another, (2) lower level of recognition than traditional currencies, (3) lost key which means that users have a unique alphanumeric password to access to bitcoin wallet, (4) volatility in the bitcoin price that does not allow to predict its value due to its rapid and drastic changes for several cycles of skyrocketing and plummeting referred to bubbles and busts, and (5) its continuous development is not clear because governments and banks are not able to control bitcoins.
The bitcoin price formation could be explained through the traditional determinants of currency price such as the market forces of supply and demand of this cryptocurrency. Nevertheless, its price also depends on multitude factors such as the number and size of business that accept bitcoin as payment, and the tendency of present and future speculation. Furthermore, the specific exchange rates are formed in the process of bitcoin trading on various online exchanges. Whiting this context, new methods as time-series analyses are implemented to explain the bitcoin price per the bitcoin allure for investors and users (Ciaian, Rajcaniova and Kancs 2016).
In summary, the importance of bitcoin is related to the improvement in domestic payments and the rapid development of alternative forms of international transfers. Recently, it seems that bitcoin has assumed the role of investment assets based on its price appreciation, which is not the result of inflation because it is scared and easily interchangeable. On the other hand, according to some sources, bitcoin is considered a good vehicle for money laundering and terrorism financing.
In this context, the general objective of this article is to understand the importance and the influence of bitcoin in the global world and its relationship with other market indexes. The specific objectives aim to: (1) investigate previous academic works developed in this field, (2) analyze the evolution of bitcoin and examine important events that determine its volatility, (3) explore the cryptocurrency market in Ecuador, and (4) test if bitcoin has a linear correlation with other cryptocurrencies, stock exchange indexes and commodities, employing visual and statistical analysis.
The document is composed of three sections. The first part describes the methodology of this study. The second section, corresponding to the results and discussion, is divided into four subsections: (1) the background review that refers to the bitcoin’s theoretical, (2) an empirical analysis of bitcoin, its evolution, its participation in the Ecuadorian economy, (3) a comparison between bitcoin, other cryptocurrencies, stock exchange indexes, and commodities, (4) an explanation of the hypothesis, the linear correlation computation and the obtained results. Finally, the last section of this paper covers conclusions and recommendations for future work.
METHODOLOGY
This article follows a mixed methodology. The term “mixed” refers to a novel methodology of research, popular in social sciences, which allows the systematic integration or “mixing” of both, qualitative and quantitative analysis. This procedure permits a complete study than do a separate analysis. Methodologist John Creswell classifies mixed methodology in six strategies: (1) Sequential Explanatory, (2) Sequential Exploratory, (3) Sequential Transformative, (4) Concurrent Triangulation, (5) Concurrent Nested, and (6) Concurrent Transformative. The characteristics of each strategy define their purpose and their accurate application. In this paper, a Sequential Exploratory methodology will be used. It begins with an initial phase of qualitative analysis followed by a quantitative research, in order to explore a phenomenon and test a new instrument.
In that context, a descriptive analysis of the main investigations in this area is made, which allows verifying the lack of correlation analysis that is proposed in the objectives of this study. Then, with the purpose of understanding bitcoin dynamic, a summary of its evolution and the principal events that have caused its volatility is done. Additionally, to test its relevance, a research of bitcoin’s influence in Ecuadorian markets is performed, and later on a description of the evolution of bitcoin, main stock exchanges indexes, other cryptocurrencies, and commodities. The quantitative analysis has been made to help achieve the proposed objectives. A linear correlation calculation is a tool proposed to verify the hypotheses.
Finally, based on these qualitative and quantitative results, the principal conclusions and recommendations are established.
RESULTS AND DISCUSSION
In this section, a qualitative and quantitative analysis is performed. Following the methodology described, the study begins at a qualitative level. First, a descriptive analysis of the main studies on this subject so far is introduced. Then, an empirical study is done, divided into three parts: (1) the bitcoin´s close price is evaluated to denote its volatility during the analyzed period, (2) the Ecuadorian experience with cryptocurrencies and bitcoin is schematized to corroborate the actual situation of virtual currencies in this country and (3) the evolution of bitcoin and the most important markets (global cryptocurrencies, stock exchange indexes, and commodities) is done to investigate their trend. Finally, the bitcoin phenomenon is explained at a statistical level and a linear correlation calculation is used to verify the proposed hypotheses.
THEORETICAL FRAMEWORK
The theoretical framework in this manuscript reviews the most important bitcoin studies to define the main characteristics of this virtual currency, its advantages and disadvantages, and its volatility using previous studies.
The evaluation of this new monetary and electronic system that arises independently without any government control was analyzed by Durgun and Timur (2015). They discovered cryptocurrencies offer the same monetary services as traditional money and have been able to find users in the market. Dibrova (2016) confirmed this statement, her investigation on bitcoin’s price dynamics evidenced that virtual currency market has a vast potential for development. Antonopoulos (2016) examined in his book how the internet transforms the society allowing people around the world interact easily. The author explained the importance of bitcoin to transform the traditional finance and to bring financial independence to worldwide.
The economic aspect of bitcoin was focused in Kubát (2015) research, demonstrating that bitcoin cannot easily be considered as money after analyzing the theoretical, empirical and legal definition of money in Czech, German and American laws. Later on, Brito, Hoegner, Friedman, Rae and Osborne (2015) also arrived at the same conclusion based on the study of cryptocurrency law in Canada, Germany, the United Kingdom and the United States. Gimigliano (2016), provided an analysis of the European Union’s jurisdiction for bitcoin and e-payments, the user funds protection, the stability of payment system and the competitiveness of EU market.
In addition, the end-users’ motivations and barriers employing bitcoin as a digital currency were studied by Presthus and O'Malley (2017). They conducted a small survey with 135 participants and confirmed that approximately 13% adopt bitcoin due to their technological curiosity and not for monetary incentives or external influences. Furthermore, people in the non-user group are waiting for the results of benefits and security issues to start using bitcoin.
The concerns of the legislative authorities on money laundering and illegal financing activities were studied by Dibrova (2016). The same awareness was shared by Blau (2018). In his work, he explained the use of bitcoin as an exchange medium and the possibility of using it to finance criminal activities due to its speculative nature. In spite of these concerns, little evidence has directly implicated crypto-coins in money laundering, even when cryptocurrencies resemble a conventional form of money as a medium of exchange. Campbell-Verduyn (2018) analyzed the effectiveness of the global anti-money laundering regime and concluded that national currencies and other digital technologies perform equal or greater money laundering challenges, and it is necessary to concentrate efforts to combat this illegal practice independently if it is a conventional or virtual currency.
The volatility of bitcoin is another point of interest for researches. The reasons for bitcoin´s price dynamics were studied by Blau (2018). He concluded that during 2013, speculative trading did not contribute to the unprecedented rise and subsequent collapse in the value of bitcoin and it was not associated with its unusual level of volatility. In addition, Kubát (2015) showed in his investigation that the bitcoin’s volatility is significantly higher than other currencies and assets. Nevertheless, Durgun and Timur (2015) explained that virtual money has a limited impact on markets due to its insufficient infrastructure, legal gaps, prohibitions, weakness and insecurity of Internet networks.
On the other hand, Yermack (2015) affirmed that bitcoin is a speculative investment and it has achieved a minimum volume of consumer transactions due to its short-term risk and its high volatility. The author established the virtual zero correlation between the daily bitcoin exchange rate, the used currencies, and gold. Furthermore, bitcoin does not have a deposit insurance and it could not access the banking system that increases hacking activities.
Authors as Yelowitz and Wilson (2015) agree with Yerman’s study. They used Google Trends dataset to analyze the searches of bitcoin users, and they concluded that search terms as computer programming and illegal activity are certainly correlated with bitcoin interest, while libertarian and investment terms are not associated with this new type of money.
The volatility studies of bitcoin go beyond qualitative analysis. Several quantitative types of research have also been developed. For instance, Dyhrberg (2016) introduced the financial asset capabilities of bitcoin using comparative GARCH models between this virtual currency, gold, and American dollar. Her findings of hedging capacity and medium of exchange, demonstrated similarities between gold and dollar, while bitcoin is preferred by risk-averse investors for adequate risk management in portfolios and financial markets.
The portfolio diversification with bitcoin was studied by Brière, Oosterlinck and Szafarz (2015). The authors used a portfolio that incorporates: (1) traditional assets (stocks, bonds, and hard currencies) and (2) alternative investments (commodities, hedge funds, and real estate). They demonstrated that the admission of a small proportion of bitcoins increased the risk-return rate in both alternatives in the short term. However, the spanning tests did not corroborate the results in the medium and long term.
The interdependencies of prices between bitcoin and altcoin markets in the short and long term were analyzed by Ciaian et al. (2018). The authors used time series analysis and daily data of 17 virtual currencies, including bitcoin, and two altcoin price indexes for the 2013-2016 period, to confirm that the BitCoin-altcoin price relationship was significantly stronger in the short-run than in the long-run. Their results also showed a bitcoin impact in the short-term for some altcoins that are similar to the bitcoin price formation.
The review of previous studies reveals the lack of research works about the linear correlation of bitcoin and other stock market indexes, similar to the one proposed in this manuscript.
BITCOIN’S CLOSE PRICE EVOLUTION
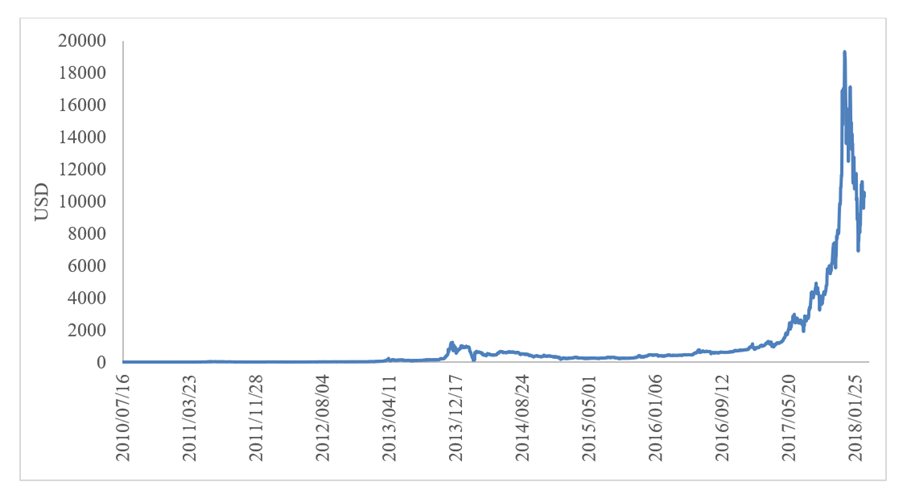
Bitcoin has had a very volatile trading history since its inception in 2009. Initially, it traded for almost nothing (around USD 0.0008). In July 2010, bitcoin had its first real price increase, a single coin for USD 0.08. With two years in the financial market, on February 9th 2011, bitcoin achieved parity with the American dollar, causing interest in investors in some markets. Its value grew rapidly exceeding USD 10 over the next two years. The confidence in this cryptocurrency was increasing as its value, on March 11th 2013, the close price of bitcoin was similar to USD 50 (47.41 to be exact). Although the price dropped sharply and the Mt. Gox, one of the world’s bitcoin exchanges, temporarily suspended bitcoin deposits, the confidence and validity of some transactions in the bitcoin market were not affected (Chain Fork Information 2013).
On April 2013, its value exceeded USD 100 when The European Commission, the European Central Bank and the International Monetary Fund announced the rescue of the Cypriot Economy under certain conditions, such as a considerable tax on bank accounts with holdings exceeding 100,000 euros (EUR), a policy that affect wealthy people from Cyprus and abroad, due to the reputation of this country as tax haven. As a solution to preserve their holdings, many of these account holders bought bitcoin in masse (Bitcoin Price History 2018).
A significant peak was reached on November 29th 2013. The bitcoin’s close price was USD 1,101.38 due to the fast-growing bitcoin investment in China. Mt. Gox was still operating and was involved in approximately 70% of all transactions. The bitcoin price began to be more volatile when the first restrictions appeared. For instance, according to Cable News Network -CNN- (2013), The People’s Bank of China declared that bitcoin is not a currency and prohibited to any institution to trade, insure or offer services related to this cryptocurrency. People had problems withdrawing their money from the exchange and the bitcoin prices fell below USD 1,000. Later on, the massive DDoS attacks (distributed denial-of-service is an attack in which multiple compromised computer systems attack a target, such as a server, website or another network resource, and cause a denial of service for users of the targeted resource.) declined the bitcoin price in February 2014, from around USD 940 (February 1st) to USD 111 (February 21st) (MtGox 2013).
During the rest of 2014 and 2015, the bitcoin value remained with decreasing trends. Bitcoin’s close price ranged from USD 600 to around USD 300, despite the facts such as: (1) the Internal Revenue Service (IRS) of the Unites States (US) tried to classify bitcoin as a property subject to capital gains taxes, (2) more restrictions were established from The People’s Bank of China, (3) the US government increased regulations for companies that interact with bitcoin, and (4) the bitcoin was accepted as a medium of payment in some big companies as Dell, Microsoft and Braintree (Bitcoin Price History 2018).
In 2016, bitcoin showed a slow but steady upward trend, its price exceeded USD 500 during the first semester. The bitcoin community grew, and some influential members gathered in Hong Kong to discuss a plan for scaling bitcoin. However, there was some discouraging news such as the theft of customer funds for security breaches. On November 9th 2016, Donald Trump was elected as the 45th President of the United States and the reaction in the markets was immediate. Most of the markets opened sharply lower and investors rushed into known havens such as gold. Bitcoin increased its price by 5% in just 24 hours with a close price of USD 721.42 (Bitcoin Price History 2018).
The popularity of bitcoin increased quickly due to the massive media coverage, attracting new users interested in this novel cryptocurrency who bought bitcoin and pushed its value to the top. On January 3rd 2017, the bitcoin price broke USD 1,000 for the first time in three years. The price of USD 2,720.53 was reached on August 1st 2017, after Japan recognized bitcoin as a legal medium of payment and the bitcoin code was divided into two parts to create a competing cryptocurrency called bitcoin cash. The holdings of bitcoin owners’ have doubled thanks to this action. If someone had 10 bitcoins before August 1st, since this date the owner had additionally 10 bitcoin cash (CoinDesk 2017).
The price has grown rapidly since then, although there is an increasing risk and authorities tried to control this market. For instance, Chinese authorities ordered Beijing-based cryptocurrency exchanges to cease trading and stop registering new users (Bitcoin Price History, 2018). However, the price exceeded USD 5,000 for the first time on October 11th 2017, USD 10,000 on November 28th 2017, and USD 20,000 on December 18th 2017; that is, it tripled its price in just two months, reaching records never seen before and exceeding all predictions.
The price was affected after South Korea, the third-largest cryptocurrency market in the world, announced policies to regulate the bitcoin trade, such as the closing of stock exchanges (Bitcoin Price History 2018). Nevertheless, bitcoin continues to transcend expectations and maintains a high, but fluctuating value. On February 28th 2018, it closed at USD 10,334.44. The evolution of the bitcoin´s close price is displayed as follows (figure 1).
DIGITAL CURRENCIES AND BITCOIN EVOLUTION IN ECUADOR
Ecuador introduced bitcoin and other digital currencies in July 2014 as a part of the reform of the country’s monetary and financial laws. However, the then-President Rafael Correa ordered to stop the bitcoin operations and confiscate the circulation of bitcoins and assets in this virtual currency.
The Central Bank of Ecuador (BCE) does not recognize bitcoin as a medium of payment, which is stipulated in the Monetary and Financial Organic Code, article No. 94 (Asamblea Nacional del Ecuador 2014). Nonetheless, in 2014, the BCE presented its own digital currency, called Dinero Electrónico, and it is pegged one-to-one to the US dollar (the official currency of Ecuador). This electronic currency is issued by the BCE and it is not equal to cryptocurrency or bitcoins due to it has backing in paper, metal and liquid assets. Furthermore, the Ecuadorian government promotes electronic money because the useful life of dollars in Ecuador is 2.5 years, while in the United States it is 7.8 years. The BCE (2018) reported that citizens, who have digital money in their virtual accounts, have three options to manage it. First, this money can be downloaded and effective. Second, users can buy with it in places that accept this virtual money as a medium of payment. And third, it can be transferred to any financial institution as saving.
On April 16th 2018, all the electronic money accounts in the BCE are going to be deactivated due to the approval of the Law of Economic Reactivation, which transfers the administration of electronic money to private banks. Actually, the challenges of the Ecuadorian public financial sector are still large and defined as a support to reduce the use of physical money and offer new services involving electronic mediums of payments such as cards, transfers, and other financial products (BCE 2018).
The money supply (M1) in the Ecuadorian financial system consists of (1) monetary species in circulation (currency in circulation), (2) fractional currency, (3) electronic money, and (4) demand deposits. The evolution of M1 showed a significant increase of USD 18,695.32 million to USD 22,634.80 million from 2014 to 2016, respectively. The most representative account is the currency in circulation, which on average represents 57.1% of M1 during the same studied period. On the other hand, the demand deposits account varied from USD 9,068.76 million (2014) to USD 9.281,36 million (2016), and the Ecuadorian digital currency changed from USD 0.1 million (2014) to USD 4.1 million (2016). The development of the M1 components is shown as follows in the figure 2.
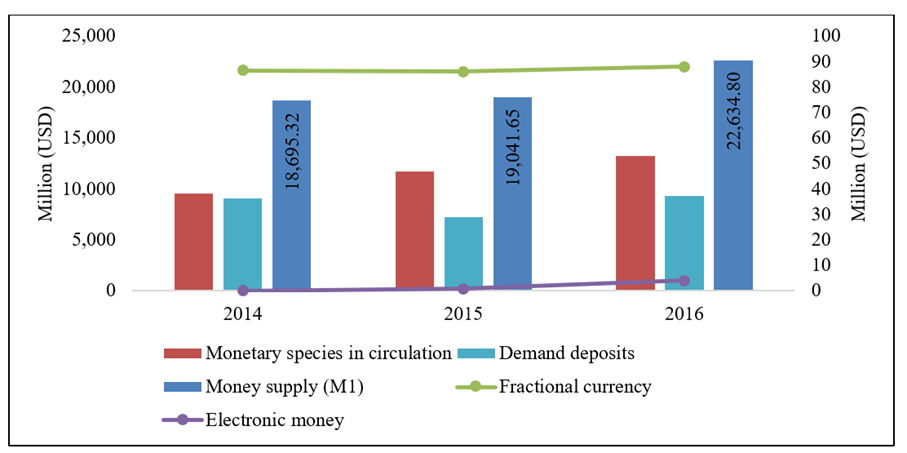
Source: Central Bank of Ecuador/Monthly Statistical Information/Monetary and Financial Statistics. Note: Primary axis (series): monetary species in circulation, demand deposits, and money supply (M1). Secondary axis (series): fractional currency and electronic money
Figure 2: Evolution of the components of the Ecuadorian money supply
BITCOIN AND STOCK EXCHANGE
The first step to determine the relationship between bitcoin and stock exchange is the visual and descriptive analysis of their close price. The study is based on the characterization of bitcoin and main stock exchange indexes, in American dollars (USD), euros (EUR) and pound sterling (GBP), other important cryptocurrencies and principal commodities. The information needed to perform this first descriptive analysis is available on (1) Yahoo Finance, section market, subsection Cryptocurrencies and World Indexes, (2) Investing section commodities and (3) Investopedia section Cryptocurrencies.
Evolution of bitcoin and the most important world cryptocurrencies
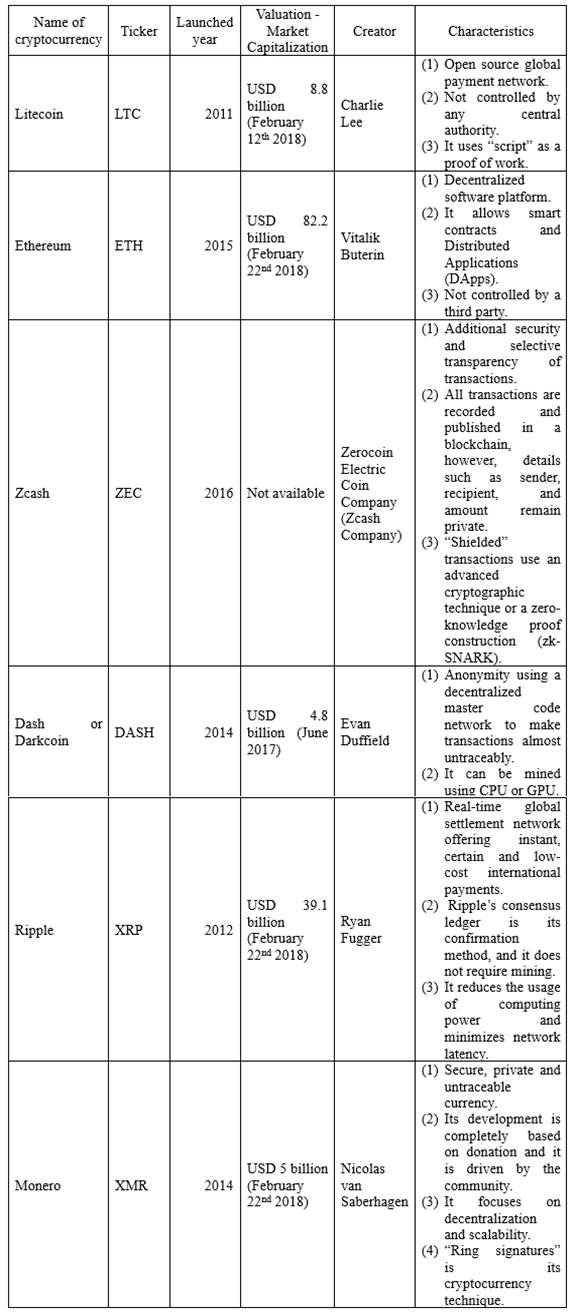
Investopedia (2017), the main global source of financial content on the web that focuses on investing education, retirement strategies, and financial news, defines the six most important cryptocurrencies other than bitcoin, which are the following (in a non-specific order) (table 1).
Table 1: The most important world cryptocurrencies (not including bitcoin)
Source: Investopedia/Important world cryptocurrencies
The trend analysis includes the series of the main global cryptocurrencies shown in table 1, with the exception of the virtual currency called Zcash (ZEC) because its dataset was formed for 490 observations, and it is only available from October 27th 2016 to the present. This manuscript considers 937 observations (close price) from August 6th 2015 to February 28th 2018. The start date is chosen because all the considered cryptocurrencies have historical data from this date to the present and it coincides with the first day of operations of Ethereum. The database source is Yahoo Finance, one of the main web networks, which provides stock quotes, up-to-date news, portfolio management resources and international market data.
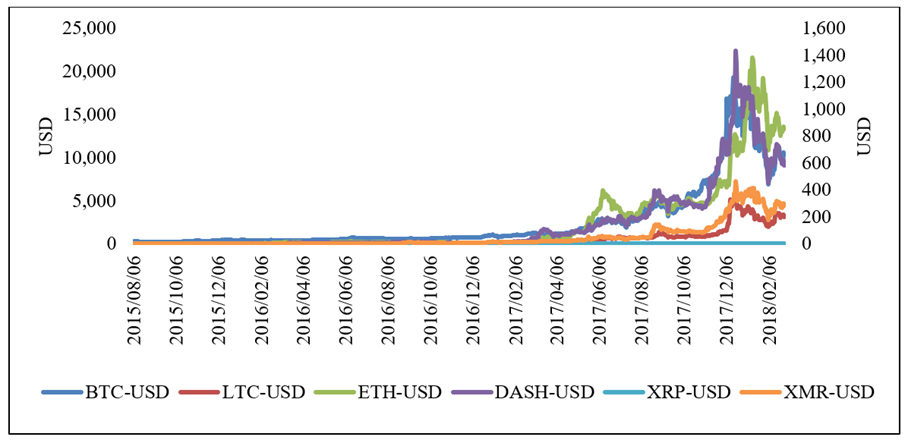
Graphically, all series follow the same path as the bitcoin close price. For instance, the Litecoin’s average close price was USD 33.97 during the considered period, its minimum value (USD 2.59) was reached on September 2nd 2015, while its maximum value (USD 357.51) was achieved on December 18th 2017. On the other hand, Ethereum cryptocurrency showed its minimal price (USD 0.42) on October 20th 2015, its maximum price (USD 1,385.02) on January 13th 2018, and its average close price is USD 152.37.
Dash or darkcoin experimented an average close price of USD 147.57. The close price range of this cryptocurrency is USD 1.00 (minimum price on September 08th 2015) to USD 1,433.41 (maximum price on December 20th 2017). The virtual currency denominated Ripple, whose average close price is USD 0.17, evidenced its lower price on November 08th 2015 (USD 0.00) and its highest value was achieved on January 7th 2018 (USD 2.78). Finally, the Monero cryptocurrency showed its best close price performance on December 20th 2017 (USD 467.50), while its worst close price (USD 0.36) was on November 22nd 2015. Figure 3 displays the evolution of bitcoin and the most important world cryptocurrencies.
Evolution of bitcoin and the most important stock exchange indexes
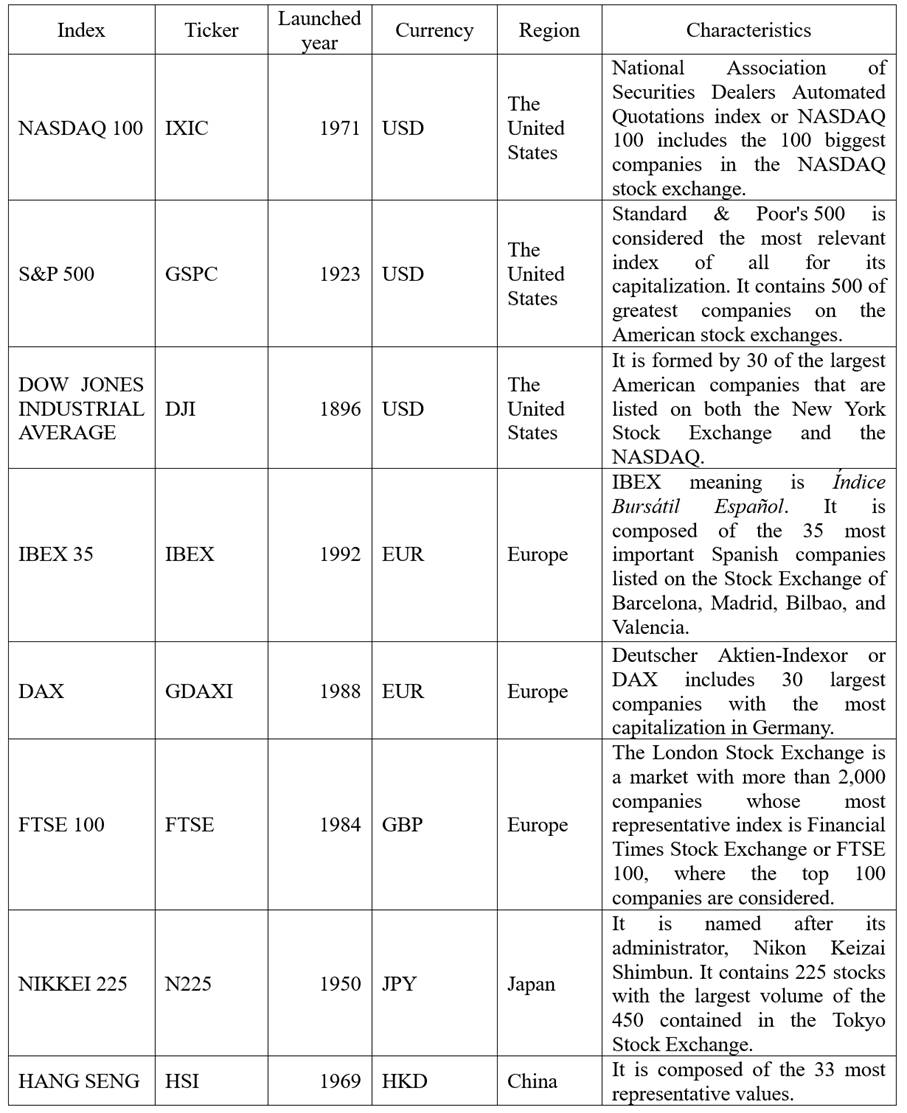
The stock market could be divided into four main economic regions, which are: Europe, the United States, China, and Japan. It is important to differentiate between index and market since they are not the same. The stock exchange is the place where investors can commerce, buy and sell titles or securities of listed companies. The index is a thermometer of the stock market of each country or region, considering that it is elaborated with the companies with greater capitalization and volume in their markets. There are many indexes elaborated for analyzing a specific stock exchange of a determined region. According to Yahoo Finance, the most important and recognized worldwide indexes are summarized in table 2.
The trend analysis is divided into two parts. The first part includes the series of the US market and the second one contains the analysis of the European stock exchange. The Japanese and Chinese market are excluded because of the availability of information. Graphically, it is possible to better appreciate the trend of the series if the plot is less loaded, besides the analyzed indexes are quoted in different currencies (USD, EUR, and GBP). This research considers observations (close price) from January 1st 2013 to February 28th 2018. The period is chosen because the analysis of the last five years allows a long-term perspective of the behavior of these indexes.
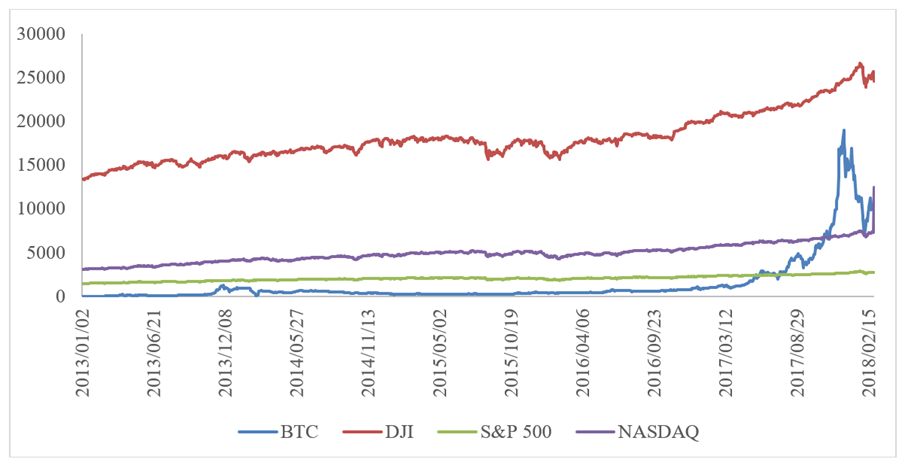
The Dow Jones industrial average, along with the NASDAQ and the S&P 500, serves as a description for the general market and the performance of the US economy and helps investors to get a financial idea of the current environment and prospects. Figure 4 shows the volatility of bitcoin compared to these indexes; all of them are in an ascending and continuous trend.
The Dow Jones industry average is the index with the highest market capitalization, around USD 18,041.08 in the last 5 years. Its maximum value was USD 26,616.71 on January 26th 2018. On the other hand, the NASDAQ index had lower capitalization than DJI, (USD 4,893.99 on average) it presented more stable values throughout the analyzed period, reaching its maximum on January 26th 2018 with USD 7,505.77.
The same day, the S&P index reached its highest capitalization in the last 5 years (USD 2,872.87). This index had the lowest average value of capitalization USD 2,057.64. All the indexes in the US market seem to be related and follow the same trend.
Source: Yahoo Finance/Markets/World Indexes
Figure 4: Evolution of bitcoin and the main US stock exchange indexes
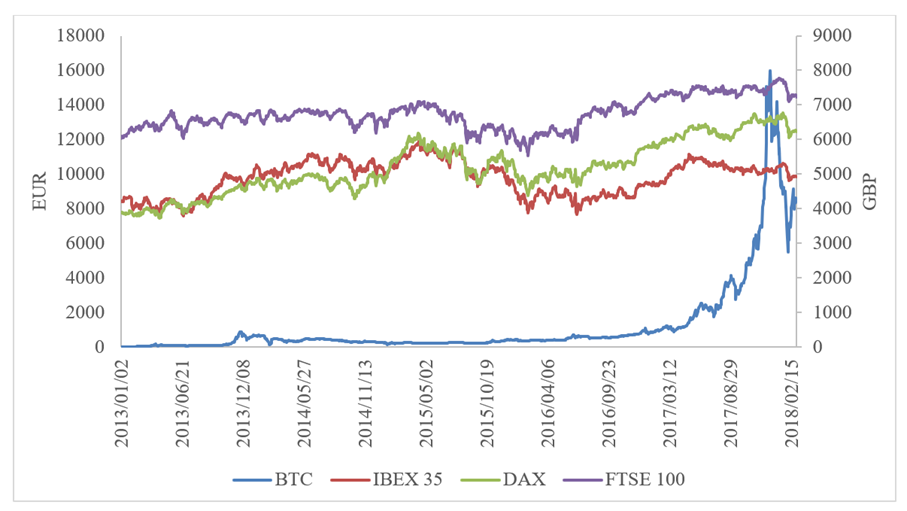
In the European case, IBEX 35, DAX and FTSE 100, help investors to understand the performance of this economy. The prices of IBEX 35, DAX and bitcoin are given in euros, while FTSE 100 is given in GBP (figure 5).
The European stock exchange indexes seem to be more stable during the considered period. DAX is the index with the highest market capitalization, in average EUR 10,365.48 in the last 5 years. Its maximum value was EUR 10,609.50 on January 23rd 2018. On the other hand, IBEX 35 had a lower capitalization than DAX, in average EUR 9,768.23.
Its maximum value was reached on April 13th 2015 with EUR 11,866.40. FTSE 100 index showed its highest capitalization in the last 5 years (GBP 13,559.59) on January 12th 2018. This index had an average capitalization value of GBP 6,741.74. Generally, the three indexes show a stable trend in the European economy.
Evolution of bitcoin and the most important commodities
A commodity is defined as a basic good in commerce that can be interchangeable with other commodities of the same type (Investopedia 2018). Fungibility is its most important characteristic of commodities. It can be treated in the spot and derivative markets, and its price is usually determined as a function of its market as a whole. Commodities can be classified as raw materials, basic resources and agricultural products.
Investopedia (2018), a global financial portal which offers stock quotes and international market data, defined the influence of the commodity prices as an important factor that impacts on earnings of public companies, and, by extension, the markets. In addition, this financial company mentions that the ten most important commodities that move the markets are (in a non-specific order): wood, crude oil, cotton, wheat, corn, coffee, gold, silver, platinum, and natural gas.
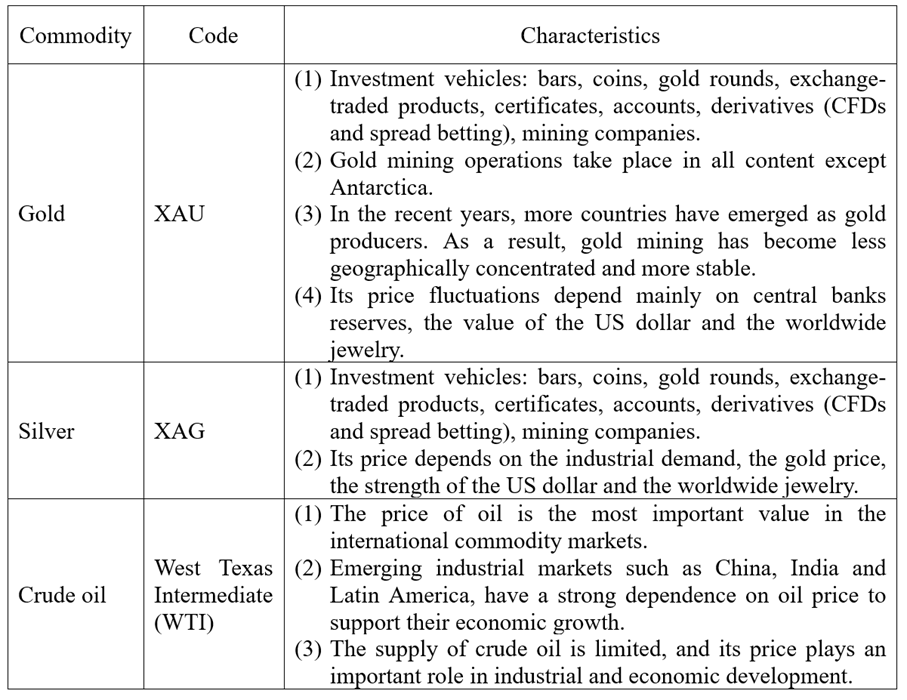
This manuscript analyzes only three commodities (gold, silver and crude oil) due to the availability of information (table 3).
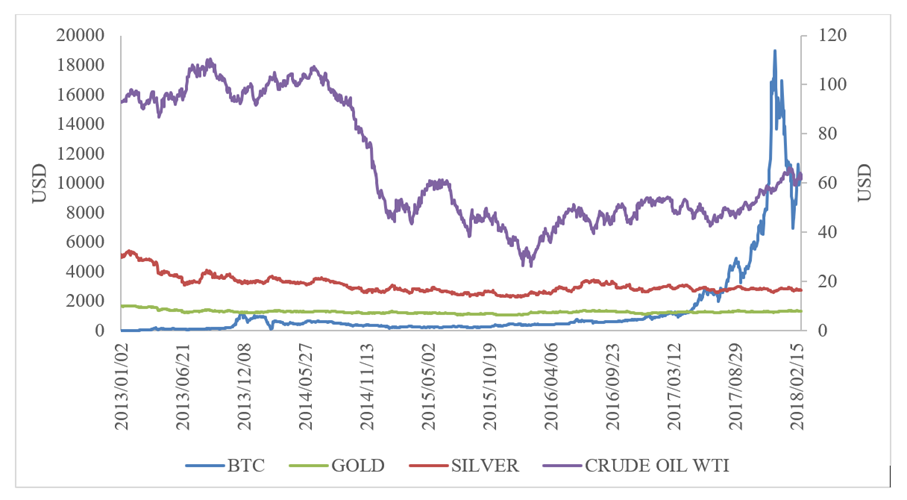
Similarly, the trend analysis is done during the period considered above to easily determinate the relationship between commodities and bitcoin in the long-term.
The price (future) of gold and silver is stable during the analyzed period (figure 6). On average, gold had a price of USD 1,270.69, its maximum value (USD 1,692.80) was reached on January 23rd 2013 and the minimum value (USD 1,050.80) on December 17th 2015. Silver experimented an average close price of USD 18.48.
The range of its price was USD 13.66 (lowest value on December 14th 2015) to USD 32.41 on January 23rd 2013. The commodity called Crude Oil WTI had an average price of USD 66.70 showing its lowest value (USD 26.21) on November 2nd 2016 and its highest price (USD 110.53) on June 9th 2013. Commodities prices have shown a stable trend during the studied period, while bitcoin price is characterized by its volatility.
CORRELATION ANALYSIS
Finally, three hypotheses are proposed:
Hypothesis 1: Positive correlation between bitcoin and the main world cryptocurrencies.
Hypothesis 2: Positive correlation between bitcoin and the most important stock exchange indexes.
Hypothesis 3: Positive correlation between bitcoin and the main commodities.
A linear correlation analysis is performed between bitcoin, main stock exchange indexes, other important cryptocurrencies and principal commodities. This computation is a crucial part to test the hypotheses and was made using the software RStudio version 1.1.423. The database sources are (1) Yahoo Finance, section market, subsection Cryptocurrencies and World Indexes, (2) Investing section commodities.
Hypothesis 1: Positive correlation between bitcoin and the main world cryptocurrencies
The data is obtained from Yahoo Finance, section Cryptocurrencies. The number of observations are 937 from August 6th 2015 to February 28th 2018.
The linear correlation between bitcoin and the five most important cryptocurrencies is positive and significant at least at 0.05 level (table 4). The highest correlation coefficients are presented between bitcoin and Dash (0,978), and bitcoin and Monero (0,969). On the other hand, the lowest correlation coefficient is evidenced between bitcoin and Ripple (0,821). It is important to mention that the strongest correlation (0,984) is shown between Dash and Monero.
Using the graphical and correlation analysis, hypothesis 1 is accepted. It can be concluded that bitcoin has a large influence on cryptocurrencies market.
Table 4: Linear correlation between bitcoin and the main world cryptocurrencies

Notes: Significance level: * p<0.1, ** p< 0.05, *** p<0.01.
Hypothesis 2: Positive correlation between bitcoin and the main stock exchange indexes
In this section, the linear correlation between bitcoin and the six most important stock exchanges is calculated to test if bitcoin has any influence on the European or the US market using the data provided by Yahoo Finance in its section World Indexes. This research considers 1,274 observations (close price in USD) from January 1st, 2013 to February 28th 2018.
All the correlations are positive and significant at least at 0.05 level (table 5). The highest correlation coefficient is between bitcoin and DJI (0.787). Otherwise, the lowest correlation coefficient is evidenced between bitcoin and IBEX 35 (0.182). However, this index (IBEX 35) presents low correlation values with all other considered values.
It can be concluded that bitcoin is related to the main indexes in the American and European markets, although its volatility does not seem to influence these markets. It is necessary to mention that all the considered indexes, except bitcoin, maintain a high degree of positive correlation between them; specially the US market indexes that have correlation coefficients greater than 0.95 showing the strong relationship that stock exchanges have between them.
The hypothesis 2 is accepted using the graphical and quantitative analysis and conclude that bitcoin has a correlation with the stock exchange indexes in the long term, but it is not stronger than the relationship between the main cryptocurrencies and bitcoin.
Table 5: Linear correlation between bitcoin and the main stock exchange indexes

Notes: Significance level: * p<0.1, ** p< 0.05, *** p<0.01.
Hypothesis 3: Positive correlation between bitcoin and the main commodities
The analysis is performed with 1,299 observations (close price in USD) from January 1st 2013 to February 28th 2018. The data source is Investing, section Commodities.
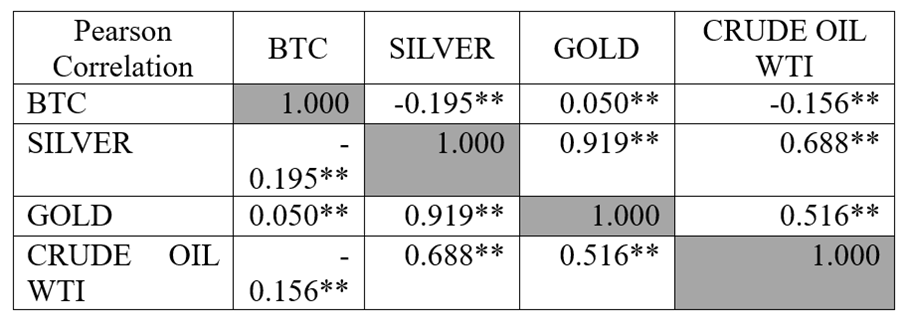
Hypothesis 3 is rejected since the linear correlation coefficients are lower between bitcoin and the considered commodities (table 6). The obtained results show a minor linear correlation between bitcoin and commodities. The correlations between bitcoin, silver and crude oil WTI are negative. However, the degree of correlation between the variables is less than 0.2.
On the other hand, the analyzed commodities have a strong correlation between them, especially silver and gold, with values higher than 0.9.
CONCLUSIONS
This study conducted a global analysis of the bitcoin situation since its appearance in the financial market. The graphical analysis and empirical evidence showed that the volatility of bitcoin prices and its speculative power are the main characteristics of this virtual currency. In addition, a correlation analysis was performed to test the three proposed hypotheses.
The study indicates that hypothesis 1: positive correlation between bitcoin and the main world cryptocurrencies, can be supported. It has been proved that there is a strong correlation between bitcoin and other cryptocurrencies in the long-term. The graphical evidence also shows that cryptocurrencies, including bitcoin, have similar trends during the considered period. Bitcoin is the most stable digital currency and it is often the mechanism that investors access to the cryptocurrency market.
Hypothesis 2: positive correlation between bitcoin and the most important stock exchange indexes, is accepted. The dynamic price of bitcoin has a relationship with the fluctuations in the stock exchange indexes; however, it is not as strong as the relationship between the main cryptocurrencies and bitcoin. The graphical analysis displays different patterns between bitcoin and stock exchange indexes. Besides, stock exchanges indexes show a strong relationship between them maintaining a high degree of positive correlation.
Hypothesis 3: positive correlation between bitcoin and the main commodities, cannot be supported. The results show a low linear correlation between bitcoin and the three analyzed commodities. Actually, commodities have a stable price index during the considered period, while bitcoin is highly volatile.
RECOMMENDATIONS
This paper provides several directions for future work. First, an interesting approach is to focus on analyzing the short and long-term relationship between bitcoin and cryptocurrencies and stock exchange indexes used in this study. Second, this manuscript could be replicated by improving the statistical techniques and employing other cryptocurrencies and stock exchange indexes to demonstrate the validity of the achieved results. Third, different time series techniques can be applied to predict the behavior of cryptocurrencies.


