


 Español (pdf)
 Articulo en XML
 Referencias del artículo
 Enviar articulo por email
 Citado por SciELO
  Similares en
SciELO
Similares en
SciELO 
 Permalink
INTRODUCCIÓN
The generation of electric energy in several Latin American countries has been linked to the use of fossil fuels in their energy matrix, causing a problem of environmental pollution, which has led to the search for other less invasive, more efficient, and environmentally friendly energy sources. The development of the electricity sector takes shape when focusing on improving the energy matrix with renewable energy such as hydroelectric power plants. By adopting an improved energy matrix, Ecuador not only benefits the electric distribution field but also avoids contamination and danger to the country's fauna and flora. Pinargote et al. [1] 39 MW, of which 5243.37 MW correspond to renewable energy sources, representing 64.9 %. Of the renewable sources, 5082.35 MW corresponds to the participation of the hydraulic source, representing 96.9 %. Only 3.1 % correspond to wind, solar, and biomass energy together [2].
Rojas et al. [3] detail that in the last seven years hydroelectric power plants within the energy matrix will represent 93% of the effective generation power, however, the development and maintenance of such infrastructure must be considered. Fonseca et al. [4] propose a proportional distribution to the average water flow contributed by each municipality within the catchment area of the hydroelectric power plant and the size of the area flooded by its reservoir through an analysis of the balance between precipitation and evapotranspiration for all municipalities in Brazil, yielding only a 3 % difference concerning the observed water flow. As a result of the proposed methodology, the number of municipalities benefited increased from 41 to 167 drainage areas, providing financial resources to the municipalities and allowing them to invest in conservation techniques to ensure the maintenance of water resources [5].
Liu et al. [6] describe an analysis focused on the concentration of sediment and silt in the turbined water, the Kaplan, Pelton, and Francis turbines which are the most used in hydroelectric plants are the focus of the study considering as parameters of analysis of the silt density, sediment size, velocity and direction. Using three concentrations of sand 25, 50, and 85 kg/m3 with different sizes 0.531, 0.253, and 0.063 mm, where the increase of quantity and size causes damage by cavitation for which they propose to cover the surfaces that suffer when losing their efficiency and in a direct way the reduction of the generation time. Chavarro [7] details a Kaplan turbine a CFD modeling under various functional parameters that determine its wear, these parameters are pure water, cavitation erosion, erosion by silt, and combined erosion, like the Francis and Pelton turbine the operation of the Kaplan turbine under sediment erosion, generates efficiency drop of 2.47% with the increase in the diameter of the sediment to 100 μm and the concentration of sediment 10000 ppm [8], [9].
Sangal et al. [10] state that due to the sedimentation of the turbine water, the turbine components wear, especially the guide vanes, when performing a fluid dynamic analysis and simulation of the guide vane of the Francis model turbines with different thicknesses of 17 and 21 mm, through a geometric study of both vanes it was found that, by increasing the blade thickness, the line of attack (chord) of the current blade (21 millimeters thick), has a small linear deviation of 0.13 millimeters concerning the original blade (17 millimeters thick), causing an increase in the flow angle [11].
Rai et al. [12] studied the erosion caused by sedimentation on different materials under the same erosive and hydraulic conditions where they conducted experiments simultaneously with varying ranges of velocity, exposure duration, sediment size, and concentration on 1:8 scale reduced Pelton cubes of a hydroelectric plant in India, for application on Pelton turbines made of 6 materials such as 3 types of steel, 2 types of coatings and bronze for heights up to 200 m the scale. Sun et al. [13] mention the study of sediment abrasion, cavitation erosion, and synergistic erosion in a rotating disk test rig. They also compared the anti-abrasion properties of HVOF high-speed oxy-fuel sprayed stainless steel and HVOF sprayed martensitic WC-CO-Cr stainless steel. They found that the latter is more suitable for the sediment-laden flow environment.
Cruzatty et al. [14] analyzed by CFD the runner blades of a Francis turbine where they presented a higher erosion rate on the suction side near the trailing edge. The presence of higher sediment erosion is the trailing edge of the suction side, the result of the numerical analysis reflects that the erosion damage increases significantly for higher flow rates when the guide vane opening exceeds 85 % opening considering the closed position as a reference. Noon and Kim [15] describe a CFD analysis where the leakage flow generates a step vortex, which moves away from the wall as it moves downstream, decreasing the intensity, and demonstrating the minimization of the coalescing impact of secondary flow and sediment erosion. Several studies show that the efficiency of the Francis turbine varies between 3 and 6 % depending on changes in sediment concentration and secondary flow phenomena. However, a loss of between 2 and 3.5 mm of channel thickness is observed.
For the analysis of the loss of thickness in the turbine blades, a series of inspections must be carried out, which must be contemplated in the elaboration of the maintenance plan for Francis turbines, since the frequency of maintenance is of utmost importance to establish inspection and repair costs, avoiding energy production losses as much as possible. Toapanta [16] states that using non-destructive NDT inspection such as visual inspection VT, penetrating liquids PT, magnetic particles MT, conventional ultrasound, and phased array UTPA, it is possible to identify and interpret the relevant indications to be evaluated if they comply with the acceptance criteria of standards or technical specifications. If damage is left unrepaired or improperly repaired, it will spread very quickly, decreasing the performance, efficiency, and lifetime of the unit. When pitting damage approaches 20 % of the blade thickness or ½” deep, whichever is less, then corrective action should be taken immediately [17], [18].
A Hydroelectric Power Plant is under the study of a wear correlation model - the amount of sediment and generation power for the scheduling of its preventive maintenance. The organization of this manuscript is as follows. The introduction describes the importance of hydroelectric power plants for the generation of electric power as well as details the main factors that cause wear and damage to water systems, which should be considered to establish maintenance schedules. In materials and methods, the inspection techniques, data obtained, analysis ranges, and software used for statistical analysis are presented. The results section details the prediction and optimization considered to improve the availability of the hydroelectric plant promptly in the maintenance of the Francis turbine blades.
MATERIALS AND METHODS
The technical characteristics of the equipment used are presented below. Additionally, the standards used for experimental development are indicated, as well as the range of applications and the procedure to be followed in each of them is described. Fig. 1 shows the procedure to be followed to carry out the present investigation.

Francis’s turbine
The Francis turbine is normally used in medium and high drop hydroelectric power plants, the turbine consists of a set of rotating blades mounted on a shaft that is connected to an electric generator. A correlation model is proposed between the wear of the equipment and the sediments found in the water, so it is necessary to study and identify the sediments present in the water, to evaluate the wear of the runner, the main element of the Francis turbine [19], [20].
The section in red in Fig. 2 is where there is wear of the Francis runner, which causes higher water consumption, increased vibrations, temperature, and others.


Control limit
The control limits given by the manufacturer Mitsubishi establishes a minimum and maximum tolerance in the thicknesses of the runner blades, table 1 to maintain the maximum efficiency in the electrical generation the blade thicknesses to be maintained within the maximum and minimum tolerance being the optimum dimension the “nominal” in the inspection points from “a” to “l”.
Fig. 3 shows the positions of the inspection points a, b, c, d, e, f, g, h, i, j, k, l, which are inspected and measured on all blades 1 to 17 considerations made by the manufacturer MITSUBISHI.

MINITAB STATISTICAL Software
To obtain the data correlation, the values obtained by measuring thicknesses are used as part of the statistical analysis, the wear variable is plotted with its control limits to evaluate the blades with their respective positions that comply with the recommended tolerances as shown in Fig. 4, when representing the distribution of the data of a variable in a box plot, the position of the median, quartiles and extreme values are shown. If the data have extreme values, these will appear as points outside the boundaries of the box plot; therefore, it is used to visualize the distribution of the values of the predictor variables of the model and to detect if there are outliers or extreme values that may affect the accuracy of the model [21], [22].

Once the wear data, there are no outliers that affect the multiple regression analysis, the statistical regression model starts to obtain the equations that project the wear in the following periods for the scheduling of preventive maintenance under condition. To obtain the equation we proceed as follows [23], [24]:
Analysis of the inspection point “a” in the blades from 1 to 17 that make up the impeller.
The multiple regression equation applied is: Y= b0 + b1X1 + b2X2 + b3X3 + b4X4 + b5X5 + b6X6.
Where,
Y = dependent variable, impeller blade thickness wear at inspection points 1 to 17 at inspection points “a” through “l”, estimated by the regression equation.
b1, b2, b3, b4, b5 and b6= net regression coefficients (the best weighted set among the independent variables, in order to achieve maximum prediction) X1, X2, X3, X4, X5 and X6 = independent variables such as: Cumulative PPM, Cumulative MWh Power, PPM, MWh Power, Maximum MW Power and Minimum MW Power.
b0= Constant or Y-intercept.
The construction sequence of the equation for the inspection point at “a” of blade 1 is 1 = 23.930 - 0.1965 X1, where X1 corresponds to the independent variable cumulative PPM, and the rest of the positions of “a” are presented in Fig. 5. The equation construction report includes several sections, which provide information on different aspects of the model construction process [25]. Selection of predictor variables: This section describes how the predictor variables for the model were selected and what criteria were used to select them. It includes information on the relative importance of each variable and how it will be protracted.
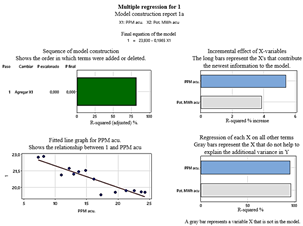
Figure 5: The statistical plot of the multiple regression of the equation construction on vane 1 at point “a”
Exploratory data analysis: This section describes how the data was explored before building the model, including graphs and descriptive statistics for each variable. 1Initial model: This section describes the initial model that was built and how the quality of fit was assessed. It may include information on hypothesis testing for regression coefficients and residual variance.
In the execution of the MINITAB software with the multiple regression, the results of the linear or nonlinear equations are presented with their respective correlation Table 2 in the position of “a” in the vanes from 1 to 17 with the variables considered, type of equation [26].

For the validation of the quality of the correlation model obtained at inspection point “a” to “l” on blades 1 to 17, the following aspects are considered:
Residuals vs. fitted values.
Summary report on the obtained equation.
Special effects were found in the interaction.
Fig. 6 details the normal likelihood in the residuals vs. the fitted values are the search for patterns, such as strong curvature or clusters to indicate problems with the regression model, differences between the observed values of the response variable and the values predicted by the model. It includes plots of the residuals and statistical tests to assess normality, homogeneity and independence of the residuals.

If the model is properly fit to the data in a statistically significant relationship between Y and X variables can be explained by R-squared in % of the variation in Y, the model run in multiple regression is the detailed description of the model, it provides valuable information about the quality and ability to predict the values of the response variable.
RESULTS
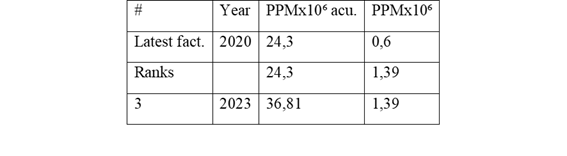
The prediction and optimization report on the multiple regression model run provides information on the accuracy of the model predictions and how they can be optimized. This report is used to evaluate the performance of the model and determine if improvements can be made to the accuracy of the predictions. Therefore, the three-year prediction of the wear sequence in the parameters of the independent variables such as PPMx10⁶ cumulative and PPM x 10⁶, is estimated in Table 3.
Table 3: Data projected to 3 years in the independent variables in the analysis of the wear of the runner of the Francis turbine of the power plant
Applying the equations obtained in the multiple regression for each of the inspection points, project the wear data in Table 4, estimates given by the regression equations considered for the next three years from the last record.
The connection between the variables of the amount of sediment and turbine wear is demonstrated by means of a casual correlation applying the multiple regression method, which shows that the independent variable PPM affects 38 %. Where the equations presented are distributed in linear equations in 72 % and non-linear equations in 28 %. With the results, Fig. 7 shows the projection of wear in subsequent years to the data obtained from the inspection point of “a” in the blades from 1 to 17.
With the analysis performed, a condition maintenance plan (CMP) is the maintenance strategy that focuses on monitoring and analyzing the condition of critical equipment in real-time to identify any signs of deterioration or failure before they are foreseen. This approach allows preventive action to be taken before a failure occurs, which helps reduce downtime and maintenance costs. With the collection of information, data analysis techniques can be used to assess the condition of the turbine and determine the need for preventive maintenance under conditions. Based on the results obtained, preventive measures can be taken, such as replacing or mitigating worn components, cleaning and lubricating components, repairing cracks, or adjusting control systems.
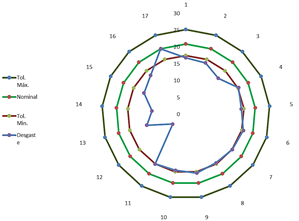
Figure 7: Projection of wear in subsequent years in position “a” on blades 1 to 17 in the Francis impeller.
The hydroelectric power plant has an average annual availability of 97.21 %, reduced by the suspension of power generation due to reservoir flushing and scheduled maintenance shutdowns. While the average annual reliability is 99.89 %, it is reduced by unscheduled failures, this is estimated by the analysis performed where reducing the number of days of interruption of electricity generation due to scheduled maintenance under conditions of low availability.

CONCLUSION
The diagnosis of the current state of the main components of the Francis U1 turbine shows a significant wear in the blade 16 in the inspection points “e” and “f” due to the combined variables such as sediments and accumulated power, evidenced in the non-linear equations, magnitude of the wear up to the present date is the drilling in the blade 16 position f, there is a minimum wear in the blade 14 position h with 11.12 % of the thicknesses of its wall.
The main independent variables that produce the wear of the Francis impeller thicknesses in the hydraulic load with the concentration of sediments in the turbined water that affects 38 % in positions a, b, e, g, i; the electrical generation power 36 % in positions c, d, h, j, k, l and the combination of these two affects 26 % in position f.
By means of a casual correlation applying the multiple regression method, it was found that there was a direct relationship of 72 % in linear equations between sediment concentration and generation power with wear in the turbine, while the remaining percentage mostly in f, g, h, i, j, l with non-linear equations.
The statistical correlation model of wear, amount of sediment and generation power by multiple regression to determine the preventive maintenance by condition improves from 97.27 to 98 % of its availability in the Hydroelectric Power Plant and is reflected in the reduction of days of no electricity generation considering that it affects another plant by the use of the turbined waters of the plant.
The condition maintenance plan is useful to optimize the availability and reliability of an electric generation turbine. This is achieved by continuously monitoring the condition of the turbine and taking preventive measures based on the reduction of annual shutdowns from three to one shutdown per year at the hydroelectric power plant.

