INTRODUCTION
In industrialized countries, the focus is on regulating the manufacturing processes of all vehicles, including motorcycles, to provide society and the planet with an environment of safety and care (Hasegawa & Kaneko, 2017; Moore, 2005; Nguyen Duy, 2021). In Ecuador, the NTE INEN 935 standard establishes the technical requirements that gasoline must meet for commercialization, regulating aspects such as quality, octane number, sulfur content, and other important parameters to ensure optimal engine performance and minimize environmental impact. The responsibility for ensuring that gasoline complies with these specifications falls on the Public Company Petroecuador (EPP), while service stations are responsible for its distribution (Noroña Merchan et al., 2018). The search for more efficient and faster forms of transportation, along with caution regarding the use of mass transportation due to the pandemic, has led to a significant increase in the number of motorcycles in the country. It is important to note that home delivery services play a significant role in this increase.
According to data from the Ecuadorian Automotive Association, around 14.189 motorcycles were sold in Ecuador in 2021, indicating a growing trend in the presence of motorcycles in the country's vehicle fleet (AEADE, 2021). In addition, the public transport service has evolved, incorporating tricycles, according to the census of the Municipal Transit Authority (ATM), with 3.195 tricycles registered only in Guayaquil and regulated by regulations in the province of Guayas (Fuentes Maquilon & López Suárez, 2018).
As for gasoline, it contains hydrocarbons with carbon and is marketed in two types: 85 octane (Extra), 87 octane Ecopaís and 95 octanes (Super Premium) according to the 2022 pilot plan of the Public Company Petroecuador (Lugmania Paillacho & Paillacho Aules, 2023). The quality of these gasolines is regulated by the NTE INEN 935 standard. Although it conforms to Ecuadorian standards, the quality of the gasoline generates uncertainty, since it only meets the Euro 1 quality standard or lower, being one of the lowest in the region and generating discrepancies with European regulations (Pazmiño-Viteri et al., 2024; Toro et al., 2023).
METHODOLOGY
Fuel sold in Ecuador
Fuel is any material capable of releasing energy when burned and then changing or transforming its chemical structure. The term fuel is limited to those substances that burn easily in air or oxygen by emitting substantial amounts of heat. It involves the release of an energy from its potential form into a usable form (because it is a chemical reaction, it is known as chemical energy) (Encalada & Ñauta, 2010). The gasoline sold in the city of Guayaquil comes from the La Libertad refinery (Montero Mosquera, 2020). This refinery around 45.000 barrels per day of derivatives with an average annual load of 14´850.000 barrels (Coral Guerrero & Encalada Rojas, 2017).
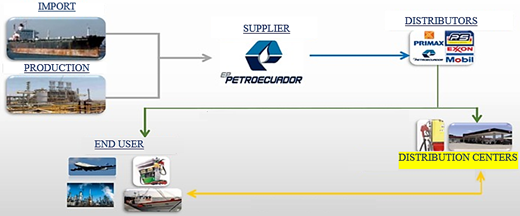
The commercialization of petroleum and its derivatives in Ecuador is carried out by EP Petroecuador through the National and International Marketing Departments, following internal processes to meet local demand, with optimal quality standards with social and environmental responsibility (Coral Guerrero & Encalada Rojas, 2017). The supply and marketing of fuels at the local level is summarized in Figure 1 below (Coral Guerrero & Encalada Rojas, 2017).
The most used fuels in the automotive industry are gasoline, diesel, and liquefied petroleum gas. Gasoline is a product obtained through the fractional distillation of crude oil, which means that depending on the crude oil being processed, it can either be a single fraction or a blend of several fractions. Gasoline consists of a mixture of hydrocarbons with relatively low molecular weight. It must be volatile enough to burn easily and improve cold starts, but not so volatile that it generates excessive vapor in hot weather conditions (ICCT, 2011). In Ecuador, the predominant fuels for taxis and motorcycles are Extra and Ecopaís gasoline. Notably, 70% of the motorcycles in the country are of Chinese origin (AEADE, 2023), meaning their emission regulations adhere to China’s National Stage III standard, equivalent to Euro 3. This standard imposes significantly lower emission requirements compared to those for automobiles (Deng et al., 2019).
Gasoline sold in Ecuador
The most important parameter of our gasoline is the octane number. Three types of gasoline are used in the country: Super, Eco-País and Extra (Fernández Mora & Mideros Mora, 2023; Herrera-Franco et al., 2022). The octane number of the engine correlates with the anti-knock performance of commercial internal combustion engines under severe operating conditions. This engine octane number is used by engine manufacturers, petroleum refiners and retailers, and in commerce as a related primary specification measurement for the pairing of fuels and engines (Instituto Ecuatoriano de Normalización, 2013a).
Eco-País gasoline, a biofuel composed of 5% bioethanol (from sugar cane) and 95% base gasoline (Terneus-Páez & Viteri-Salazar, 2023). Eco-País has the same octane rating (87 octane) and price of Extra gasoline. For the production of Extra gasoline with 87 octanes, it is necessary to mix 76% of high-octane naphtha (NAO), which is imported, with 24% of low-octane naphtha (NBO); while for the production of ECOPAÍS, with the same amount of octane, 62% of NAO, 33% of NBO and 5% of bioethanol are required (Castillo-Hernández et al., 2012). Super gasoline is the highest quality fuel found in the city of Guayaquil for use in high-performance vehicles. It is used in engines that have a high compression ratio. Mainly the isoparaffinic and aromatic hydrocarbons (benzene chains that raise the octane index) found in super gasoline resist high pressures and temperatures (INSST, 2013).
Importation and sales of motorcycles in Ecuador
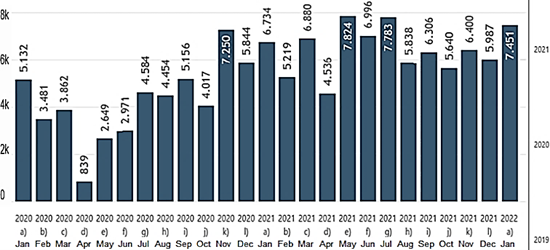
Figure 2 shows the number of motorcycles that were imported from 2019 to 2021 according to reports from the Association of Automotive Companies of Ecuador.
Regulations for indicating the technical characteristics of fuel
In Ecuador there is the NTE INEN 935 Standard (Instituto Ecuatoriano de Normalización, 2021) (Diario Oficial de las Comunidades Europeas, 1998), which is responsible for establishing what value according to parameter the gasoline that is being sold must meet, in Table 1 below you can see these mandatory characteristics (Freepik, 2022; Tribologik, 2013; Motorgiga, 2000).
Table 1 Ecuadorian Regulations NTE INEN 935
| Requirements | Unit | Minimum | Maximum | Test Method a |
|---|---|---|---|---|
| Octane Number Research (RON) | -- | 92,0 | -- | NTE INEN 2102 ASTM D2699 |
| Distillation Temperature: 10% | °C | - | 70 | ASTM D86 |
| 20% | °C | 77 | 121 | |
| 90% | °c | -- | 190 | |
| End Boiling Point | °c | -- | 220 | |
| Distillation residue | %c | -- | 2,0 | |
| Temperature for vapor/liquid ratio equal to 20 | °c | 56,0 | -- | ASTM D5188 |
| Vapor Pressure | kPa | -- | 60,0 | ASTM D323 ASTM D4953 ASTM D5191 |
| Corrosion of copper foil (3 h at 50 °C) | -- | -- | No, 1 | ASTM D130 |
| Rubber content | mg/100 mL | -- | 4,0 | ASTM D381 |
| Sulphur content | % rt | - | 0,0450 | ASTM D2622 ASTM D4294 ASTM D5453 |
| Aromatic content | %c | - | 35,0 | ASTM D1319 ASTM D6730 ASTM D6733 |
| Benzene content | %c | - | 2,00 | ASTM D3606 ASTM D5580 ASTM D6277 ASTM D6730 |
| Olefin content | %c | - | 25,0 | ASTM D1319 ASTM D6730 ASTM D6733 |
| Oxidation stability | min | 240 | - | ASTM D525 ASTM D7525 |
| Lead content | mg/L | - | 1,0 | ASTM D3237 ASTM D5059 ASTM D5185 |
| Manganese content | mg/L | -- | 1,0 | ASTM D3831 ASTM D5185 |
| Iron content | mg/L | - | 1,0 | ASTM D5185 |
RESULTS AND DISCUSSION
Selection of petrol stations
We proceed to investigate which selected gas stations are operational in the province of Guayas, which includes Guayaquil, Samborondón and Durán, to place them in a list as shown in Table 2, after this we have the purpose of choosing fuel samples for their respective analysis.
Table 2 List of selected gas stations in Guayas
| Sector | Address |
|---|---|
| Guayaquil | Portete De Tarqui/ Juan Pío Montúfar y Guaranda |
| Guayaquil | Capitán Nájera/ Entre Rumichaca y Noguchi |
| Guayaquil | Gómez Rendon/ Entre Carchi y Tungurahua |
| Guayaquil | Av. 25 de Julio in the South |
| Durán | Av. Nicolás Lapenti y Durán 092409 |
| Durán | El Recreo |
| Durán | Before toll Durán Tambo |
A market analysis is carried out at these gas stations and the method used was the counting of motorcycles (Motorecambios VFerrer, 2020; Toledo Montaleza, 2016) at each service station in such a way that it can be achieved to have an idea of the influx, this is detailed in Table 3.
Table 3 Influx of motorcycles at gas stations
| Gas stations | Number of motorcycles |
|---|---|
| Portete de Tarqui/ Juan Pío Montufar y Guaranda | 50 |
| Capitán Nájera/ Entre Rumichaca y Noguchi | 190 |
| Gómez Rendon/ Entre Carchi y Tungurahua | 619 |
| Av. 25 de Julio in the South | 515 |
| Av. Nicolás Lapenti y Durán 092409 | 435 |
| El Recreo | 510 |
| Before toll Durán Tambo | 300 |
Considering that the Dixon statistical analysis (Statologos, 2022), it lets us know if there is an outlier in a dataset that should be discarded. That said, we relied on this criterion to be able to select the number of gas stations that are going to be chosen to sample, it was determined that it had to be a minimum of 3 gas stations since, to apply Dixon to the results obtained. It determines that the number of samples to apply this theory is from a minimum of 3 to 30 samples maximum (Rorabacher, 1991), as shown in Table 4.
This selection of 3 gas stations is due to the excessive cost of the laboratories to analyze the fuel of approximately $2.500 for each sample. The gas stations selected are Gómez Rendón, Portete and vía Durán Tambo according to Dixon's analysis.
Table 4 Snippet of the amount of data Dixon analyzes
| Confidence level | |||||||
|---|---|---|---|---|---|---|---|
| N b | 80% (∝ = 0,20) | 90% (∝ = 0,10) | 95% (∝ = 0,05) | 96% (∝ = 0,04) | 98% (∝ = 0,02) | 99% (∝ = 0,01) | |
| 3 | 0,886 | 0,941 | 0,970 | 0,976 | 0,988 | 0,994 | |
| 4 | 0,679 | 0,765 | 0,829 | 0,846 | 0,889 | 0,926 | |
| 5 | 0,557 | 0,642 | 0,710 | 0,729 | 0,780 | 0,821 | |
| 6 | 0,482 | 0,560 | 0,625 | 0,644 | 0,698 | 0,740 | |
| 7 | 0,434 | 0,507 | 0,568 | 0,586 | 0,637 | 0,680 | |
| 8 | 0,399 | 0,468 | 0,526 | 0,543 | 0,590 | 0,634 | |
Note: In the table you can see 3 samples, but there are 30 samples
Source: Statologos (2022)
Selection of laboratories
For the selection of laboratories, the difficulty in Ecuador is to find a laboratory where all the necessary tests are carried out.
Below is the list of laboratories that carry out these tests, however, for this project we only worked with 2, which are the laboratory of the Department of Petroleum, Energy and Pollution of the Central University and the laboratory of Fuels, Biofuels and Lubricating Oils of the National Polytechnic School. Table 5 shows the list of laboratories that were investigated to make the respective quotation.
Table 5 Researched laboratories for samples
| Laboratory Name | City |
|---|---|
| Instrumental Chemical Analysis Laboratory (ESPOL) | Guayaquil |
| Department of Petroleum, Energy and Pollution (Central University) | Quito |
| Laboratory of Fuels, Biofuels and Lubricating Oils (National Polytechnic School) | Quito |
| PetroEcuador Laboratories | Guayas |
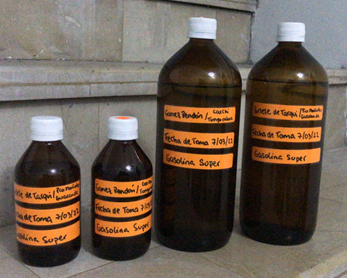
Each laboratory has its fundamental requirements for the correct collection and transport of samples. The fuel is stored in an amber glass jar and moved to a temperature of no more than 30 degrees.
Another requirement is to place a label on the bottle indicating where they come from, the date of the sample and the type of gasoline, in this way we can avoid confusion at the time of analysis.
Figure 3 shows 4 amber containers, 2 of 250 milliliters, which are the smallest, these were delivered to the laboratory of the Central University of Ecuador, and the other two of 1 liter were delivered to the National Polytechnic School.
The results of the selected laboratories are placed in Table 6 to visualize the difference in the values obtained according to the ASTM D86 standard (Laboratorios DPEC y LACBAL, 2022; Universidad Internacional del Ecuador, 2021).
Table 6 Laboratory test results
| Parameters | Unit | Gómez Rendon | Portete | Via Durán Tambo | |
|---|---|---|---|---|---|
| Octane Count, RON | N/A | 92,4 | 95,1 | 91,1 | |
| 10% | °C | 54 | 71,2 | 35 | |
| 50% | °C | 102,5 | 116,3 | 54,9 | |
| 90% | °C | 168,6 | 172,9 | 165,4 | |
| End Boiling Point | °C | 215,6 | 210,7 | 201,6 | |
| Distillation Residue | % | 1 | 1 | 1 | |
| Steam Pressure | kPa | 53 | 54 | 55,5 | |
| Corrosion Of Copper Foil (3h At 50°C) | N/A | 1ª | 1a | N/A | |
| Rubber Content | mg/100mL | 0,6 | 0,8 | 1 | |
| Sulphur Content | % | 0,00279 | 0,00232 | 0,00208 | |
| Lead Content | mg/L | 0 | 0 | N/A | |
| Manganese Content | mg/L | 0 | 0 | N/A | |
| Iron Content | mg/L | 0 | 0,017 | N/A | |
As shown in the results, there are variations in each of the parameters, so the Minitab application is used to know the normality criterion, which is a determining detail to apply the Dixon method and thus establish the gas station that provides the best parameters.
Application of Dixon's theory in parameter vehicles
Minitab software is used, to know the criterion of normality and then apply Dixon's theory in each parameter of the results obtained in the laboratory of Super gasoline, to determine the feasibility of each of the 3 gas stations established and thus validate the results. To be able to apply Dixon to the values obtained by the laboratories, it is essential to know that the data set follows a normal distribution. The Minitab program was used to find out if it effectively complies with the analysis of knowing how much the distribution of the data obtained differs based on the expected data.
Placing Data in Minitab Sheet
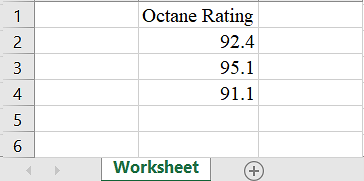
The values obtained are placed on the worksheet (Figure 4), it is necessary to include a title to keep a correct order.
Normalcy Test Selection in Minitab
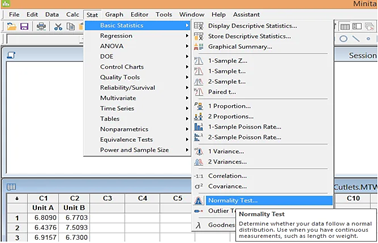
You look for the stats tab (Figure 5), where you select basic stats, then normality test (Rodó, 2006).
d en Minitab
Anderson-Darling Test Selection
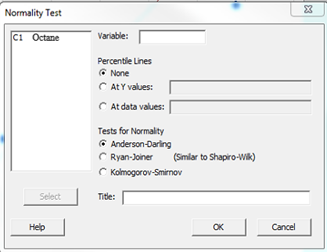
A screen is displayed with the different tests that can be performed to check normality, in this case Anderson-Darling was selected (Flores Tapia & Flores Cevallos, 2021). Select the dataset that belongs to C1 on the left and click OK (Figure 6).
Obtaining a graph of the Normality Criterion
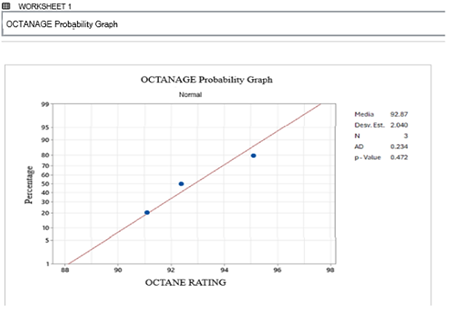
As can be seen in Figure 7, a p-value is obtained, which serves as a criterion to determine whether the set of results for Super gasoline follows a normal distribution.
Normality test results applying Anderson-Darling in Minitab
Below is a breakdown of normality testing by applying Anderson-Darling in Minitab software (Closas et al., 2010), of each of the parameters investigated, i.e. octane number, distillation temperature at 10%, 50%, 90%, boiling endpoint, vapour pressure, gum content and sulphur content.
Octane Normality Test
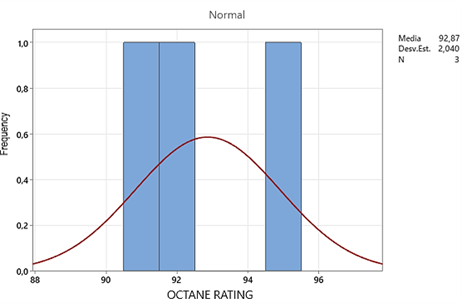
Analyzing the octane parameters in Minitab shows that the obtained value of P = 0,472 > 0,05 (Figure 8). Since the p - value is greater than the significance value of 0,05, the probability that the data obtained at the three gas stations follows a normal distribution cannot be rejected. In the case of this parameter, the highest-octane parameter, which is the Portete gas station, will be taken as a base.
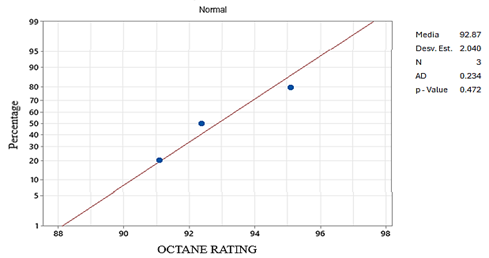
Figure 9 shows the histogram of how this dataset follows a normal distribution.
Results obtained by applying Dixon by choosing maximum and minimum values of each parameter, results for all parameters applying Dixon
This test is performed to find out if one of the parameter values has an outlier and this is given according to the criterion formula called Q. Here is indicated how this criterion is obtained, based on the octane parameter, and the same steps must be replicated to all the other parameters.
To perform this analysis, you must determine the critical value Q (Rorabacher, 1991), that in this research a confidence level of 95% and a sample number N° 3 are taken, since our population covers only 3 data points which are gas stations. In conclusion, the critical Q is 0,97 as can be seen in Table 7, so any value obtained in the Dixon tests below must be less than 0,97 in order not to be considered rejected because it is an outlier.
Table 7 Dixon test critical values
| Confidence Level | ||||||
|---|---|---|---|---|---|---|
| N b | 80% (∝ = 0.20) | 90% (∝ = 0.10) | 95% (∝ = 0.05) | 96% (∝ = 0.04) | 98% (∝ = 0.02) | 99% (∝ = 0.01) |
| 3 | 0,886 | 0,941 | 0,970 | 0,976 | 0,988 | 0,994 |
| 4 | 0,679 | 0,765 | 0,829 | 0,846 | 0,889 | 0,926 |
| 5 | 0,557 | 0,642 | 0,710 | 0,729 | 0,780 | 0,821 |
| 6 | 0,482 | 0,560 | 0,625 | 0,644 | 0,698 | 0,740 |
| 7 | 0,434 | 0,507 | 0,568 | 0,586 | 0,637 | 0,680 |
| 8 | 0,399 | 0,468 | 0,526 | 0,543 | 0,590 | 0,634 |
| 9 | 0,370 | 0,437 | 0,493 | 0,510 | 0,555 | 0,598 |
| 10 | 0,349 | 0,412 | 0,466 | 0,483 | 0,527 | 0,568 |
| 11 | 0,332 | 0,392 | 0,444 | 0,460 | 0,502 | 0,542 |
| 12 | 0,318 | 0,376 | 0,426 | 0,441 | 0,482 | 0,522 |
| 13 | 0,305 | 0,361 | 0,410 | 0,425 | 0,465 | 0,503 |
| 14 | 0,294 | 0,349 | 0,396 | 0,411 | 0,450 | 0,488 |
| 15 | 0,285 | 0,338 | 0,384 | 0,399 | 0,438 | 0,475 |
| 16 | 0,277 | 0,329 | 0,374 | 0,388 | 0,426 | 0,463 |
| 17 | 0,269 | 0,320 | 0,365 | 0,379 | 0,416 | 0,452 |
| 18 | 0,263 | 0,312 | 0,356 | 0,370 | 0,407 | 0,442 |
| 19 | 0,258 | 0,306 | 0,349 | 0,363 | 0,398 | 0,433 |
| 20 | 0,252 | 0,300 | 0,342 | 0,356 | 0,391 | 0,425 |
| 21 | 0,247 | 0,295 | 0,337 | 0,350 | 0,384 | 0,418 |
| 22 | 0,242 | 0,290 | 0,331 | 0,344 | 0,378 | 0,411 |
| 23 | 0,238 | 0,285 | 0,326 | 0,338 | 0,372 | 0,404 |
| 24 | 0,234 | 0,281 | 0,321 | 0,333 | 0,367 | 0,399 |
| 25 | 0,230 | 0,277 | 0,317 | 0,329 | 0,362 | 0,393 |
| 26 | 0,227 | 0,273 | 0,312 | 0,324 | 0,357 | 0,388 |
| 27 | 0,224 | 0,269 | 0,308 | 0,320 | 0,353 | 0,384 |
| 28 | 0,220 | 0,266 | 0,305 | 0,316 | 0,349 | 0,380 |
| 29 | 0,218 | 0,263 | 0,301 | 0,312 | 0,345 | 0,376 |
| 30 | 0,215 | 0,260 | 0,298 | 0,309 | 0,341 | 0,372 |
Table 8 details the values to be used for the Dixon analysis.
Results for all parameters applying Dixon
As can be seen in Table 9, Dixon is applied for each parameter (number of octanes, distillation temperature at 10%, 50%, 90%, boiling endpoint, vapor pressure, gum content and sulfur content) for each parameter there is a population of 3 samples, for the calculation of the outlier value was considered for both the maximum and the minimum value of the data set.
After applying the respective formula, the values detailed in the calculated Q column were collected, because all the values shown in Table 7 do not exceed the critical Q (0,97), it is determined that there are no outliers (Chorro, 2010), that said, it is concluded that all values within this population can be selected for analysis.
As shown in Table 9, the gas station that complies the most is La Portete, therefore it is verified with the INEN 935 standard (Instituto Ecuatoriano de Normalización, 2013b).
Table 9 Q Results calculated for Dixon tests
| Parameters | Unit | Portete | Gómez Rendón | Vía Durán Tambo | Q Calculated | |
|---|---|---|---|---|---|---|
| Greater Value | Lover Value | |||||
| Octane Number, RON | N/A | 95,1 | 92,4 | 91,1 | 0,675 | 0,325 |
| Distillation Temperature 10% | °C | 71,2 | 54 | 35,0 | 0,47513812 | 0,52486188 |
| Distillation Temperature 50% | °C | 116,3 | 102,5 | 54,9 | 0,2247557 | 0,7752443 |
| Distillation Temperature 90% | °C | 172,9 | 168,6 | 165,4 | 0,5733333 | 0,4266667 |
| End Boiling Point | °C | 210,7 | 215,6 | 201,6 | 0,35 | 0,65 |
| Distillation Residue | % | 1,0 | 1,0 | 1,0 | N/A | N/A |
| Vapor Pressure | kPa | 54 | 53 | 55,5 | 0,6 | 0,4 |
| Rubber Content | mg/100mL | 0,800 | 0,600 | 1,0 | 0,5 | 0,5 |
| Sulphur Content | % | 0,00252 | 0,00279 | 0,00208 | 0,66197183 | 0,33802817 |
CONCLUSIONS
Although no outliers were found in the analyzed parameters, the differences in the octane number between the stations suggest variations in fuel quality, with the gasoline from the Portete station being of the highest quality, with an octane rating of 95,1 RON, exceeding the minimum requirements established by the INEN 935 standard.
The differences in the distillation curves at 50% and 90%, as well as the final boiling point, indicate that the analyzed gasoline samples show significant variations in their composition, suggesting on-site blending at service stations. These variations in parameters can directly affect fuel quality and, consequently, engine performance. It is recommended to include the color parameter in future studies, as it can provide a clear visual indication of fuel blending. Continuous supervision and validation by the relevant authorities are essential to ensure that these parameters comply with the INEN 935 standard and to guarantee consistency in the final product quality.
Although the Hydrocarbon Regulation and Control Agency (ARCH) already monitors the fuel sold in Ecuador, it is concluded that strengthening quality control at all service stations is crucial to ensure that the fuel consistently meets the INEN 935 standard. This will help improve the quality of fuel available in the market and mitigate possible variations that could affect engine performance. Furthermore, it is concluded that this monitoring should include more frequent and detailed evaluations, enabling the timely identification and correction of any deviations in quality parameters.
Fuel distributors must ensure proper transportation from the point of origin to delivery, implementing constant inspections of the containers. The sharing of periodic test results at service stations is also key to building consumer trust, which can be achieved through communication of the results via social media or directly at the stations. The proper implementation of these processes promotes transparency, continuous improvement, and regulatory compliance, contributing to increased consumer confidence in the fuel industry.


