INTRODUCTION
The search for cultural indicators has a broad trajectory since the mid-twentieth century through the impulse given by international organizations and government institutions. In recent decades, the objective has been widely developed in several Latin American countries. However, Ecuador is one of the territorial entities that still lacks its own indicators, studies, and analysis of the cultural sector.
In any case, there are two works made up to the present: the Latin American Survey of cultural habits and practices 2013, prepared by the Organization of Ibero-American States, based on the work of the Ibero-American Observatory of Culture (OIBC) with the collaboration of Latino Barómetro, that collects a sample about Ecuador; and the analysis of habits and cultural practices in the Machala canton 2014, capital of El Oro.
From another analytical setting, there is an extensive bibliographic repertoire on cultural topics based on theoretical-methodological constructions and empirical research from the classical contributions of the Center for Contemporary Cultural Studies in Birmingham and the Bourdieu's studies. While in the Latin American social sphere, the contributions of Canclini (2006) and Sunkel (2006) should be referenced, among others.
In recent years, the interest in this object of study has been transferred to the university context with the studies of Ben (2006) and De Garay (2016), although their productions are still scarce. In any case, the great majority of these contributions focus on specific and particular aspects with different objects and approaches.
Regarding territorial studies developed in university contexts, we need to highlight the significant contributions made in Mexico by Rosas (2002), also in Flores et al. (2009), Bañales (2014) and, to a lesser extent, studies that have been made on university population in Chile by Güell, Morales and Nuñez (2011); Colombia by Arango, Castañeda and Ramírez (2016); and Cuba by Gómez, Riverón, Griñan, León and Yarenis (2017) among others.
In terms of their analysis topics, they address almost exclusively to the consumption of new technologies through the studies of Aguilar-Barceló and Ramírez-Angulo (2006); Hinojosa-Córdova and Silva-Corpus (2008); Santamaría and Yurén (2010); Pini, Musanti, Kaufman and Amaré (2012); Osorio, Molero, Pérez and Mercader (2014); Fernández-Villa et al. (2015); Sanvicén and Molina (2015); Casillas, Ramírez and Ortega (2016); Gisbert and Esteve (2016); López (2016); Romero-Rodríguez and Aguaded (2016); Ruano, Congote and Torres (2016); Paspuel and Palacios (2018) and Rojas, Jiménez-Fernández and Rodríguez (2018).
This line of research in the university field has not had an impact on the Ecuadorian scientific production until now; therefore, justifies this study as part of a larger project that aims to provide data on cultural habits and practices in the Ecuadorian university context. In addition, these indicators do not only outline the profile of the student but can also contribute to a process of integral formation and may also provide valuable information to the institution when making decisions in the design of its cultural offer as indicated by Hinojosa-Córdova and Silva-Corpus (2008) and Flores et al. (2009).
METHODOLOGY
This research is aimed to obtain indicators and evaluation of the main consumption, habits, and cultural practices of university students of the UNAE, this constitutes the main objectives of the research. Its theoretical foundation rests on the initial framework proposed by Canclini (2006) and Bigott (2007), although bearing in mind the socio-historical changes generated from the new forms and ways of consumption derived from the incorporation and development of new technologies.
From this perspective, previous conceptualizations are necessary. In the first place, this process of appropriation and use of technological and cultural devices are not conceived from an economic perspective, but from the construction of meanings that can decipher social behaviors. On the other hand, a habit is understood as the frequent cultural behavior of some cultural activities, which should not necessarily be associated with the practice of such activities while the concept practice is used for specific sectors such as recorded music, video, television, radio, computer, and the Internet.
Generally, we investigate to know different periods in order to estimate the frequency of the habit without this indicating its practice, as we have already mentioned. While a specific cultural activity carried out in a certain period, intensity, that is, how many times or how much time is dedicated to it, is conceived as a cultural practice.
The methodology used is quantitative of descriptive-analytical order, based on the data collected in a survey applied on a population sample, made up of 438 students between the different careers and cycles offered by the UNAE.
A proportional stratified sampling made the selection of the population of the undergraduate students of the five careers of the National University of Education corresponding to the period September-February 2018 with a margin of 95% reliability and a 5% error.
The sample amounted to 438 students, and its selection responded to the distribution by gender in the total enrollment of the university, 63% female 37% male. The groups corresponded to the five undergraduate courses and the subgroups of the different cycles: Basic Education (six cycles), Intercultural Bilingual Education (six cycles), Initial Education (six cycles), Special Education (four cycles) and Education in Experimental Sciences (two cycles). Each degree presents a different amount of population; therefore, the selected sample responded to that characteristic. In Basic Education, 234 students were selected, in Initial Education 78, in Intercultural Bilingual Education 50, in Special Education 53 and Experimental Sciences 26.
From the practical point of view, the methodological-technical considerations contemplated in the various surveys prepared by the Ministry of Education, Culture and Sport of Spain, the Ibero-American Observatory of Culture and the Satellite Accounts of Culture have been studied and incorporated. The result of this process has been the design of a base instrument adapted and contextualized to the university scenario, which has been subjected to a pilot test procedure and continuous checking.
The applied survey is structured in three general modules (students' identification data, cultural facilities and interest in cultural activities), and twelve sectorial modules (museums, art galleries, archives, arts and craft fairs, House of Culture, monuments, archaeological sites, reading and library, ballet or dance, opera and theater, concerts of classical and modern music, film and video, music, television, radio, computer and Internet, use of free time practices related to leisure and culture, and finally, a section dedicated to the cultural actions and programs deployed by UNAE and to the participation and interest of the student population.
In the specific case of the essential aspects addressed in this work, it has been tried to detect the availability by the students of the supports and typologies related to the new technologies (computer, the Internet and cellular phones, etc.) as well as to probe their use, characteristics, frequency and intensity of temporary habit, motives, preferences and tastes, habit of the different modalities of acquisition, time allocated to those activities, etc.
The data collection was carried out through a survey that contained 194 questions distributed in fifteen sections, referring to cultural habits and practices. The questions corresponding to ICT amounted to 39, which are distributed in all the sections.
The survey was applied face-to-face and online, through the Google Forms platform and carried out in the computer labs of the University, with the assistance of the members of the research team. The reference period for collecting the information was carried out during February 2018. The intervention was carried out in cycles, and the students responded to the survey in an approximate time of 30 to 40 minutes.
CHARACTERIZATION OF THE UNAE STUDENT POPULATION ANALYZED
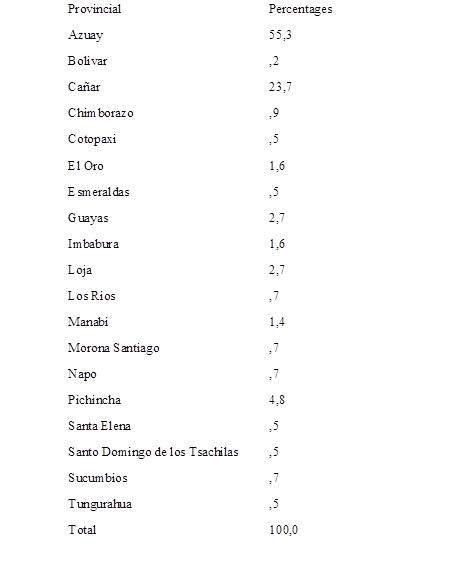
The different characteristics of the surveyed students are in direct consonance with the totality of the UNAE university population. From the point of view of territorial origin there is a predominance of the provinces of Azuay (56%) and Cañar (24%). While the rest of the seventeen provinces represented contribute with scarcely relevant indexes (Table 1).
Table 1 Provincial distribution of the analyzed universe of the students of the National University of Education of Ecuador (in percentages).
Source: Researchers
In terms of gender distribution, the presence of women stands out (63%) compared to men (37%). With respect to the age groups, the established classification shows that a little more than ¼ of the students have advanced ages related to the common age of the university students in correspondence to the cycles they attend. Thus, 71% are grouped between 18 and 22 years; 22% between the ages of 23 and 27; 5% between the ages of 28 and 32; 1.4% between 33 to 47 years old; and 1% has more than 38 years.
The configuration of the marital status reflects a majority of single (90%) as opposed to married (6%), free union and separated 2% respectively. However, 13% of students have family responsibilities, 10% are parents of a child, 2% are parents of two children and 0.5% have three children.
From ethnic self-recognition, 96% define themselves as mestizos, 2% indigenous, 1% montubio and 1% afro-Ecuadorians.
In relation to the classes they attend, we must point out that 53% are enrolled in Basic General Education, 18% in Initial Education, 12% in Special Education, 11% in Intercultural Bilingual Education and 6% in Education. Experimental sciences. And since its distribution by semester cycles, 34% correspond to the first cycle, 20% to the second, 18% to the third, 10% to the fifth, and 9% respectively to the fourth and third cycle.
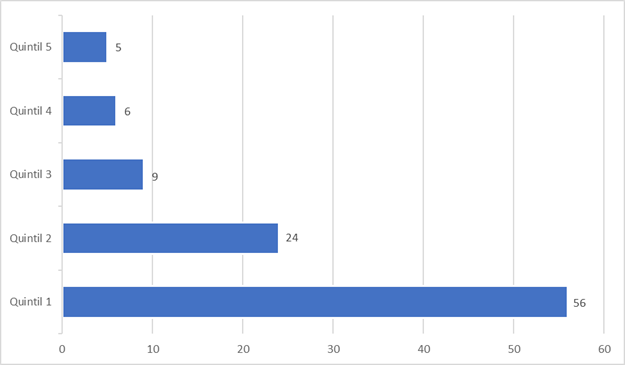
It should also be noted that 75% of the students surveyed have scholarship grants awarded by the University itself and the Institute for the Promotion of Human Talent. Finally, 62% of the students analyzed are in a state of family dependence and 80% are in the most precarious quintiles (see Figure 1).
RESULTS Y DISCUSSION
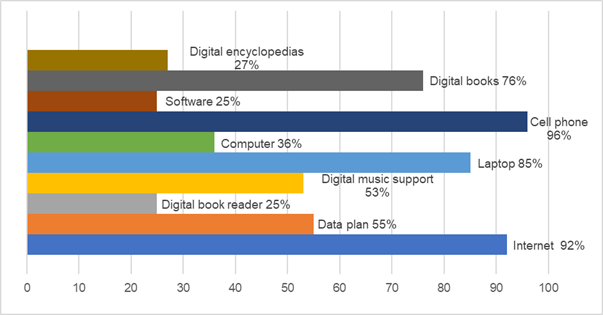
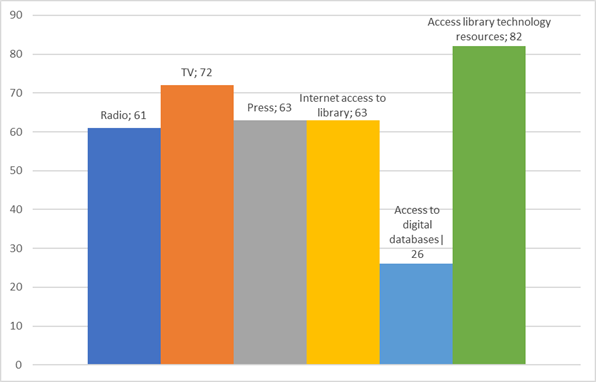
The analysis of the data obtained is divided into two sections: one related to the technological equipment (see Figure 2)) available to students and a second on the use of them (see Figure 3)).
Source: Researchers
Figure 2: Percentage distribution of technological equipment of the students of the National University of Education of Ecuador.
Source: Researchers
Figure 3: Percentage distribution of use and consumption of radio, press among the students of the national University of Ecuador.
TECHNOLOGICAL EQUIPMENT
INTERNET
The majority of tested students have Internet access (92%), although more than half of them do not have a mobile data plan (internet) and only 15.1% have this service, 9.4% women and 5.7% men.
COMPUTER
36.1% of university analyzed students have a desktop computer and 84.7% have a laptop. These data reflect that a significant percentage of students have both devices.
SOFTWARE
24.9% Of these young people have digital book readers and 52.7% have digital music devices. With regard to the availability of specialized software supports, 30.1% have editing and video programs, followed by educational programs (26.5%). Both types of software are distributed in similar proportions between genres. In third place we find the game programs with 22.1%, with a differentiated distribution between males (23.3%) and females (13.9%).
BOOKS AND DIGITAL ENCYCLOPEDIAS
More than 3/4 of the university students have books in digital format (75.6%) and a little more than 1/4 (27.2%) of their own digital encyclopedias.
CELL PHONE
Almost all of the analyzed student population has a cell phone (96%) and a high percentage has a smartphone (70%). With respect to the cost of acquiring smart telephony, it can be seen that it is females (14.4%) who make the biggest investment in these devices, between 200-299 dollars, compared to males (10.5%), which ranges from 100 to 199 dollars. Regarding the monthly cost in cellular telephony, the range of 0 to 19 dollars predominates, both in males (35.2%) and in females (25, 3%).
USE AND CONSUMPTION OF INFORMATION AND COMMUNICATION MEDIA
PRESS AND CULTURAL MAGAZINES
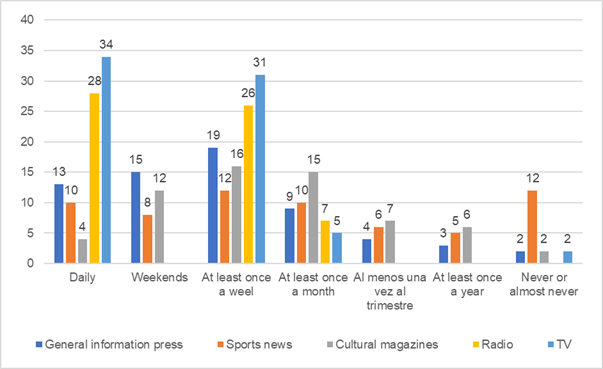
63% Of the analyzed university students are press or magazine readers, distributed in 42% of women and 21% of men. The frequency of reading general information press, both paid and free on the Internet, is a daily 13%; 15% only on weekends; 19% at least once a week; 9% at least once a month; 4% at least once a quarter; 3% at least once a year; and 2% never or almost never.
The frequency of reading sports press, both free and paid on the internet, is 10% daily; 8% only on weekends; 12% at least once a week; 10% at least once a month; 6% at least once a quarter; 5% at least once a year; and 12% never or almost never.
In contrast, the frequency of cultural magazine reading reaches a rate of 4% daily; 12% only on weekends; 16% at least once a week; 15% at least once a month; 7% at least once a quarter; 6% at least once a year; and 2% never or almost never (see Figure 4)).
Source: Researchers
Figure 4: Percentage distribution of frequency of use and consumption of general information press, sports press, cultural magazines, radio and television.
The way they obtain or acquire the press or magazine readings in the last month in free paper format, the information press (16%), the sports press (3%), cultural reviews (9%), other journals (6%).
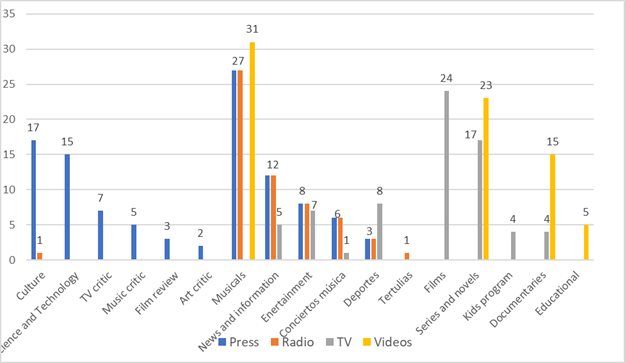
The press sections most read every day are those about culture (17%), science and technology (15%), TV critic (7%), music critic (5%), film critic (3%) and critics of art and exhibitions (2%). Regarding the disbursement made in the purchase of newspapers in the last year, 50% spent between 0 to 20 dollars; 8% between 21 to 30 dollars; 3% between 31 to 40 dollars; and 2% more than 51 dollars. While with regard to spending on magazines in the last year, 55% between 0 to 20 dollars; 6% between 21 to 30 dollars; 2% between 31 to 40 dollars, 1% between 41 to 50 dollars.
RADIO
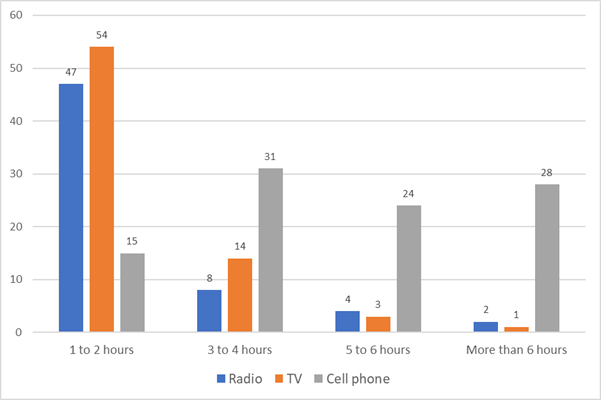
61% Of students usually listened to the radio, distributed among 37% females 23% of males. Of which 28% with a daily frequency; 26% at least once a week; and 7% at least once a month. 47% of the university students surveyed dedicate between one to two hours a day to listen to the radio from Monday to Friday; 8% between three to four hours a day; 4% between five to six hours a day; and 2% more than six hours a day.
With regard to the most listened radio programs, the musical ones stand out (27%), news and information (12%), entertainment programs (8%), music concerts (6%), sports (3%) cultural programs (1 %) and gatherings (1%) (see Figure 5).
TELEVISION
72% Of the examined population tends to watch TV, 46% of women and 26% of men. With respect to the female gender, 21% do it with a daily frequency and 20% at least once a week. While it’s 13% of men with a daily frequency and 10% at least once a week. The most used media to watch TV are television (80%), computers (14%), cell phones (5%) and tablets (1%). With regard to the time they spend watching TV every day from Monday to Friday, 54% spend from one to two hours; 14% between three to four hours; 3% between five to six hours; and 1% more than six hours. While on weekends, 36% spend between one and two hours; 27% between three and four hours; 6% between five and six hours; and 2% more than six hours (see Figure 6).
In relation to the television offer, their preferences are movies (24%), series and novels (17%), sports (8%), entertainment programs (7%), news and information (5%), children's programs (4%), documentaries (4%) and music concert (1%). And as for how often you watch TV, 34% do it daily, 30% at least once a week, 5% at least once a month and 2% never or almost never.
PHONES
21.7% Of university students tested devote between three and four hours a day to the use of the smartphone, 19.6% more than six hours and 16.9% between five and six. This time is distributed almost equally between academic activities (67.8%) and social networks (69.6%) (see Figure 6).
Among the activities of leisure and free time made through the cell phone, we should highlight taking pictures or videos (92.9%) and listening to music (74.9%). While these rates are below 50% related to other activities such as viewing videos, in terms of television and radio, we can state that 71.2% of the population watches television and 61% listens to the radio. However, those same activities carried out through the cell phone are rated below 10%.
INTERNET
The majority of students (96.80%) connect to the internet daily. The activities of leisure and free time made through this media are reduced to viewing videos and listening to music. 86.3% consume videos, 50% through streaming service and 36.3% illegally on the internet. Regarding music, 85.2% make downloads for free over the Internet. And with respect to the acquisition of books, 58.2% do so through the Internet, distributed in free download (28.8%), download with payment (14.8%) and online shopping (14.6%).
COMPUTER
The use of the computer for study purposes, under a daily frequency, is the majority (91.1%) compared to daily use for other reasons (60%). While a lower percentage (35.4%) is at least once a week.
47.3% of the university students analyzed acquired a computer in the last year, of which 34.5% did it for reasons of studies and 12.8% for other reasons. So, the purchase of this device is predominantly due to academic needs.
Regarding leisure and free time activities carried out through the computer, watching videos (42.2%) and television (19.6%) stand out while the indexes of other activities, such as listening to music and radio, are below 5%.
VIDEOS
100% of university students tend to watch videos, 63% of women and 37% of men, with a daily frequency of 77%. As for its themes, they watch musicals (31%), series (23%), documentaries (15%) and educational programs (5%). Among the equipment used to watch them, the cell phone stands out (47%), the computer (42%) and the tablet (3%). The videos are mainly obtained from the internet illegally (50%), through streaming service (6%) and in video stores (5%).
THE TECHNOLOGICAL RESOURCES IN LIBRARIES
63% of the analyzed university students accessed a library online in the last quarter, 14% in the last year, 6% more than a year ago and 17% never or almost never. In terms of the number of times they access a library online, 47% do it from one to ten times; 19% between eleven and twenty times; 3% between twenty-one to thirty, 6% between forty-one to fifty.
82% of university students use the technological resources of the UNAE library, 11% with a daily frequency; 42% at least once a week; 21% at least once a month; and 8% at least once a year.
26% of university students access digital databases, 3% with a daily frequency; 9% at least once a week; 9% at least once a month; and 5% at least once a year.
CONCLUSIONS
The student body of the National University of Education of Ecuador owns a very high technological equipment, led by the cell phone and followed by the internet and laptop. This ownership (acquisition) of the new technological devices seems not to be conditioned by the individual and family socioeconomic situations, since 82% of the university students are assigned to the most precarious social segments in family income (56% in quintile 1 and 26% in quintile 2).
The new technological devices are the main information and communication tools of UNAE students and a common feature is the high number of hours devoted to the use of videos, internet, cellular and television, both daily and weekly. Likewise, there is a general balanced tendency among genders, as well as an almost proportional distribution in the use of these devices for academic tasks as well as social networks


